| Param | Original file | Final file |
|---|---|---|
| Filename | modeM0/AS1A10_073T05_9000004068cztM0_level2.fits | modeM0/AS1A10_073T05_9000004068cztM0_level2_quad_clean.evt |
| Size (bytes) | 1,055,960,640 | 881,222,400 |
| Size | 1007.0 MB | 840.4 MB |
| Events in quadrant A | 6,628,802 | 5,151,679 |
| Events in quadrant B | 6,259,162 | 4,996,862 |
| Events in quadrant C | 6,346,428 | 4,786,777 |
| Events in quadrant D | 5,301,244 | 4,312,089 |
| Mode M0 | |||
|---|---|---|---|
| Quadrant | BADHDUFLAG | Total packets | Discarded packets |
| A | 0 | 223398 | 0 |
| B | 0 | 251880 | 0 |
| C | 0 | 234588 | 0 |
| D | 0 | 362667 | 0 |
| Mode SS | |||
|---|---|---|---|
| Quadrant | BADHDUFLAG | Total packets | Discarded packets |
| A | 0 | 2212 | 0 |
| B | 0 | 2210 | 0 |
| C | 0 | 2212 | 0 |
| D | 0 | 2212 | 0 |
| Mode M9 | |||
|---|---|---|---|
| Quadrant | BADHDUFLAG | Total packets | Discarded packets |
| A | 0 | 189 | 0 |
| B | 0 | 189 | 0 |
| C | 0 | 189 | 0 |
| D | 0 | 189 | 0 |
| Quadrant | Total seconds | Saturated seconds | Saturation percentage |
|---|---|---|---|
| A | 108544 | 911 | 0.839291% |
| B | 108532 | 3551 | 3.271846% |
| C | 108533 | 2390 | 2.202095% |
| D | 108525 | 11641 | 10.726561% |
Noise dominated data is calculated using 1-second bins in cleaned event files. If a bin has >2000 counts, and if more than 50% of those come from <1% of pixels, then it is considered to be noise-dominated and hence unusable.
| Quadrant | # 1 sec bins | Bins with >0 counts | Bins with >2000 counts | High rate bins dominated by noise | Noise dominated (total time) | Noise dominated (detector-on time) | Marked lightcurve |
|---|---|---|---|---|---|---|---|
| A | 144427 | 108602 | 0 | 0 | 0.00% | 0.00% | 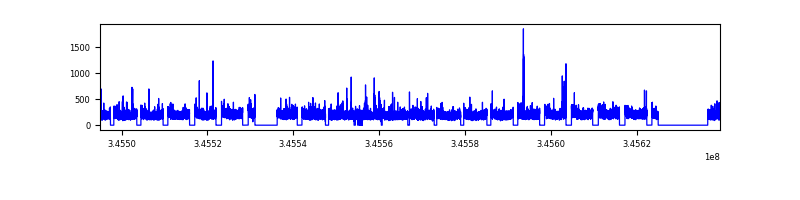 |
| B | 144427 | 108534 | 0 | 0 | 0.00% | 0.00% | 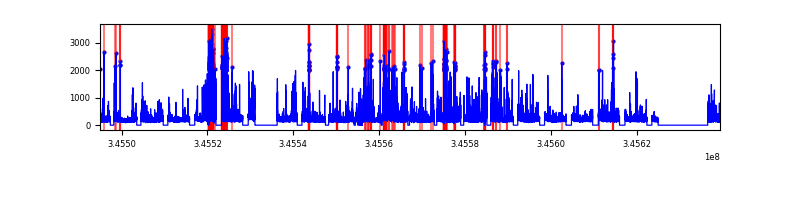 |
| C | 144427 | 108580 | 0 | 0 | 0.00% | 0.00% | 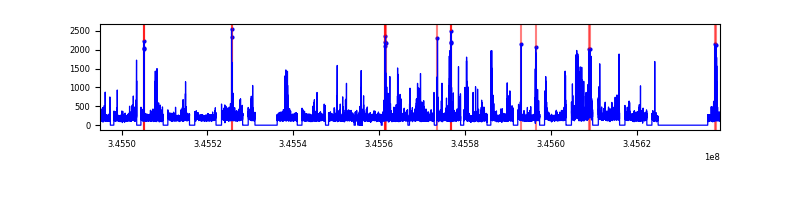 |
| D | 144427 | 108365 | 0 | 0 | 0.00% | 0.00% |  |
Top three noisy pixels from each quadrant. If the there are fewer than three noisy pixels in the level2.evt file, extra rows are filled as -1
| Pixel properties | Quadrant properties | ||||||
|---|---|---|---|---|---|---|---|
| Quadrant | DetID | PixID | Counts | Sigma | Mean | Median | Sigma |
| A | 0 | 29 | 5460 | 9.09 | 1730 | 1629 | 421.6 |
| A | 7 | 110 | 5236 | 8.55 | 1730 | 1629 | 421.6 |
| A | 9 | 19 | 5026 | 8.06 | 1730 | 1629 | 421.6 |
| B | 2 | 9 | 5028 | 10.69 | 1657 | 1586 | 322.1 |
| B | 2 | 8 | 4219 | 8.17 | 1657 | 1586 | 322.1 |
| B | 5 | 128 | 4098 | 7.8 | 1657 | 1586 | 322.1 |
| C | 12 | 241 | 4460 | 6.89 | 1676 | 1573 | 418.9 |
| C | 3 | 126 | 4307 | 6.53 | 1676 | 1573 | 418.9 |
| C | 12 | 250 | 4229 | 6.34 | 1676 | 1573 | 418.9 |
| D | 6 | 38 | 3794 | 5.97 | 1515 | 1383 | 403.5 |
| D | 10 | 189 | 3774 | 5.92 | 1515 | 1383 | 403.5 |
| D | 7 | 3 | 3774 | 5.92 | 1515 | 1383 | 403.5 |
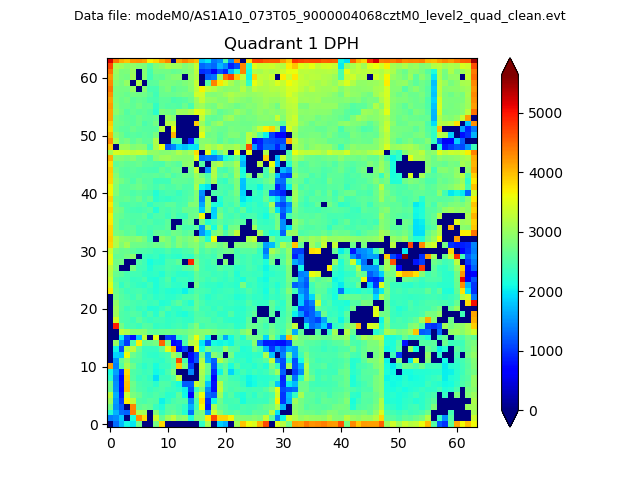
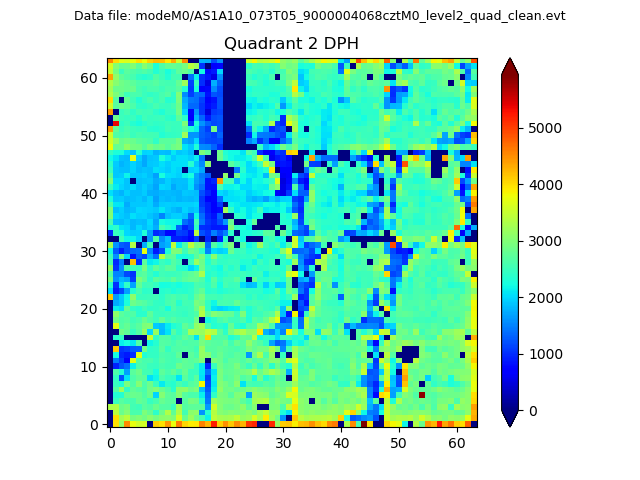
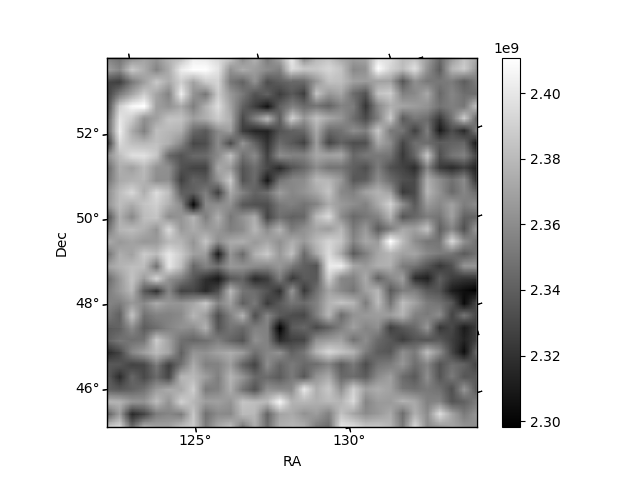
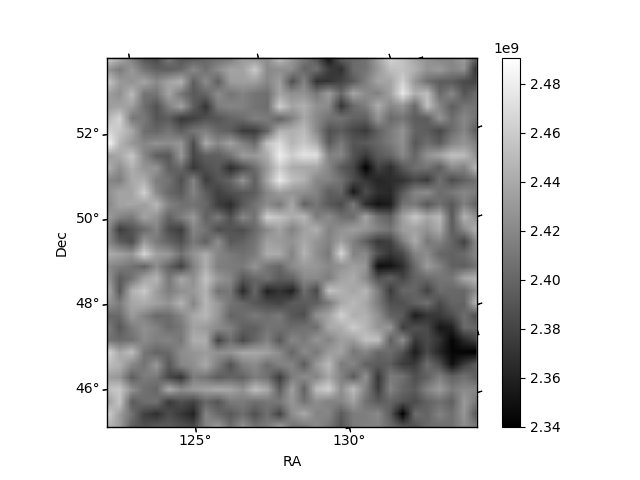
Histogram calculated using DETX and DETY for each event in the final _common_clean file
| Quadrant A | 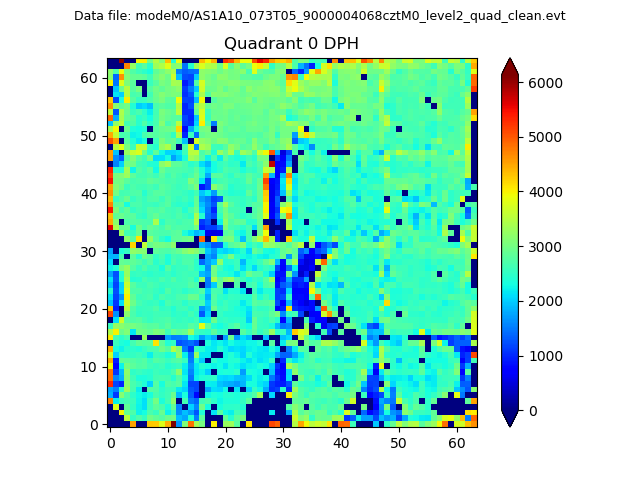 |
 |
Quadrant B |
|---|---|---|---|
| Quadrant D | 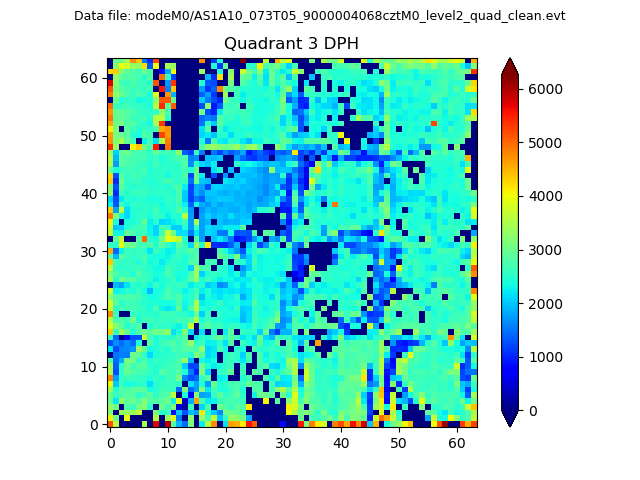 |
 |
Quadrant C |
| Plot type | Count rate plots | Images |
|---|---|---|
| Comparison with Poisson distribution Blue bars denote a histogram of data divided into 1 sec bins. Red curve is a Poisson curve with rate = median count rate of data. |
 |
 |
| Quadrant-wise count rates Data is divided into 100 sec bins |
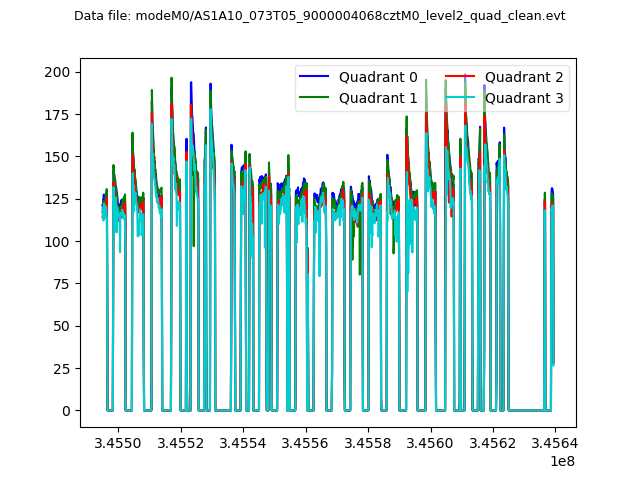 |
|
| Module-wise count rates for Quadrant A Data is divided into 100 sec bins |
 |
 |
| Module-wise count rates for Quadrant B Data is divided into 100 sec bins |
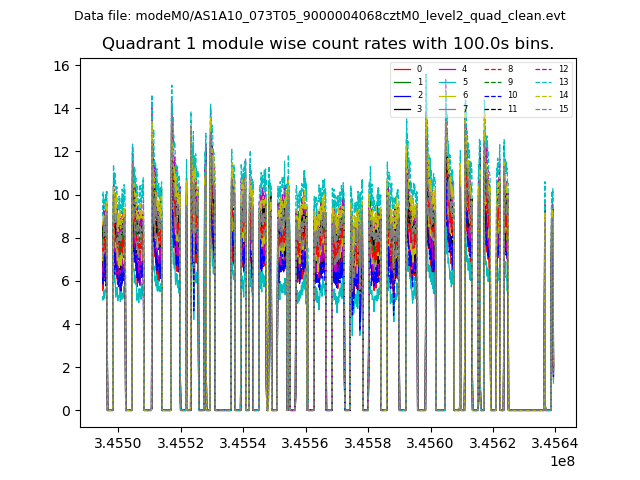 |
 |
| Module-wise count rates for Quadrant C Data is divided into 100 sec bins |
 |
 |
| Module-wise count rates for Quadrant D Data is divided into 100 sec bins |
 |
 |
| Parameter | Plot |
|---|---|
| CZT HV Monitor |  |
| D_VDD | 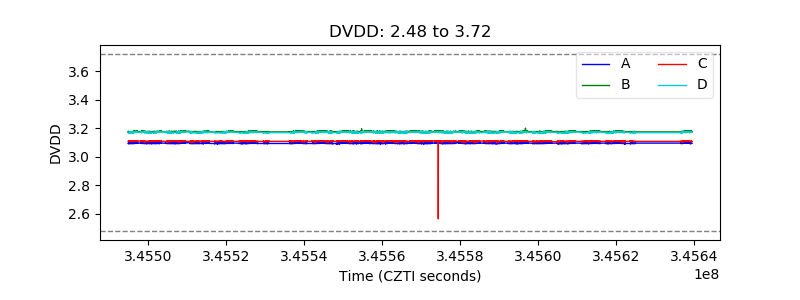 |
| Temperature 1 | 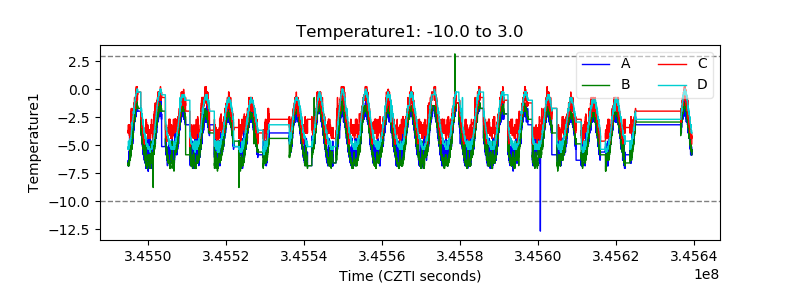 |
| Veto HV Monitor | 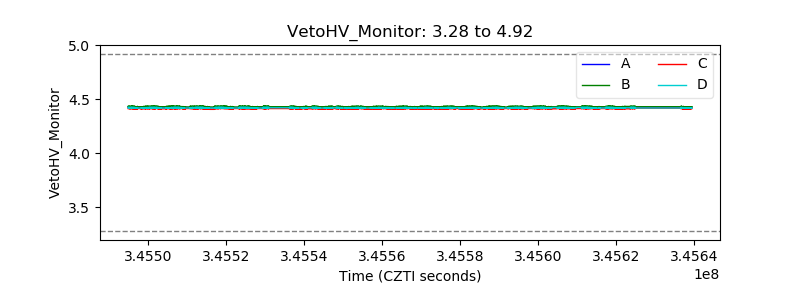 |
| Veto LLD | 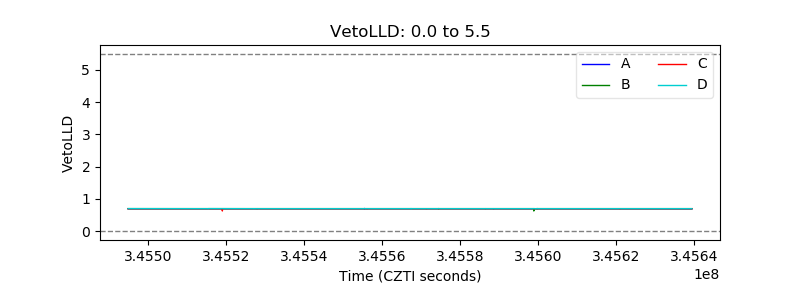 |
| Alpha Counter | 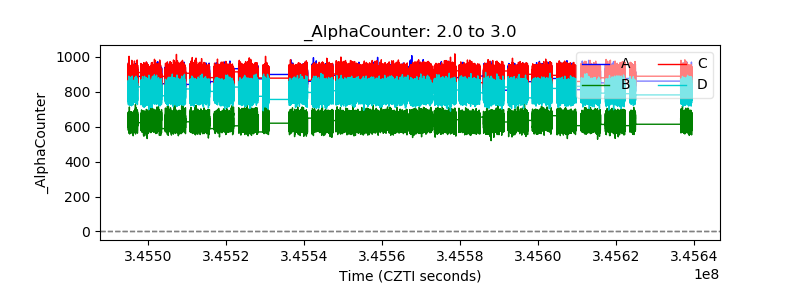 |
| _CPM_Rate |  |
| CZT Counter | 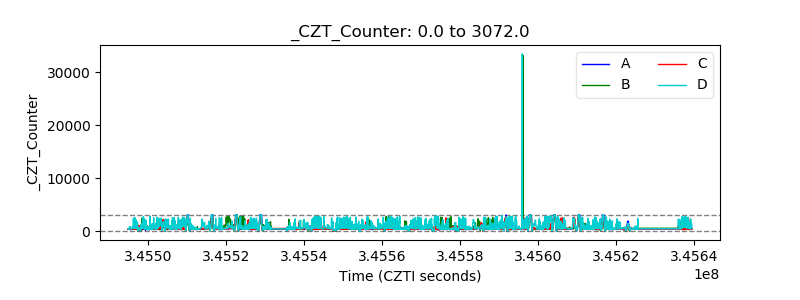 |
| +2.5 Volts monitor | 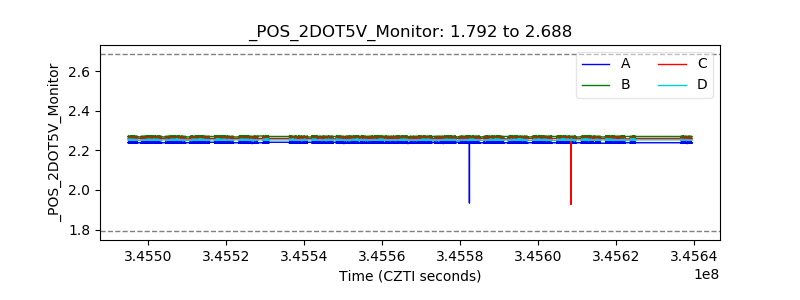 |
| +5 Volts monitor | 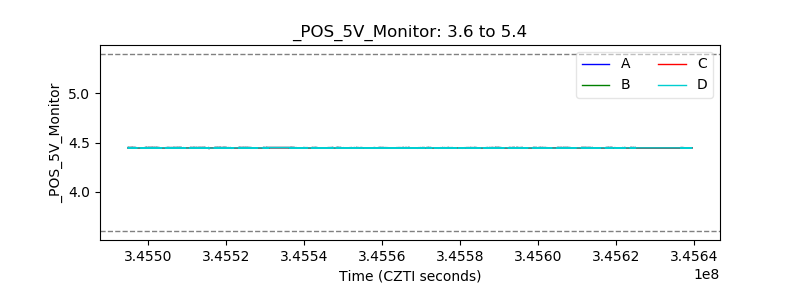 |
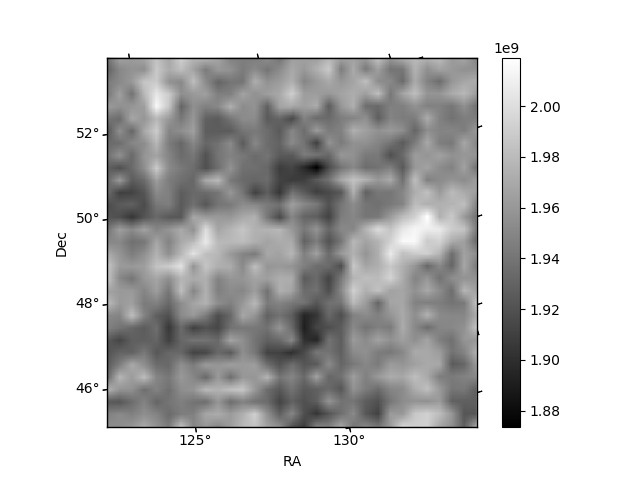
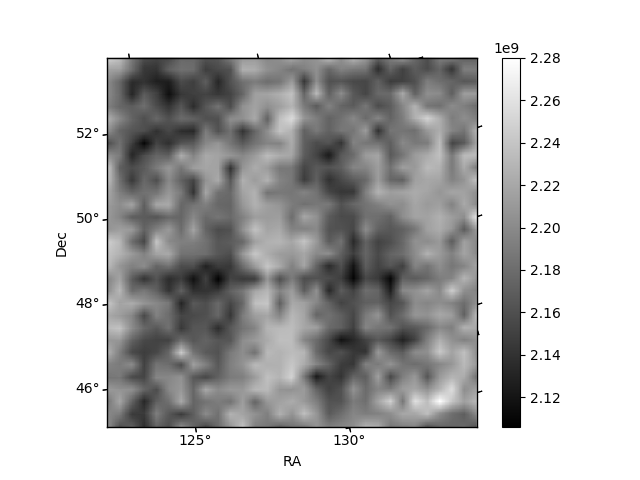
| _ROLL_ROT |  |
| _Roll_DEC | 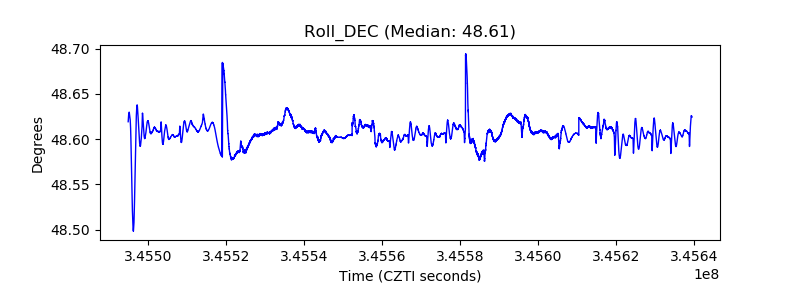 |
| _Roll_RA |  |
| Veto Counter |  |