| Param | Original file | Final file |
|---|---|---|
| Filename | modeM0/AS1A10_073T05_9000004068_28162cztM0_level2.evt | modeM0/AS1A10_073T05_9000004068_28162cztM0_level2_quad_clean.evt |
| Size (bytes) | 317,203,200 | 56,361,600 |
| Size | 302.5 MB | 53.8 MB |
| Events in quadrant A | 1,900,990 | 369,851 |
| Events in quadrant B | 2,062,071 | 368,360 |
| Events in quadrant C | 1,929,704 | 353,038 |
| Events in quadrant D | 3,444,045 | 336,126 |
| Mode M0 | |||
|---|---|---|---|
| Quadrant | BADHDUFLAG | Total packets | Discarded packets |
| A | 0 | 8114 | 0 |
| B | 0 | 8602 | 0 |
| C | 0 | 8222 | 0 |
| D | 0 | 12936 | 0 |
| Mode M9 | |||
|---|---|---|---|
| Quadrant | BADHDUFLAG | Total packets | Discarded packets |
| A | 0 | 8 | 0 |
| B | 0 | 8 | 0 |
| C | 0 | 8 | 0 |
| D | 0 | 8 | 0 |
| Quadrant | Total seconds | Saturated seconds | Saturation percentage |
|---|---|---|---|
| A | 3950 | 21 | 0.531646% |
| B | 3950 | 62 | 1.569620% |
| C | 3950 | 59 | 1.493671% |
| D | 3950 | 320 | 8.101266% |
Noise dominated data is calculated using 1-second bins in cleaned event files. If a bin has >2000 counts, and if more than 50% of those come from <1% of pixels, then it is considered to be noise-dominated and hence unusable.
| Quadrant | # 1 sec bins | Bins with >0 counts | Bins with >2000 counts | High rate bins dominated by noise | Noise dominated (total time) | Noise dominated (detector-on time) | Marked lightcurve |
|---|---|---|---|---|---|---|---|
| A | 4750 | 3950 | 0 | 0 | 0.00% | 0.00% | 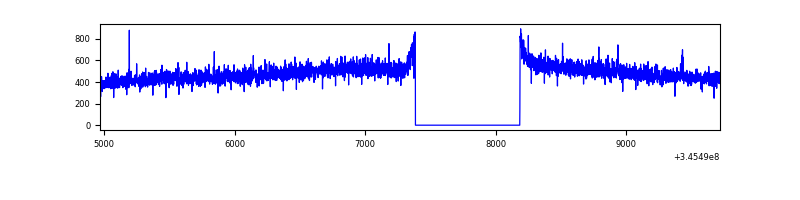 |
| B | 4750 | 3950 | 20 | 20 | 0.42% | 0.51% | 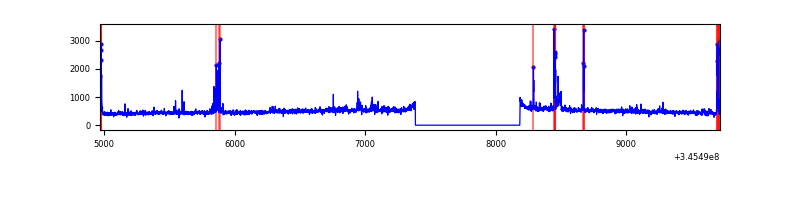 |
| C | 4750 | 3951 | 0 | 0 | 0.00% | 0.00% | 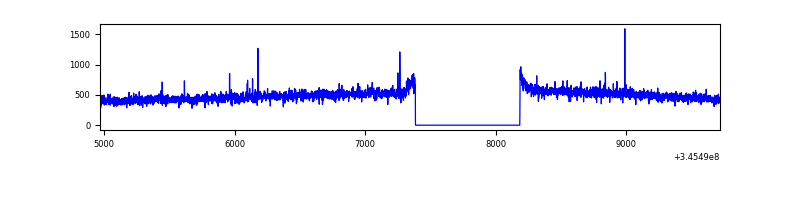 |
| D | 4750 | 3951 | 239 | 239 | 5.03% | 6.05% | 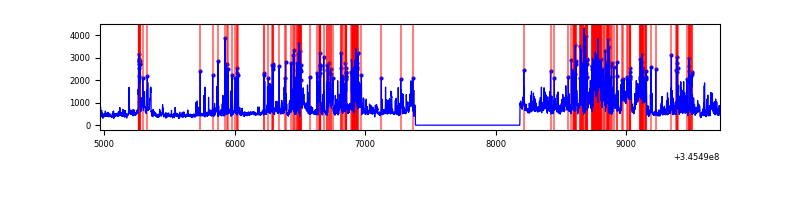 |
Top three noisy pixels from each quadrant. If the there are fewer than three noisy pixels in the level2.evt file, extra rows are filled as -1
| Pixel properties | Quadrant properties | ||||||
|---|---|---|---|---|---|---|---|
| Quadrant | DetID | PixID | Counts | Sigma | Mean | Median | Sigma |
| A | 13 | 254 | 6175 | 56.6 | 491 | 480 | 100.6 |
| A | 3 | 137 | 4816 | 43.09 | 491 | 480 | 100.6 |
| A | 0 | 226 | 4239 | 37.36 | 491 | 480 | 100.6 |
| B | 10 | 246 | 74895 | 797.05 | 483 | 470 | 93.4 |
| B | 10 | 245 | 67055 | 713.09 | 483 | 470 | 93.4 |
| B | 12 | 111 | 11744 | 120.74 | 483 | 470 | 93.4 |
| C | 14 | 238 | 75551 | 683.04 | 465 | 467 | 109.9 |
| C | 3 | 233 | 33367 | 299.29 | 465 | 467 | 109.9 |
| C | 2 | 16 | 4748 | 38.94 | 465 | 467 | 109.9 |
| D | 1 | 52 | 890340 | 8083.15 | 458 | 444 | 110.1 |
| D | 7 | 80 | 330697 | 2999.77 | 458 | 444 | 110.1 |
| D | 8 | 195 | 162724 | 1474.03 | 458 | 444 | 110.1 |
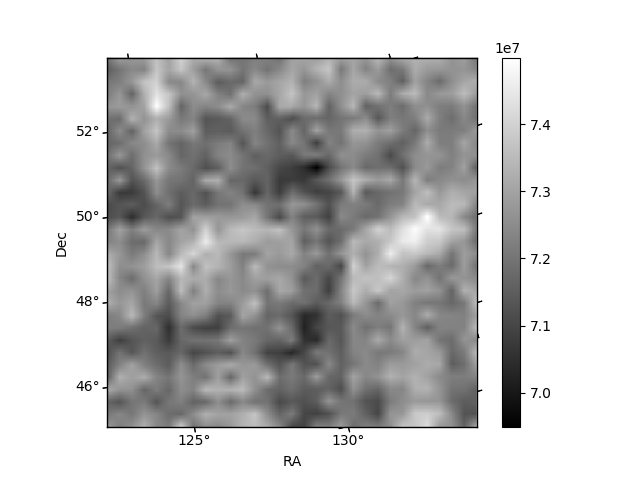
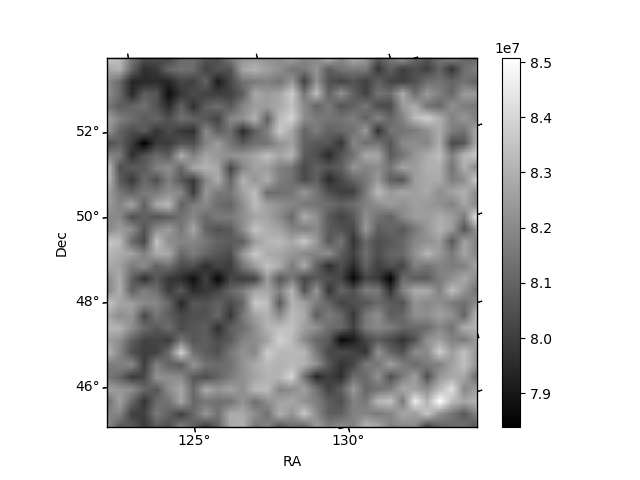
Histogram calculated using DETX and DETY for each event in the final _common_clean file
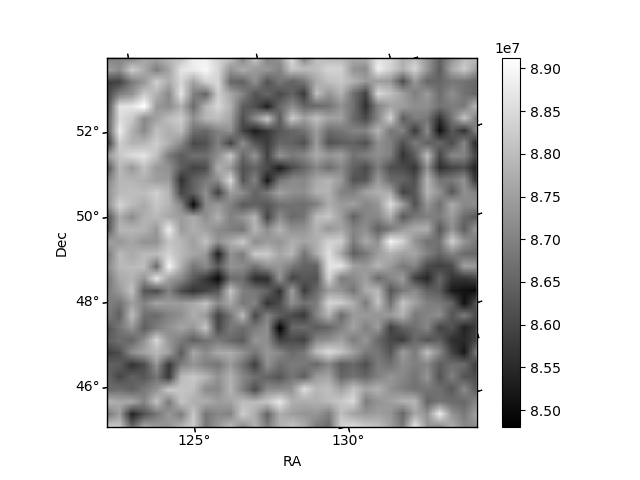
| Quadrant A |  |
 |
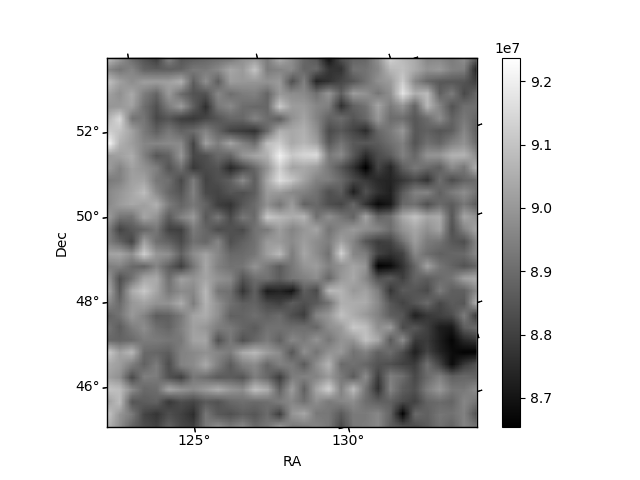
Quadrant B |
|---|---|---|---|
| Quadrant D | 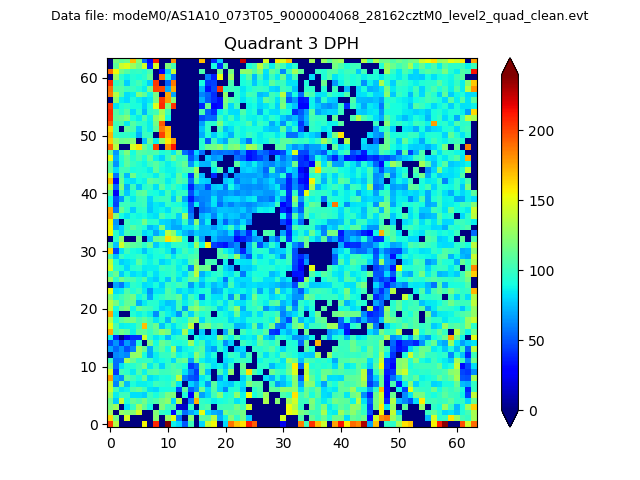 |
 |
Quadrant C |
| Plot type | Count rate plots | Images |
|---|---|---|
| Comparison with Poisson distribution Blue bars denote a histogram of data divided into 1 sec bins. Red curve is a Poisson curve with rate = median count rate of data. |
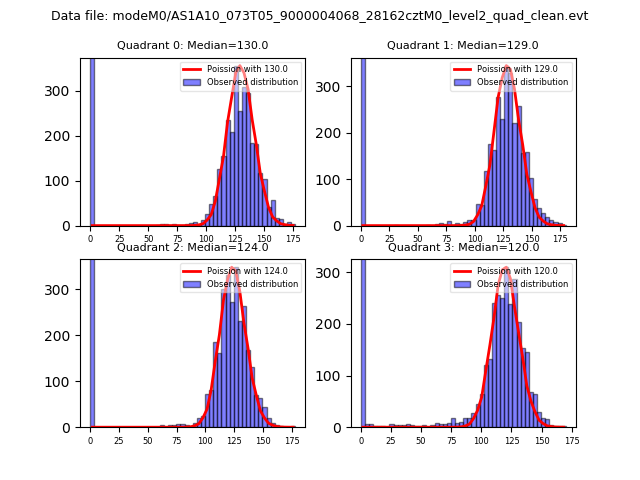 |
 |
| Quadrant-wise count rates Data is divided into 100 sec bins |
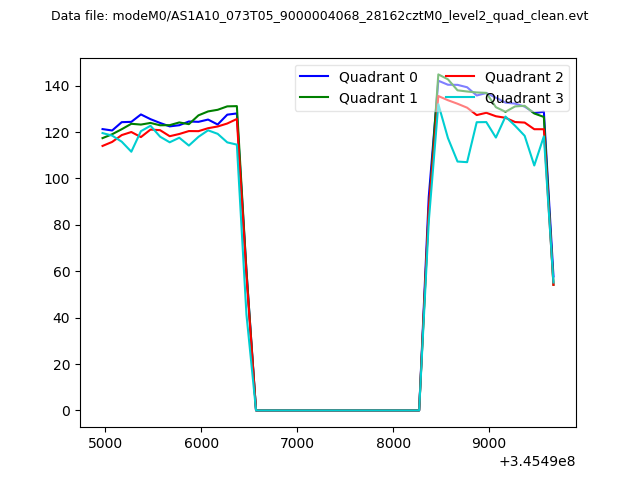 |
|
| Module-wise count rates for Quadrant A Data is divided into 100 sec bins |
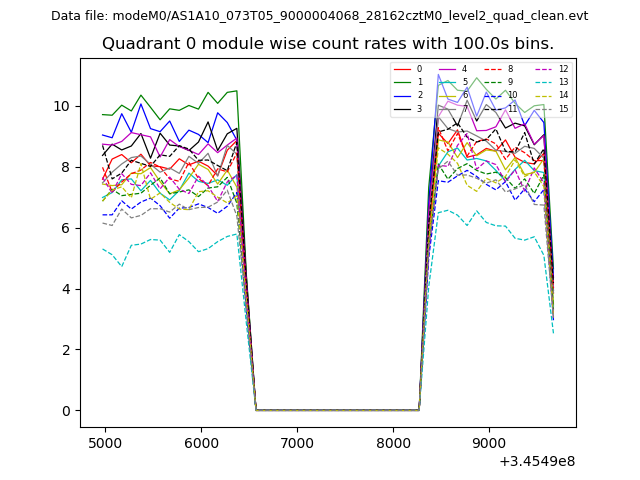 |
 |
| Module-wise count rates for Quadrant B Data is divided into 100 sec bins |
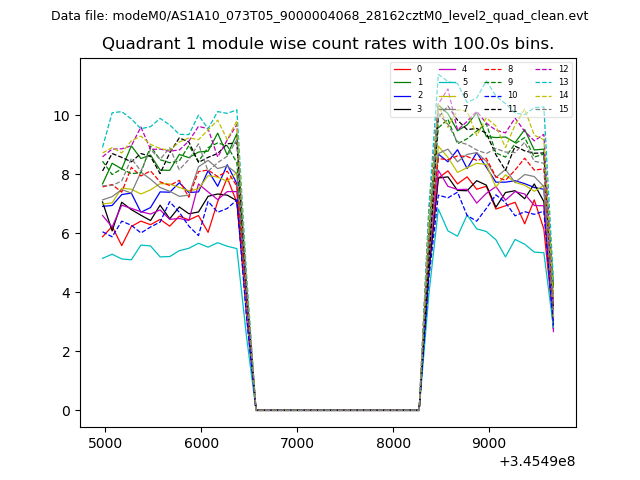 |
 |
| Module-wise count rates for Quadrant C Data is divided into 100 sec bins |
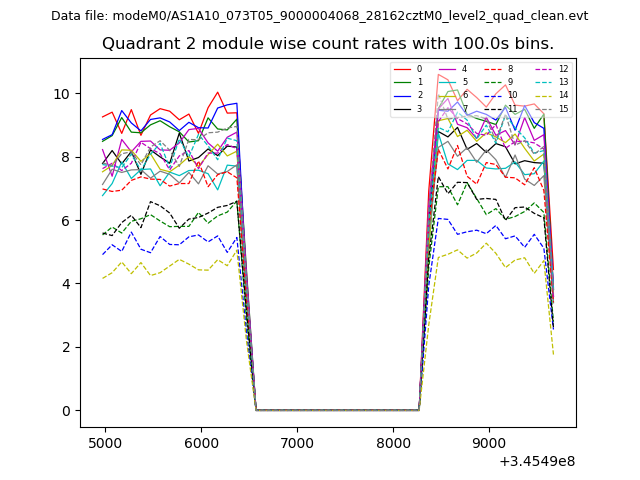 |
 |
| Module-wise count rates for Quadrant D Data is divided into 100 sec bins |
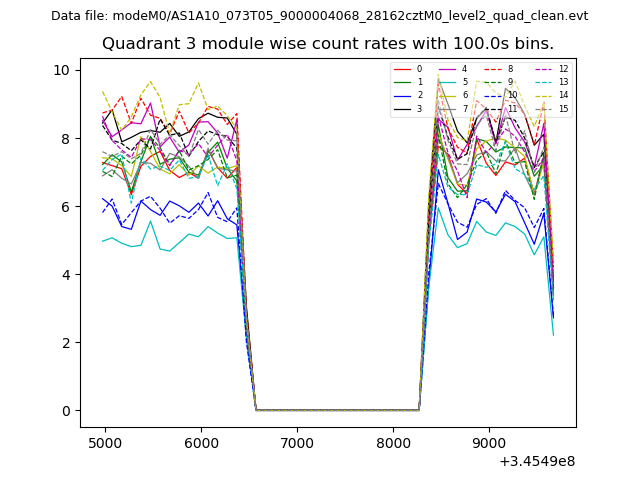 |
 |
| Parameter | Plot |
|---|---|
| CZT HV Monitor | 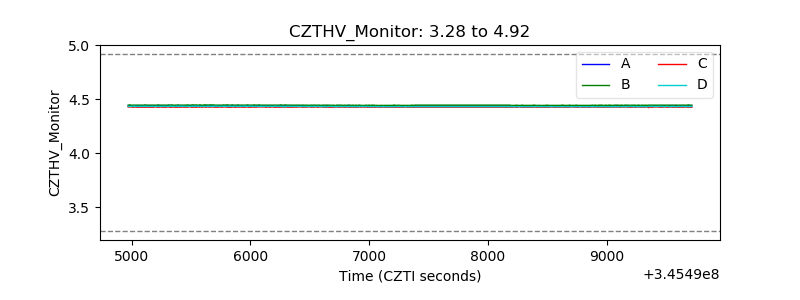 |
| D_VDD | 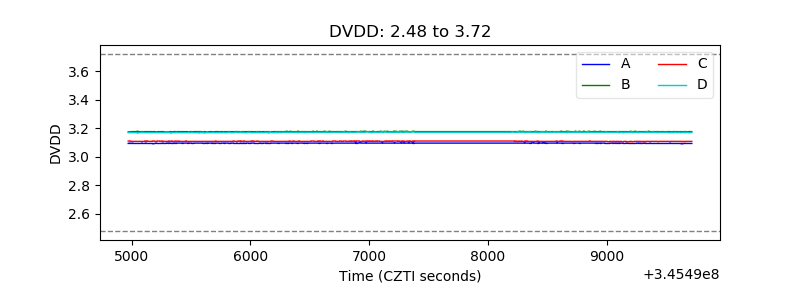 |
| Temperature 1 | 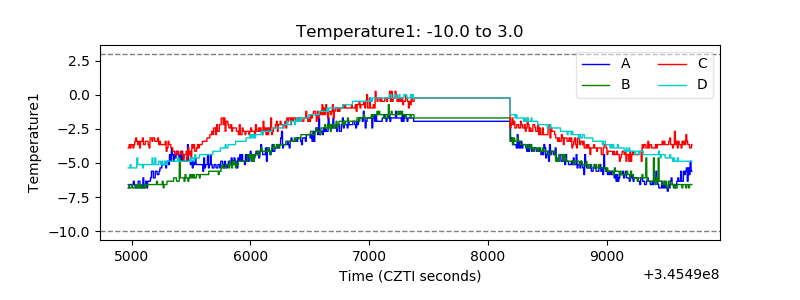 |
| Veto HV Monitor | 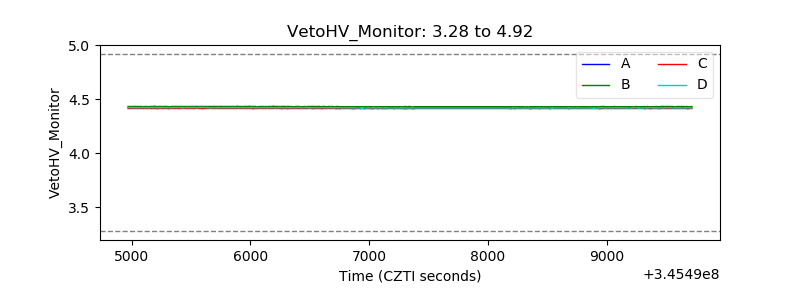 |
| Veto LLD |  |
| Alpha Counter | 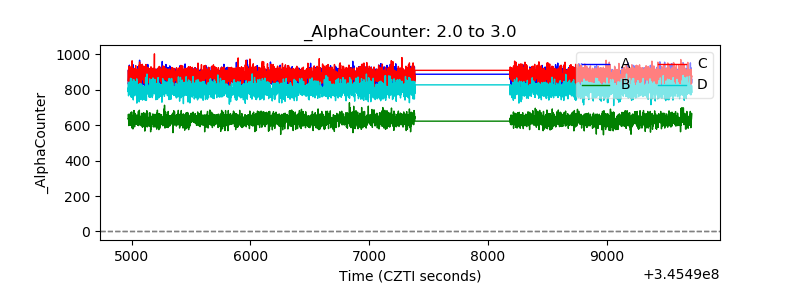 |
| _CPM_Rate | 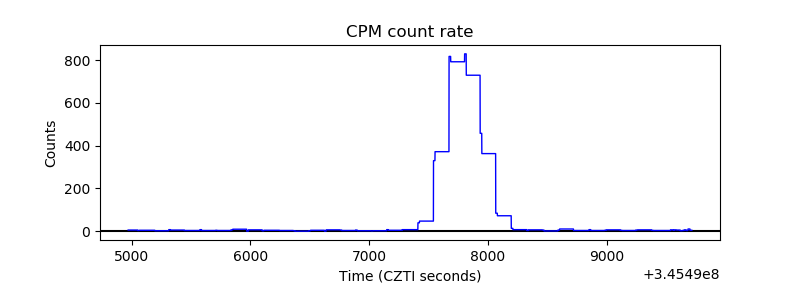 |
| CZT Counter | 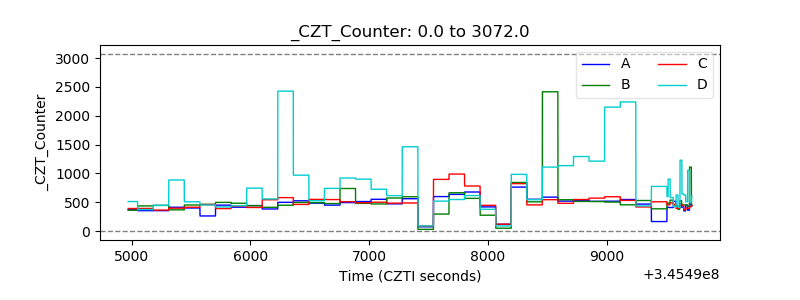 |
| +2.5 Volts monitor | 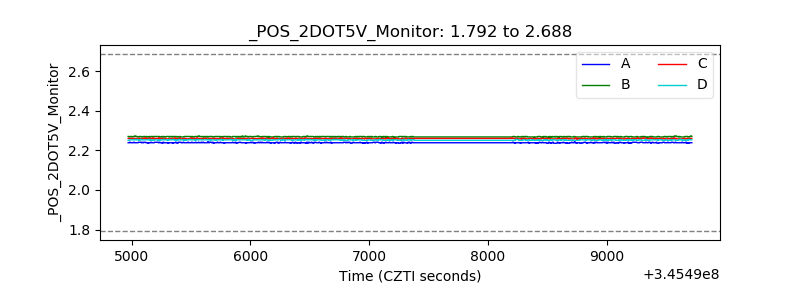 |
| +5 Volts monitor |  |
| _ROLL_ROT | 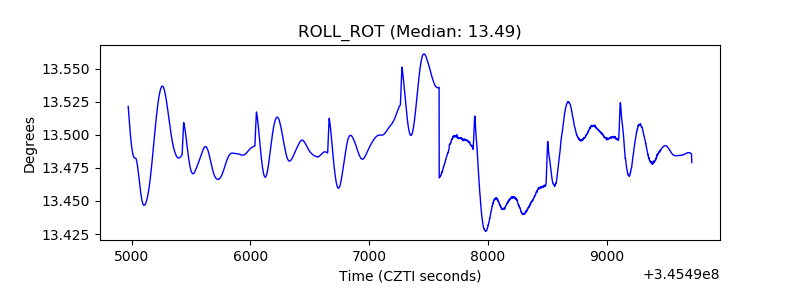 |
| _Roll_DEC | 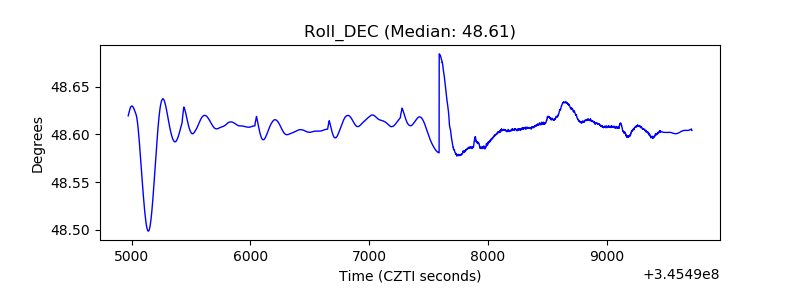 |
| _Roll_RA | 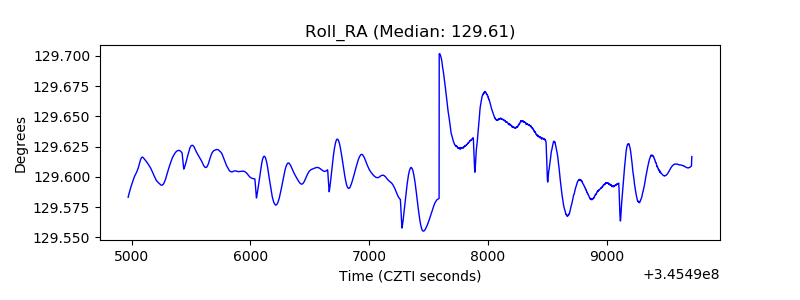 |
| Veto Counter | 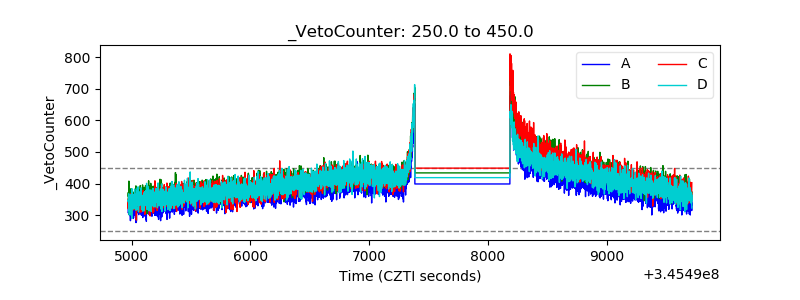 |