| Param | Original file | Final file |
|---|---|---|
| Filename | modeM0/AS1A10_073T05_9000004068_28163cztM0_level2.evt | modeM0/AS1A10_073T05_9000004068_28163cztM0_level2_quad_clean.evt |
| Size (bytes) | 576,155,520 | 104,541,120 |
| Size | 549.5 MB | 99.7 MB |
| Events in quadrant A | 3,269,061 | 693,950 |
| Events in quadrant B | 3,454,957 | 693,087 |
| Events in quadrant C | 3,408,180 | 664,946 |
| Events in quadrant D | 6,846,074 | 630,333 |
| Mode M0 | |||
|---|---|---|---|
| Quadrant | BADHDUFLAG | Total packets | Discarded packets |
| A | 0 | 14327 | 0 |
| B | 0 | 14941 | 0 |
| C | 0 | 14793 | 0 |
| D | 0 | 25178 | 0 |
| Mode M9 | |||
|---|---|---|---|
| Quadrant | BADHDUFLAG | Total packets | Discarded packets |
| A | 0 | 18 | 0 |
| B | 0 | 18 | 0 |
| C | 0 | 18 | 0 |
| D | 0 | 18 | 0 |
| Quadrant | Total seconds | Saturated seconds | Saturation percentage |
|---|---|---|---|
| A | 6944 | 41 | 0.590438% |
| B | 6945 | 90 | 1.295896% |
| C | 6945 | 123 | 1.771058% |
| D | 6945 | 858 | 12.354212% |
Noise dominated data is calculated using 1-second bins in cleaned event files. If a bin has >2000 counts, and if more than 50% of those come from <1% of pixels, then it is considered to be noise-dominated and hence unusable.
| Quadrant | # 1 sec bins | Bins with >0 counts | Bins with >2000 counts | High rate bins dominated by noise | Noise dominated (total time) | Noise dominated (detector-on time) | Marked lightcurve |
|---|---|---|---|---|---|---|---|
| A | 8719 | 6945 | 0 | 0 | 0.00% | 0.00% | 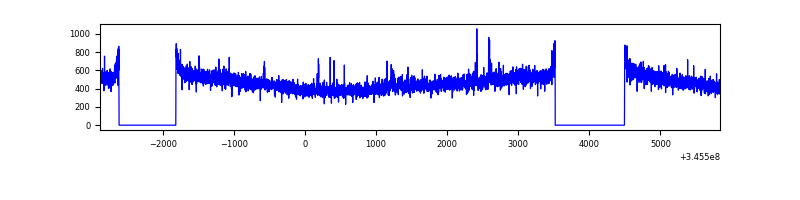 |
| B | 8720 | 6946 | 17 | 17 | 0.19% | 0.24% | 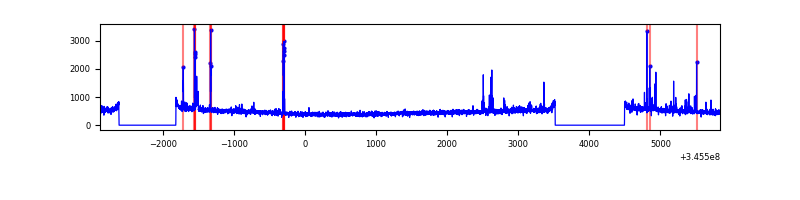 |
| C | 8720 | 6946 | 13 | 13 | 0.15% | 0.19% | 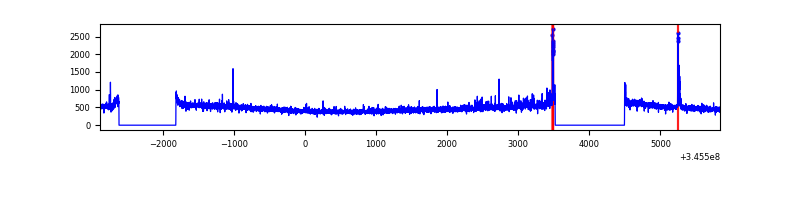 |
| D | 8720 | 6947 | 657 | 657 | 7.53% | 9.46% | 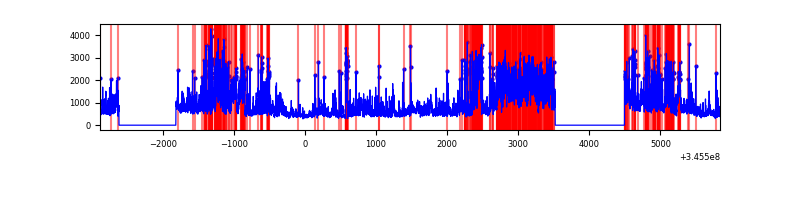 |
Top three noisy pixels from each quadrant. If the there are fewer than three noisy pixels in the level2.evt file, extra rows are filled as -1
| Pixel properties | Quadrant properties | ||||||
|---|---|---|---|---|---|---|---|
| Quadrant | DetID | PixID | Counts | Sigma | Mean | Median | Sigma |
| A | 12 | 16 | 19478 | 110.92 | 840 | 822 | 168.2 |
| A | 13 | 254 | 11720 | 64.79 | 840 | 822 | 168.2 |
| A | 12 | 194 | 8899 | 48.02 | 840 | 822 | 168.2 |
| B | 10 | 245 | 106068 | 664.24 | 832 | 811 | 158.5 |
| B | 10 | 246 | 53008 | 329.4 | 832 | 811 | 158.5 |
| B | 12 | 111 | 19812 | 119.91 | 832 | 811 | 158.5 |
| C | 14 | 238 | 128305 | 678.72 | 805 | 808 | 187.8 |
| C | 3 | 233 | 96674 | 510.34 | 805 | 808 | 187.8 |
| C | 2 | 16 | 46345 | 242.41 | 805 | 808 | 187.8 |
| D | 7 | 80 | 1658714 | 8974.25 | 778 | 756 | 184.7 |
| D | 1 | 52 | 1464812 | 7924.69 | 778 | 756 | 184.7 |
| D | 2 | 250 | 331930 | 1792.59 | 778 | 756 | 184.7 |
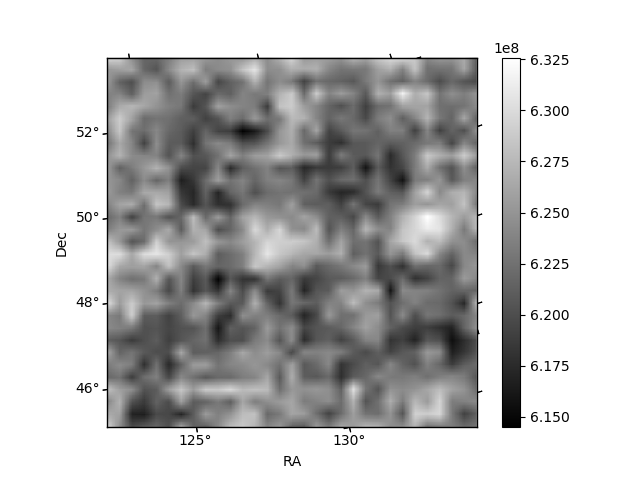
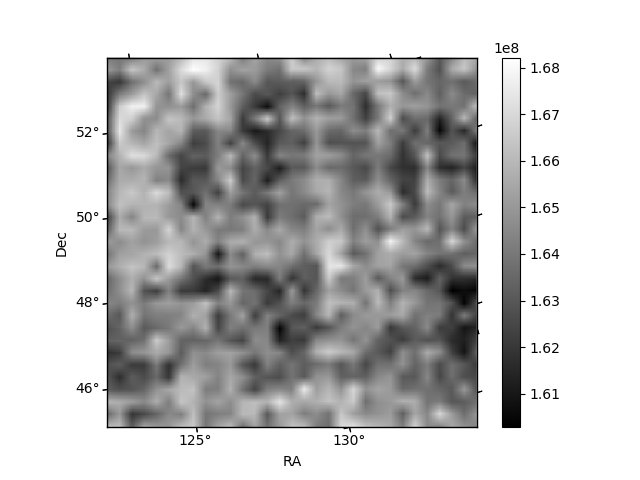
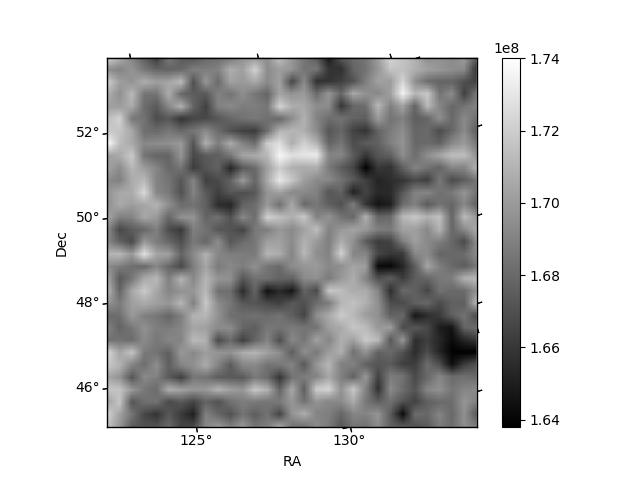
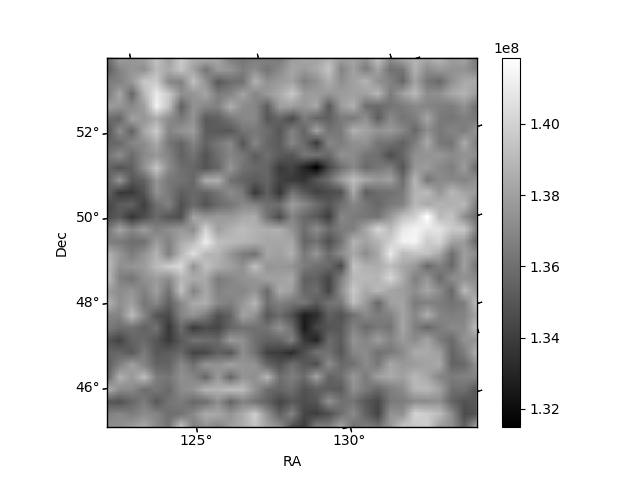
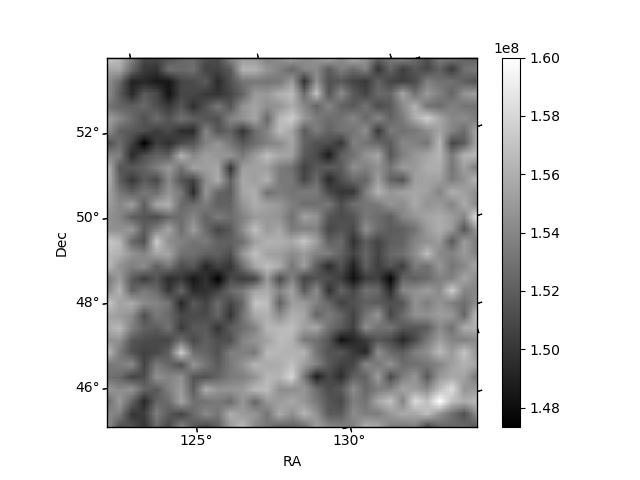
Histogram calculated using DETX and DETY for each event in the final _common_clean file
| Quadrant A | 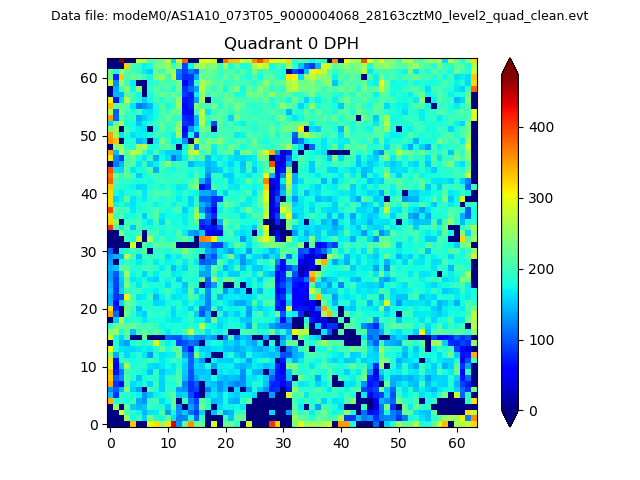 |
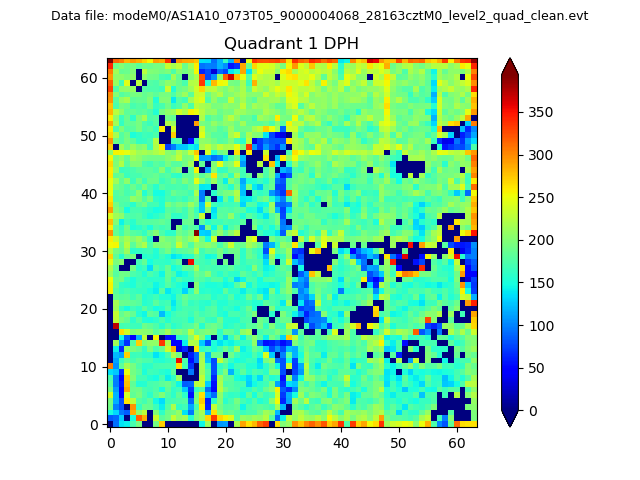 |
Quadrant B |
|---|---|---|---|
| Quadrant D |  |
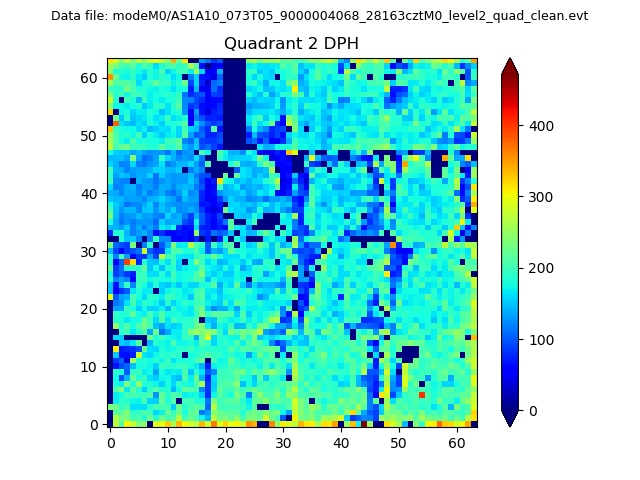 |
Quadrant C |
| Plot type | Count rate plots | Images |
|---|---|---|
| Comparison with Poisson distribution Blue bars denote a histogram of data divided into 1 sec bins. Red curve is a Poisson curve with rate = median count rate of data. |
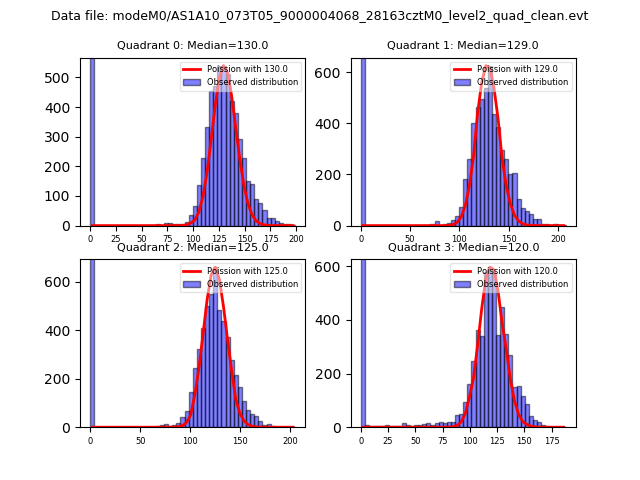 |
 |
| Quadrant-wise count rates Data is divided into 100 sec bins |
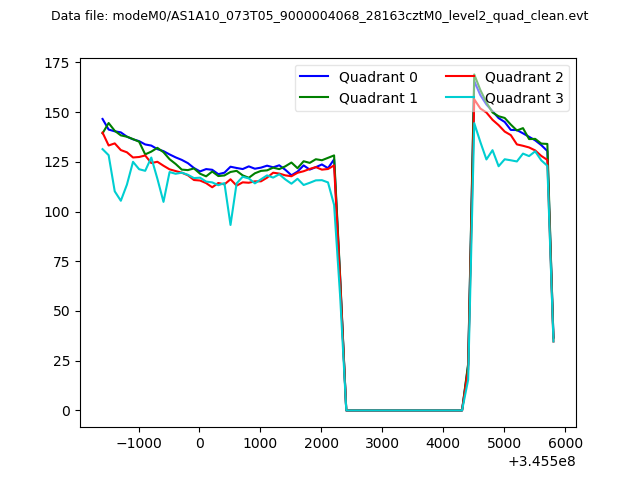 |
|
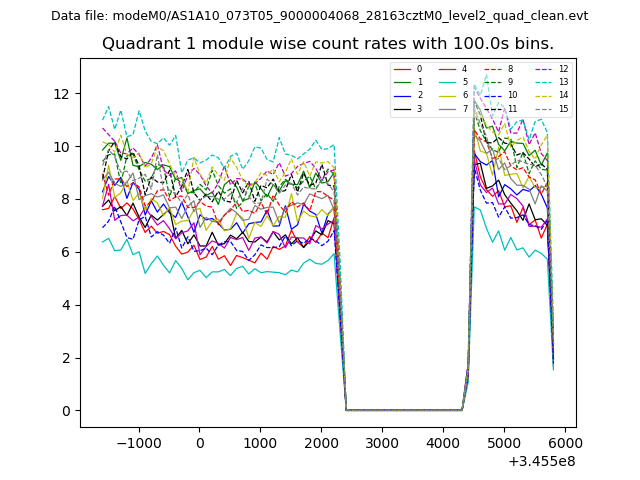
| Module-wise count rates for Quadrant A Data is divided into 100 sec bins |
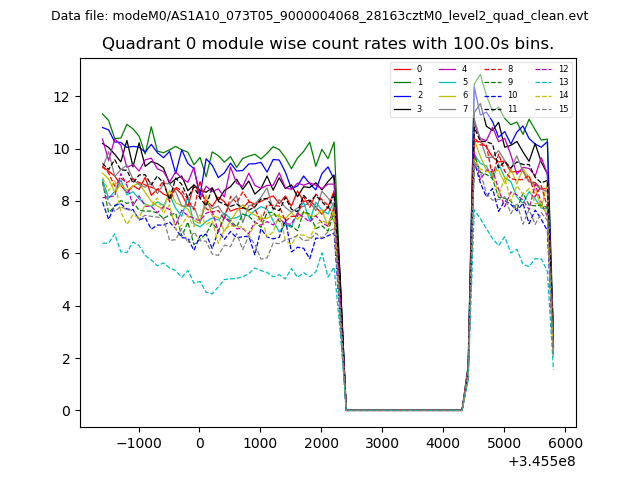 |
 |
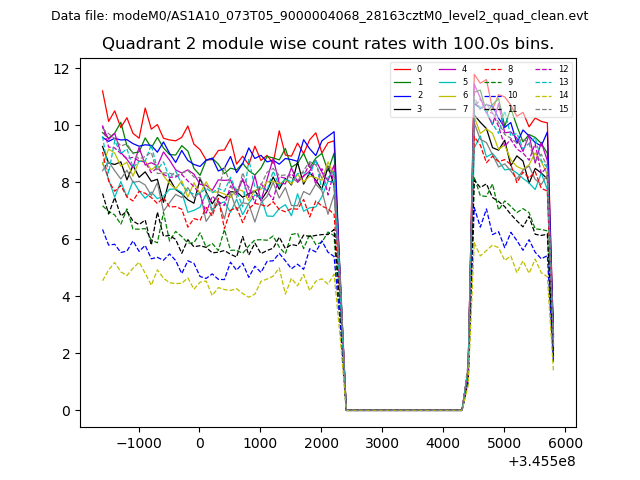
| Module-wise count rates for Quadrant B Data is divided into 100 sec bins |
 |
 |
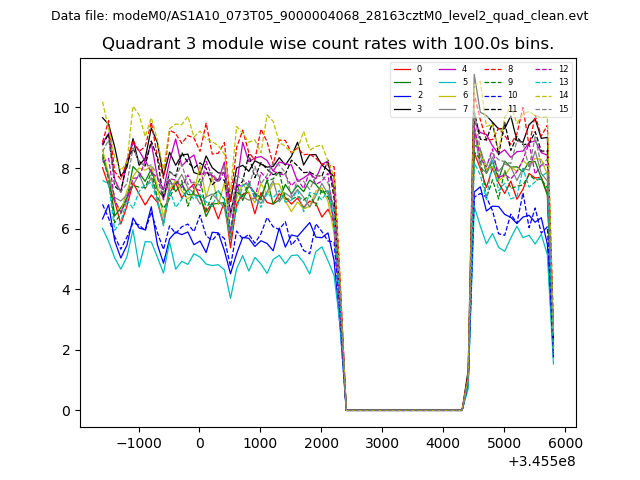
| Module-wise count rates for Quadrant C Data is divided into 100 sec bins |
 |
 |
| Module-wise count rates for Quadrant D Data is divided into 100 sec bins |
 |
 |
| Parameter | Plot |
|---|---|
| CZT HV Monitor | 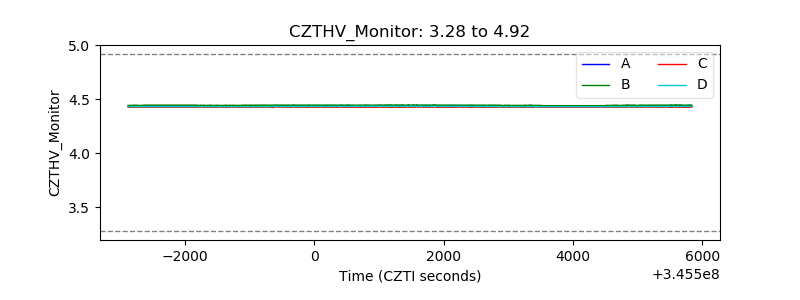 |
| D_VDD | 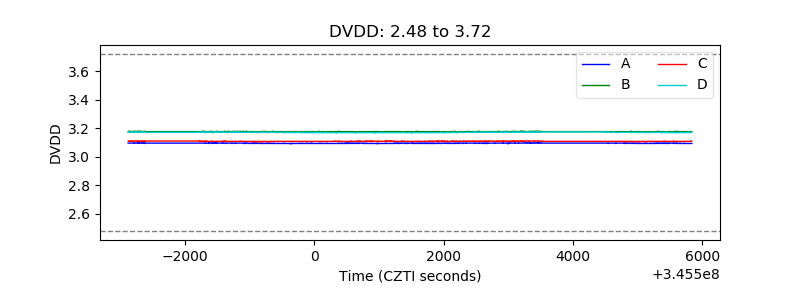 |
| Temperature 1 | 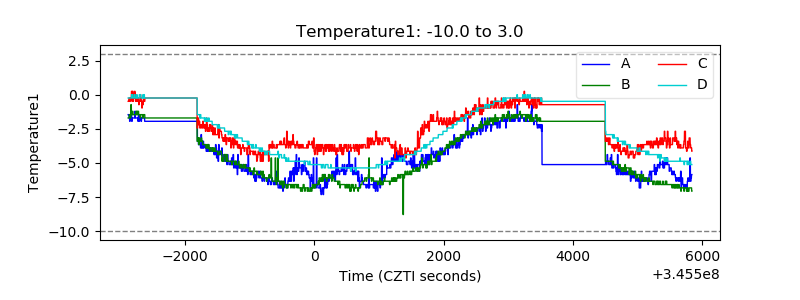 |
| Veto HV Monitor | 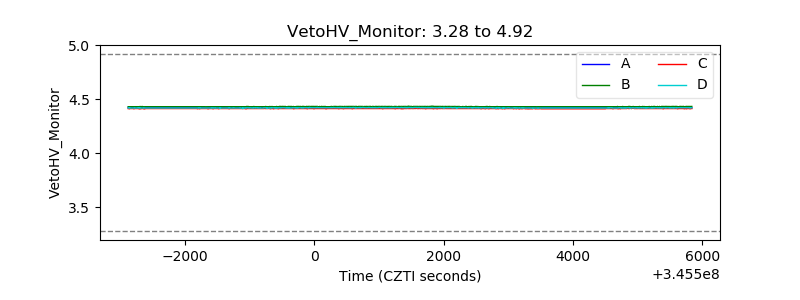 |
| Veto LLD | 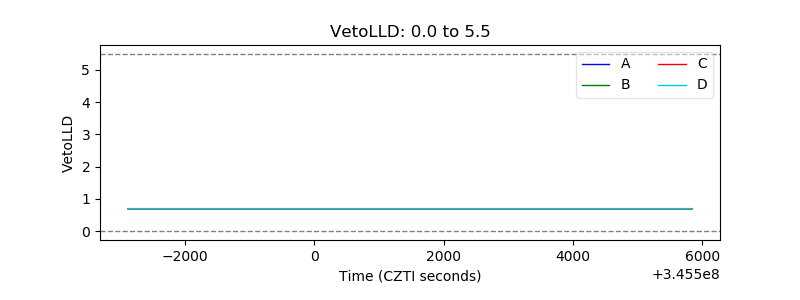 |
| Alpha Counter | 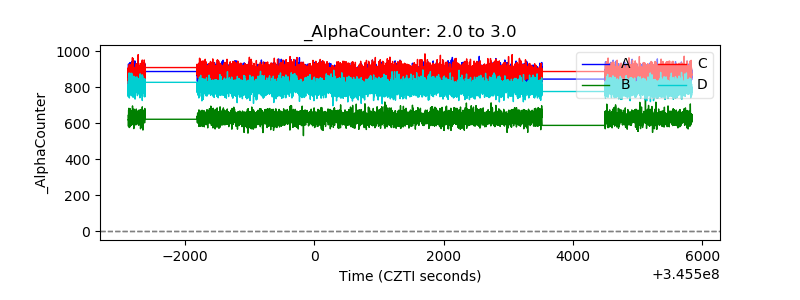 |
| _CPM_Rate | 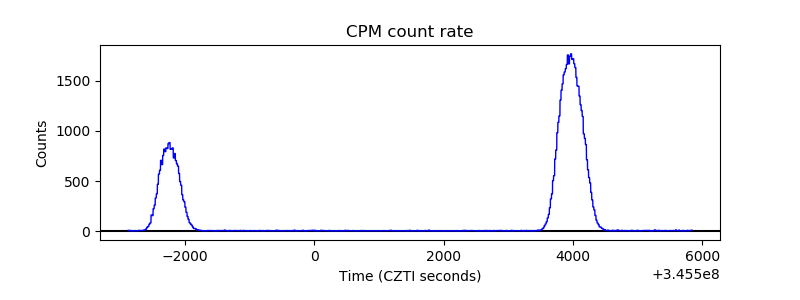 |
| CZT Counter | 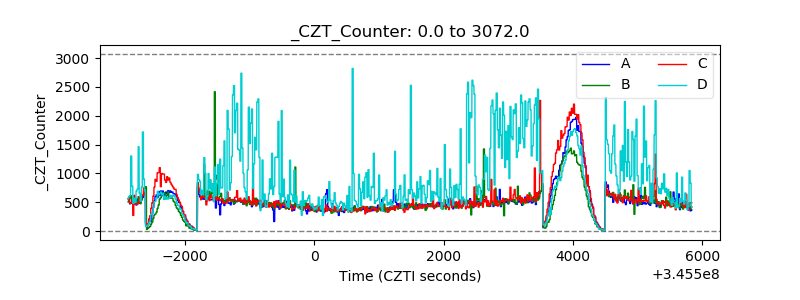 |
| +2.5 Volts monitor | 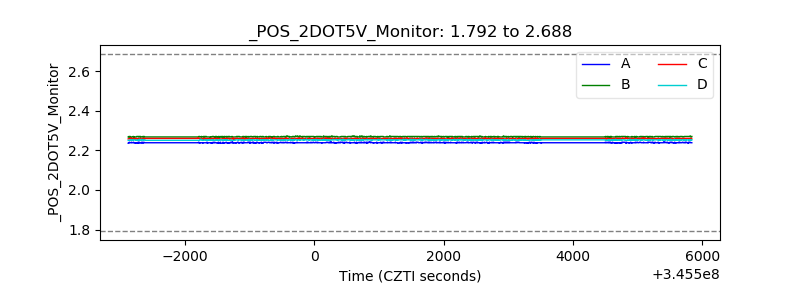 |
| +5 Volts monitor |  |
| _ROLL_ROT | 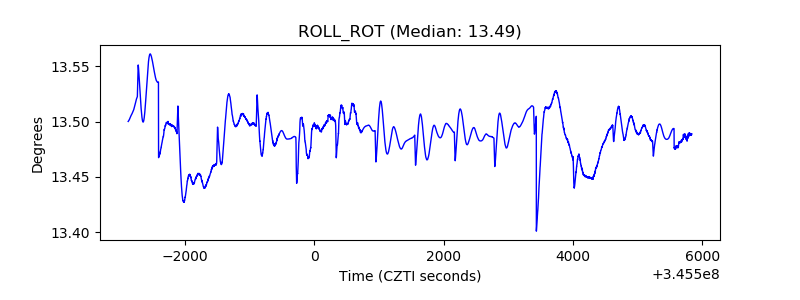 |
| _Roll_DEC | 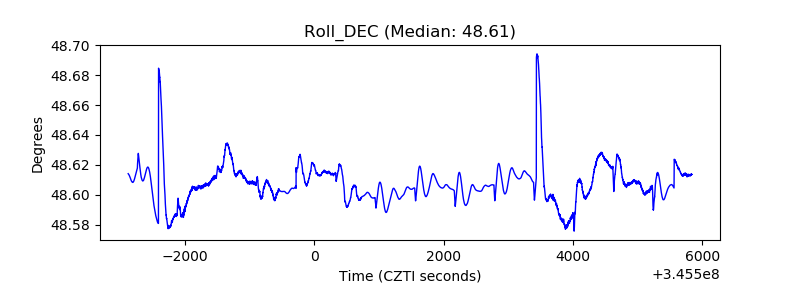 |
| _Roll_RA | 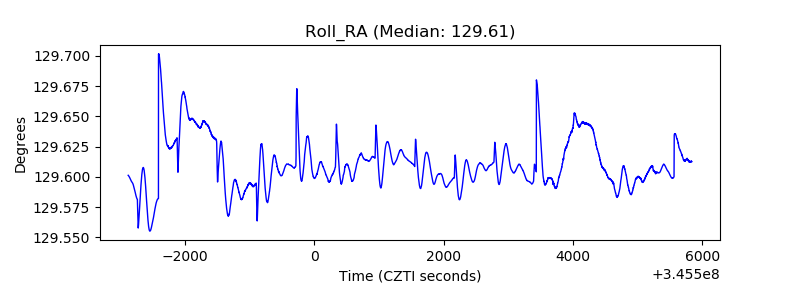 |
| Veto Counter | 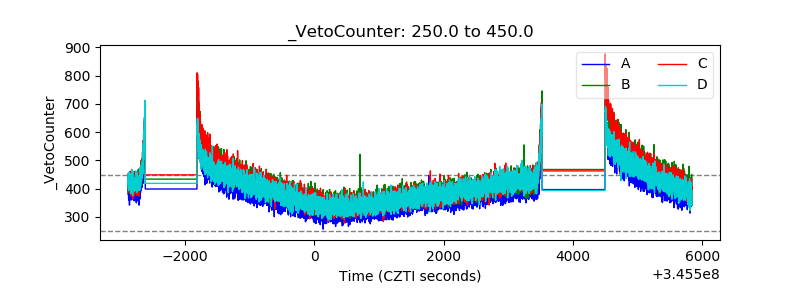 |