| Param | Original file | Final file |
|---|---|---|
| Filename | modeM0/AS1A10_073T05_9000004068_28165cztM0_level2.evt | modeM0/AS1A10_073T05_9000004068_28165cztM0_level2_quad_clean.evt |
| Size (bytes) | 553,129,920 | 107,634,240 |
| Size | 527.5 MB | 102.6 MB |
| Events in quadrant A | 3,125,259 | 720,216 |
| Events in quadrant B | 3,278,884 | 727,339 |
| Events in quadrant C | 3,288,024 | 690,646 |
| Events in quadrant D | 6,605,536 | 654,745 |
| Mode M0 | |||
|---|---|---|---|
| Quadrant | BADHDUFLAG | Total packets | Discarded packets |
| A | 0 | 13800 | 0 |
| B | 0 | 14209 | 0 |
| C | 0 | 14214 | 0 |
| D | 0 | 24325 | 0 |
| Mode M9 | |||
|---|---|---|---|
| Quadrant | BADHDUFLAG | Total packets | Discarded packets |
| A | 0 | 16 | 0 |
| B | 0 | 17 | 0 |
| C | 0 | 17 | 0 |
| D | 0 | 17 | 0 |
| Quadrant | Total seconds | Saturated seconds | Saturation percentage |
|---|---|---|---|
| A | 6695 | 26 | 0.388350% |
| B | 6695 | 44 | 0.657207% |
| C | 6695 | 92 | 1.374160% |
| D | 6694 | 666 | 9.949208% |
Noise dominated data is calculated using 1-second bins in cleaned event files. If a bin has >2000 counts, and if more than 50% of those come from <1% of pixels, then it is considered to be noise-dominated and hence unusable.
| Quadrant | # 1 sec bins | Bins with >0 counts | Bins with >2000 counts | High rate bins dominated by noise | Noise dominated (total time) | Noise dominated (detector-on time) | Marked lightcurve |
|---|---|---|---|---|---|---|---|
| A | 7795 | 6696 | 0 | 0 | 0.00% | 0.00% | 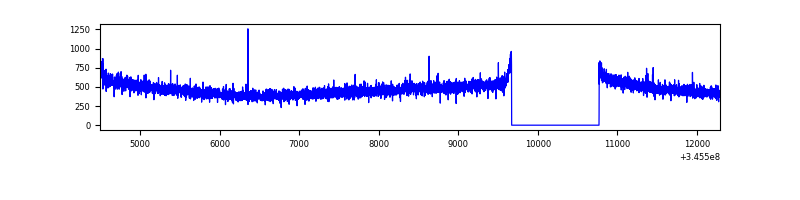 |
| B | 7795 | 6695 | 4 | 4 | 0.05% | 0.06% | 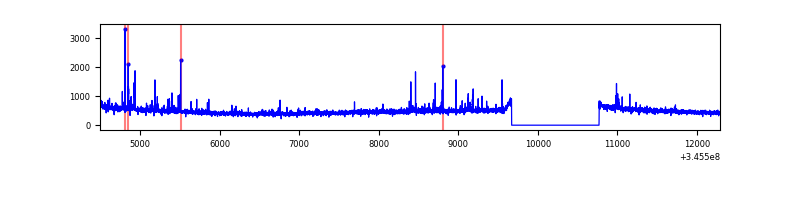 |
| C | 7795 | 6695 | 13 | 13 | 0.17% | 0.19% | 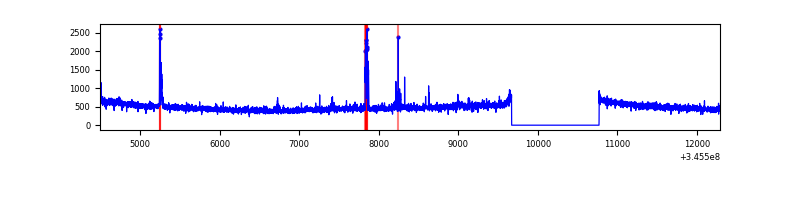 |
| D | 7794 | 6694 | 565 | 565 | 7.25% | 8.44% | 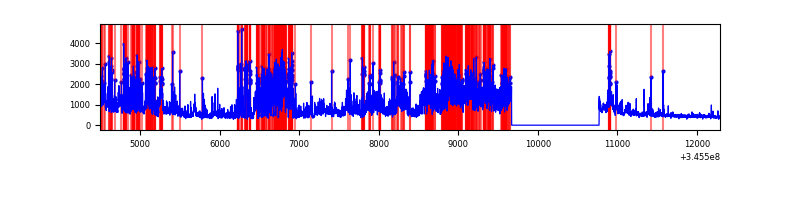 |
Top three noisy pixels from each quadrant. If the there are fewer than three noisy pixels in the level2.evt file, extra rows are filled as -1
| Pixel properties | Quadrant properties | ||||||
|---|---|---|---|---|---|---|---|
| Quadrant | DetID | PixID | Counts | Sigma | Mean | Median | Sigma |
| A | 13 | 254 | 11207 | 64.41 | 809 | 793 | 161.7 |
| A | 3 | 137 | 7721 | 42.85 | 809 | 793 | 161.7 |
| A | 0 | 226 | 6818 | 37.27 | 809 | 793 | 161.7 |
| B | 10 | 246 | 44914 | 290.35 | 808 | 788 | 152.0 |
| B | 10 | 245 | 38069 | 245.31 | 808 | 788 | 152.0 |
| B | 12 | 111 | 18557 | 116.92 | 808 | 788 | 152.0 |
| C | 14 | 238 | 127712 | 698.88 | 777 | 781 | 181.6 |
| C | 3 | 233 | 89377 | 487.81 | 777 | 781 | 181.6 |
| C | 2 | 16 | 42020 | 227.06 | 777 | 781 | 181.6 |
| D | 1 | 52 | 1180274 | 6523.89 | 753 | 733 | 180.8 |
| D | 7 | 80 | 1171943 | 6477.81 | 753 | 733 | 180.8 |
| D | 13 | 104 | 645480 | 3566.01 | 753 | 733 | 180.8 |
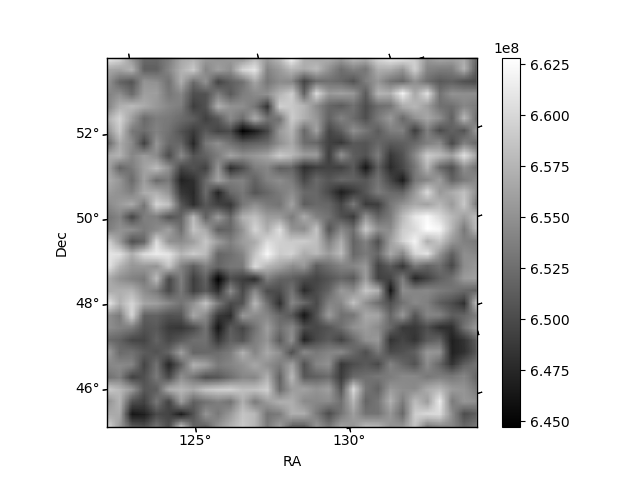
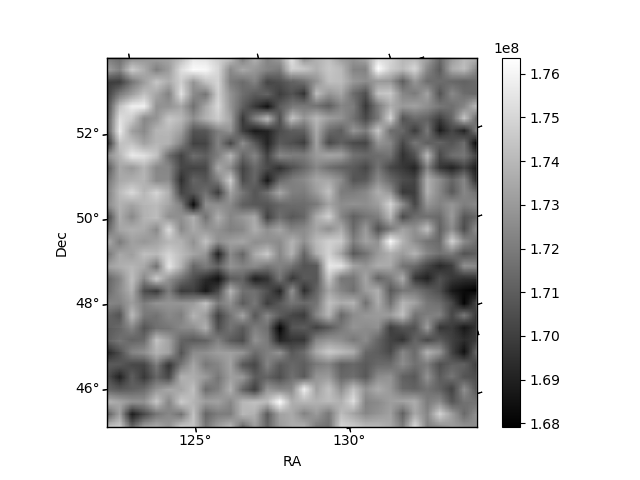
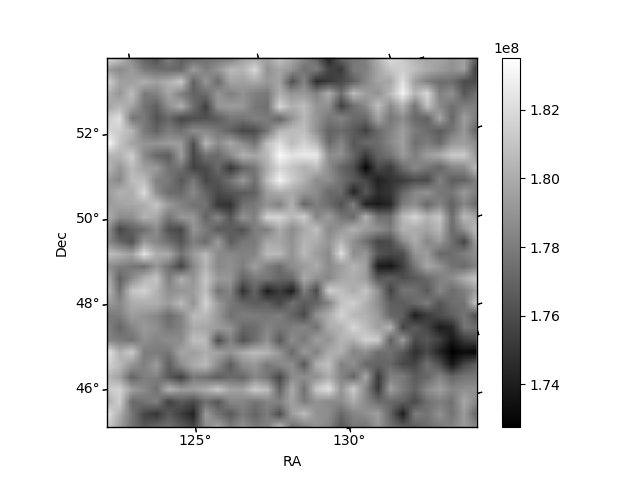
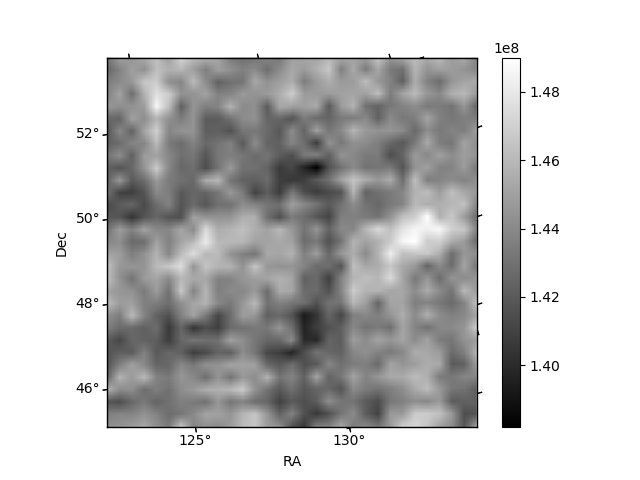
Histogram calculated using DETX and DETY for each event in the final _common_clean file
| Quadrant A | 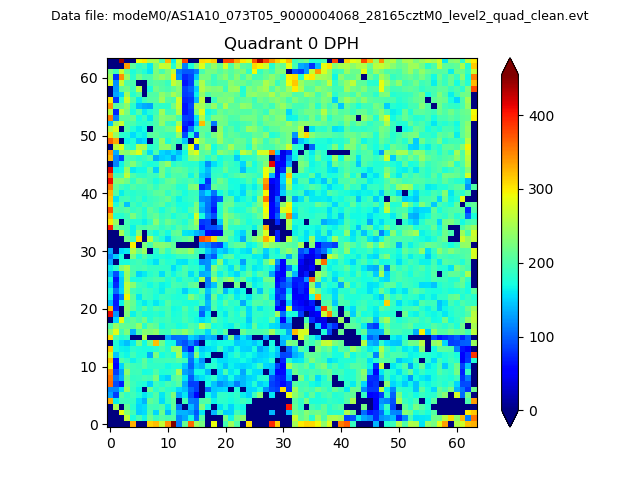 |
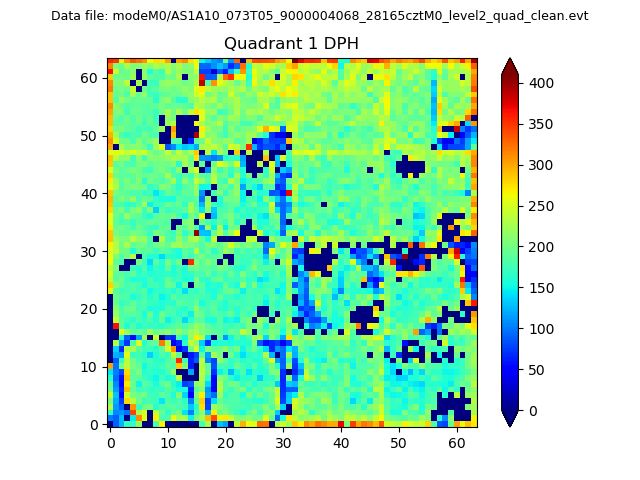 |
Quadrant B |
|---|---|---|---|
| Quadrant D | 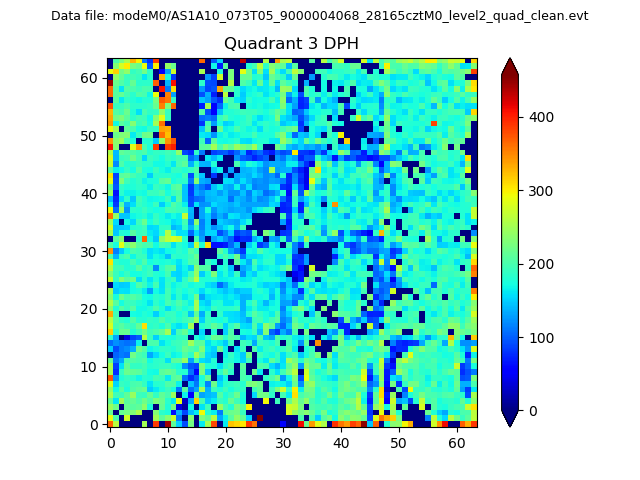 |
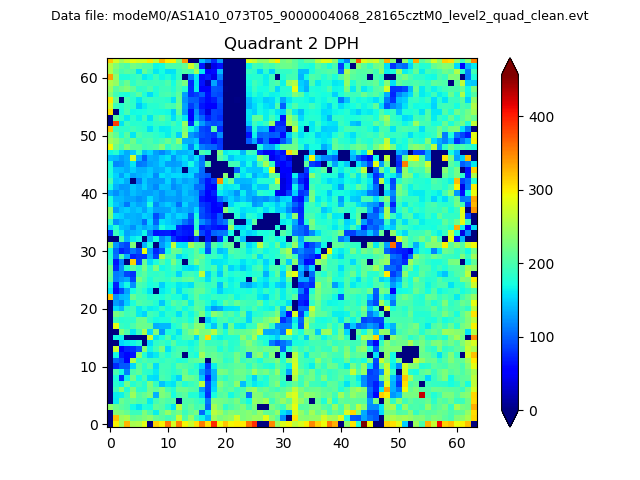 |
Quadrant C |
| Plot type | Count rate plots | Images |
|---|---|---|
| Comparison with Poisson distribution Blue bars denote a histogram of data divided into 1 sec bins. Red curve is a Poisson curve with rate = median count rate of data. |
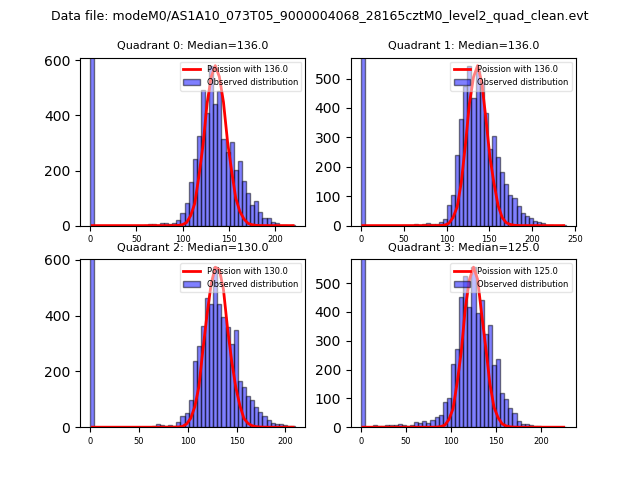 |
 |
| Quadrant-wise count rates Data is divided into 100 sec bins |
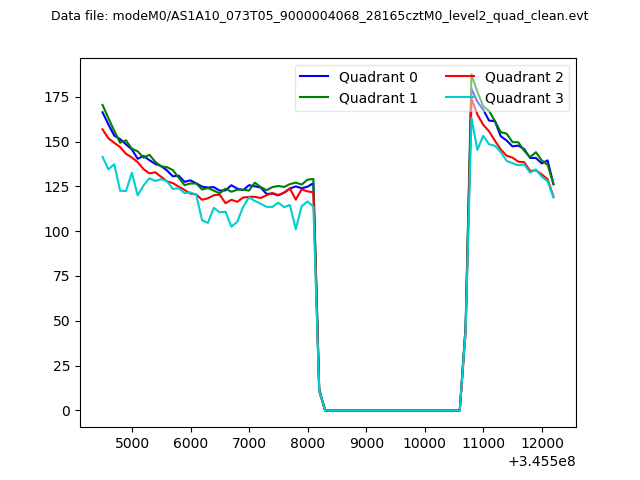 |
|
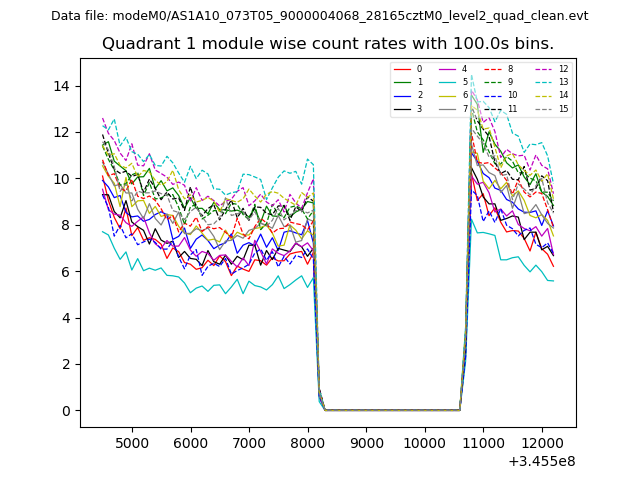
| Module-wise count rates for Quadrant A Data is divided into 100 sec bins |
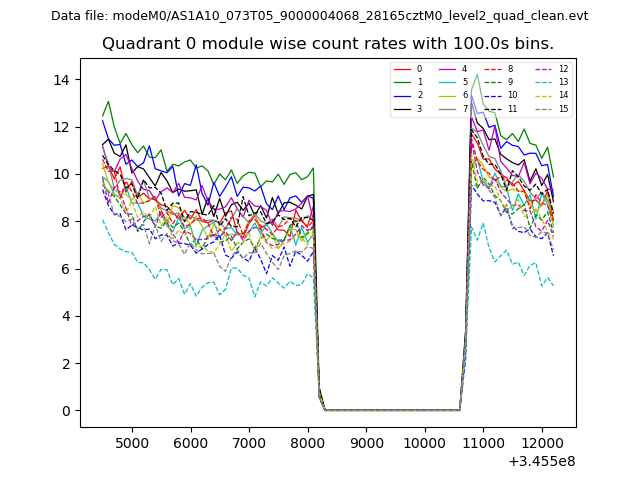 |
 |
| Module-wise count rates for Quadrant B Data is divided into 100 sec bins |
 |
 |
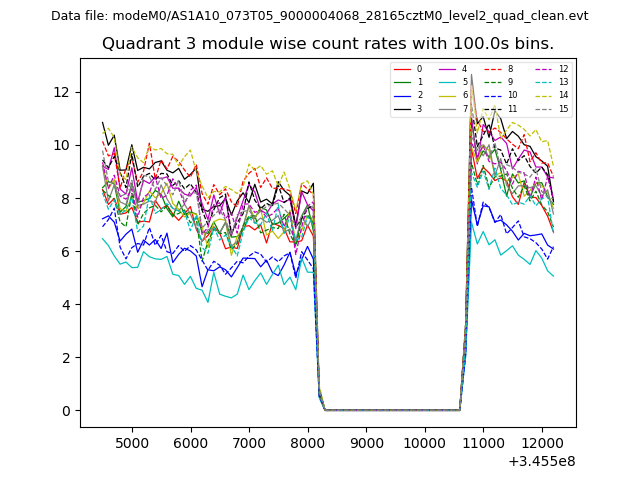
| Module-wise count rates for Quadrant C Data is divided into 100 sec bins |
 |
 |
| Module-wise count rates for Quadrant D Data is divided into 100 sec bins |
 |
 |
| Parameter | Plot |
|---|---|
| CZT HV Monitor |  |
| D_VDD | 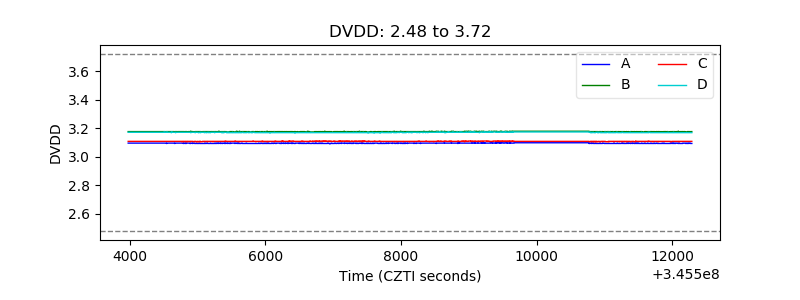 |
| Temperature 1 | 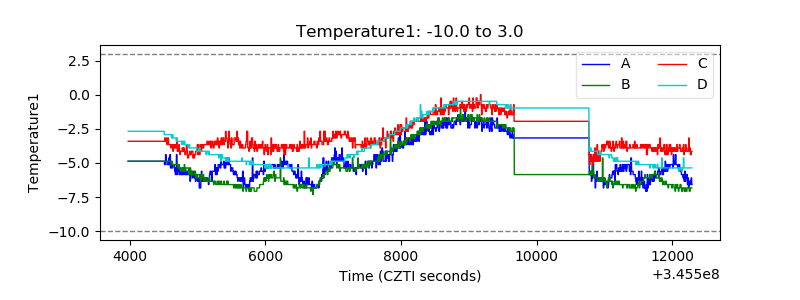 |
| Veto HV Monitor | 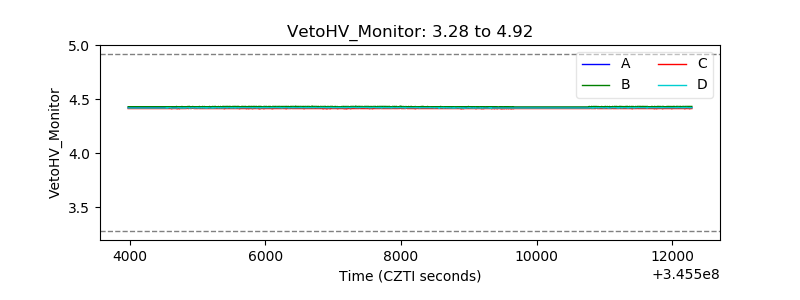 |
| Veto LLD | 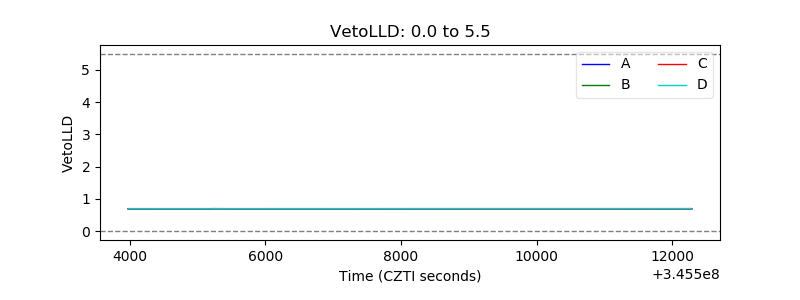 |
| Alpha Counter | 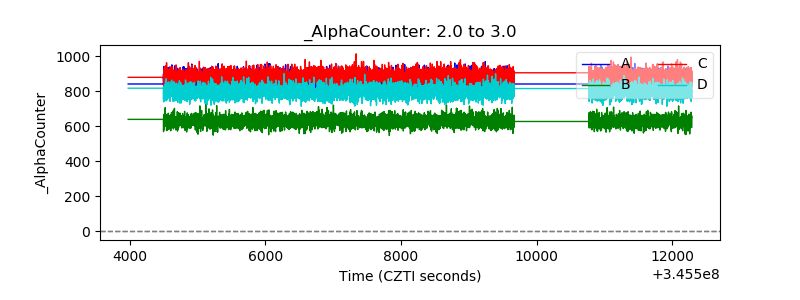 |
| _CPM_Rate | 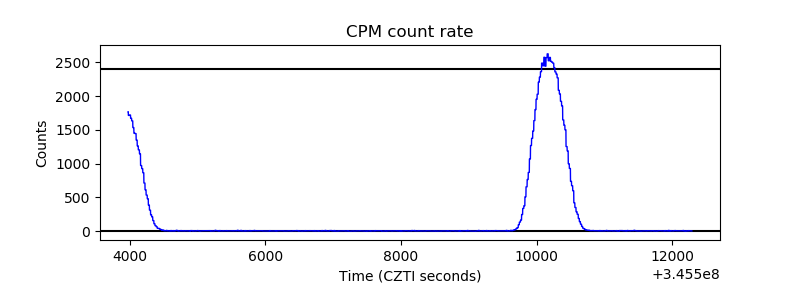 |
| CZT Counter | 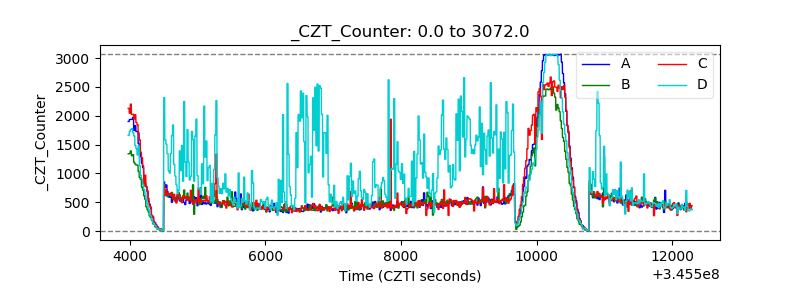 |
| +2.5 Volts monitor | 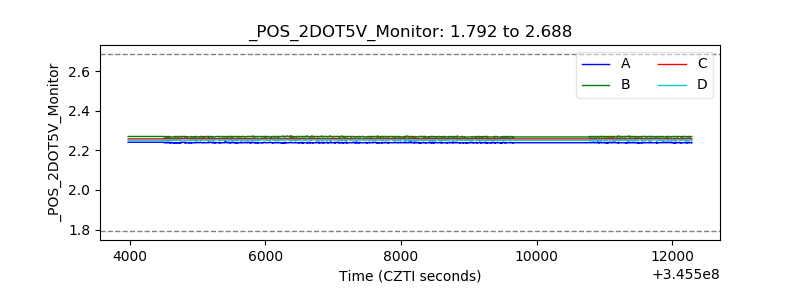 |
| +5 Volts monitor |  |
| _ROLL_ROT | 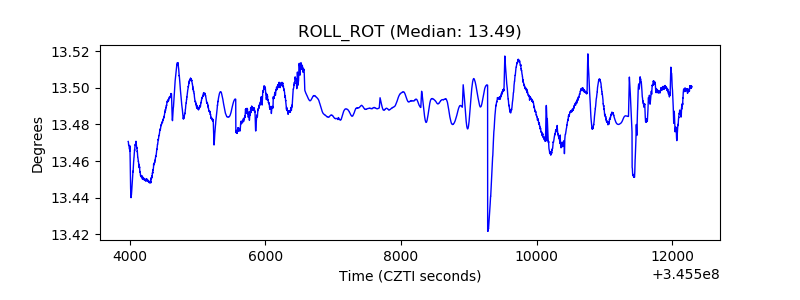 |
| _Roll_DEC | 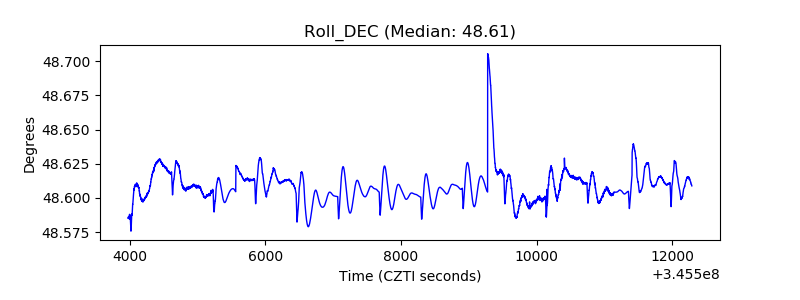 |
| _Roll_RA | 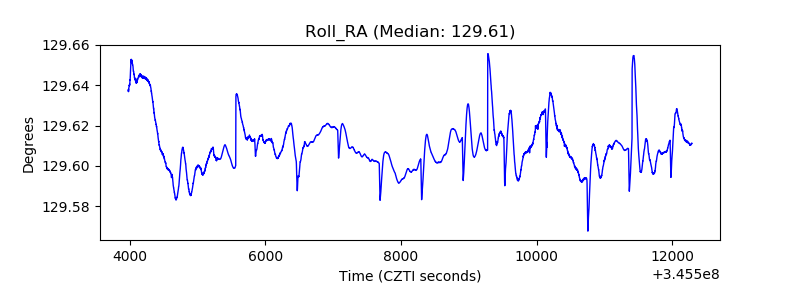 |
| Veto Counter | 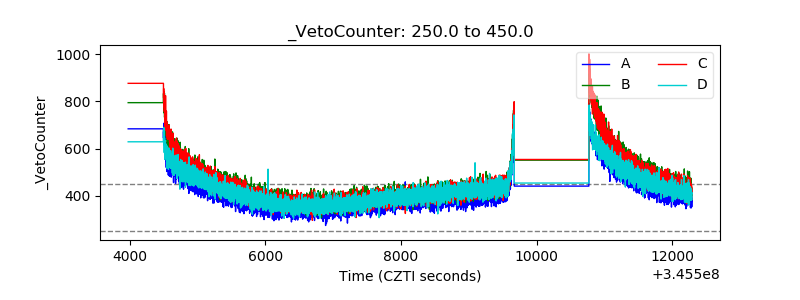 |