| Param | Original file | Final file |
|---|---|---|
| Filename | modeM0/AS1A10_073T05_9000004068_28166cztM0_level2.evt | modeM0/AS1A10_073T05_9000004068_28166cztM0_level2_quad_clean.evt |
| Size (bytes) | 485,208,000 | 104,964,480 |
| Size | 462.7 MB | 100.1 MB |
| Events in quadrant A | 3,132,569 | 698,625 |
| Events in quadrant B | 3,217,546 | 710,343 |
| Events in quadrant C | 3,189,574 | 667,962 |
| Events in quadrant D | 4,710,905 | 645,979 |
| Mode M0 | |||
|---|---|---|---|
| Quadrant | BADHDUFLAG | Total packets | Discarded packets |
| A | 0 | 13514 | 0 |
| B | 0 | 13760 | 0 |
| C | 0 | 13722 | 0 |
| D | 0 | 18529 | 0 |
| Mode M9 | |||
|---|---|---|---|
| Quadrant | BADHDUFLAG | Total packets | Discarded packets |
| A | 0 | 15 | 0 |
| B | 0 | 16 | 0 |
| C | 0 | 16 | 0 |
| D | 0 | 16 | 0 |
| Quadrant | Total seconds | Saturated seconds | Saturation percentage |
|---|---|---|---|
| A | 6536 | 19 | 0.290698% |
| B | 6536 | 23 | 0.351897% |
| C | 6536 | 52 | 0.795594% |
| D | 6535 | 210 | 3.213466% |
Noise dominated data is calculated using 1-second bins in cleaned event files. If a bin has >2000 counts, and if more than 50% of those come from <1% of pixels, then it is considered to be noise-dominated and hence unusable.
| Quadrant | # 1 sec bins | Bins with >0 counts | Bins with >2000 counts | High rate bins dominated by noise | Noise dominated (total time) | Noise dominated (detector-on time) | Marked lightcurve |
|---|---|---|---|---|---|---|---|
| A | 7756 | 6537 | 0 | 0 | 0.00% | 0.00% | 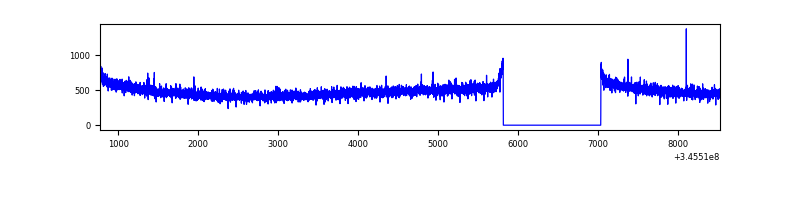 |
| B | 7756 | 6537 | 1 | 1 | 0.01% | 0.02% | 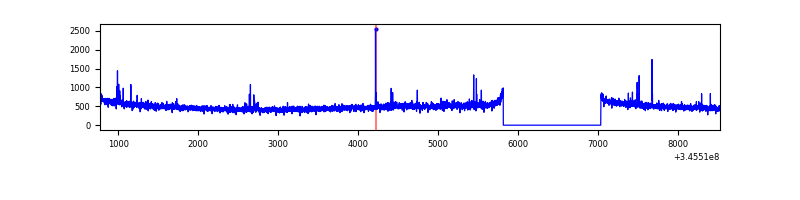 |
| C | 7756 | 6537 | 0 | 0 | 0.00% | 0.00% | 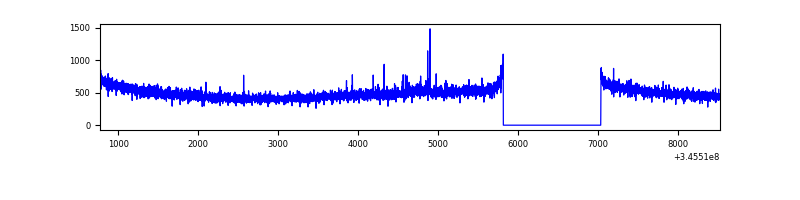 |
| D | 7755 | 6536 | 188 | 188 | 2.42% | 2.88% | 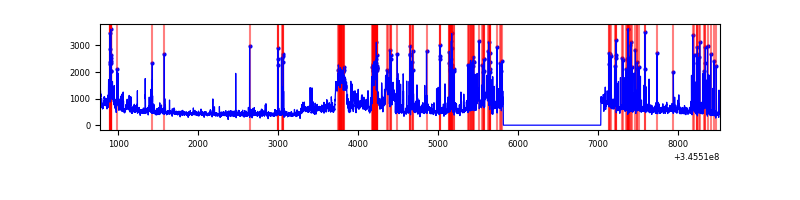 |
Top three noisy pixels from each quadrant. If the there are fewer than three noisy pixels in the level2.evt file, extra rows are filled as -1
| Pixel properties | Quadrant properties | ||||||
|---|---|---|---|---|---|---|---|
| Quadrant | DetID | PixID | Counts | Sigma | Mean | Median | Sigma |
| A | 13 | 254 | 10695 | 62.4 | 811 | 798 | 158.6 |
| A | 3 | 137 | 7462 | 42.02 | 811 | 798 | 158.6 |
| A | 0 | 226 | 6825 | 38.0 | 811 | 798 | 158.6 |
| B | 10 | 246 | 19763 | 126.13 | 808 | 789 | 150.4 |
| B | 12 | 111 | 18289 | 116.33 | 808 | 789 | 150.4 |
| B | 11 | 111 | 16641 | 105.38 | 808 | 789 | 150.4 |
| C | 14 | 238 | 128745 | 711.35 | 776 | 783 | 179.9 |
| C | 3 | 233 | 28141 | 152.09 | 776 | 783 | 179.9 |
| C | 15 | 208 | 9618 | 49.11 | 776 | 783 | 179.9 |
| D | 1 | 52 | 618726 | 3389.53 | 768 | 748 | 182.3 |
| D | 13 | 104 | 573369 | 3140.75 | 768 | 748 | 182.3 |
| D | 8 | 195 | 308348 | 1687.15 | 768 | 748 | 182.3 |
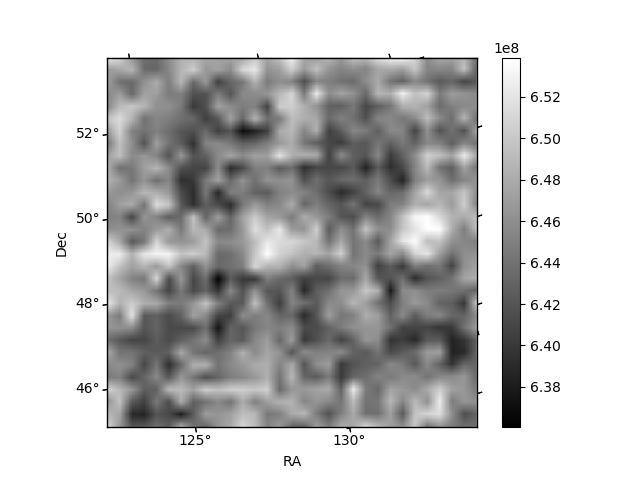
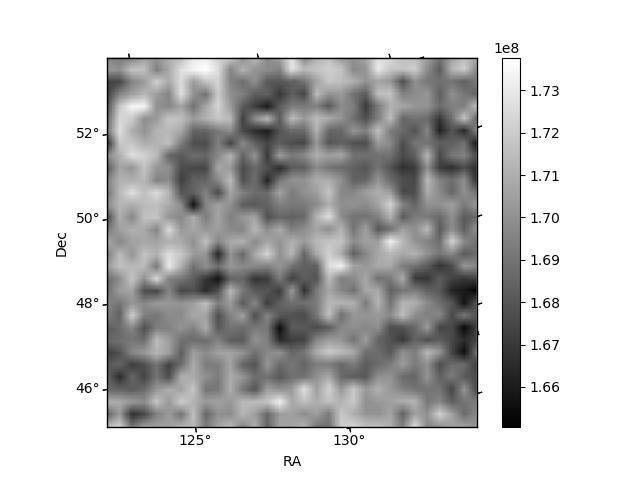
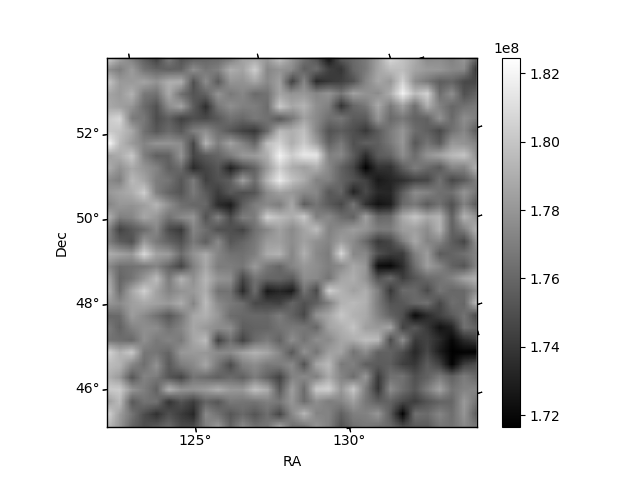
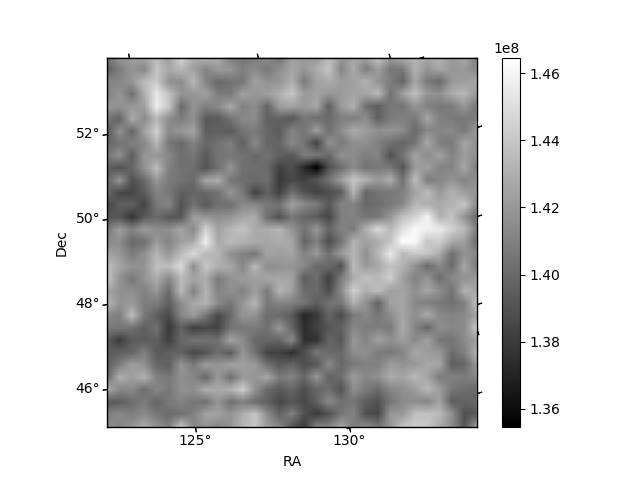
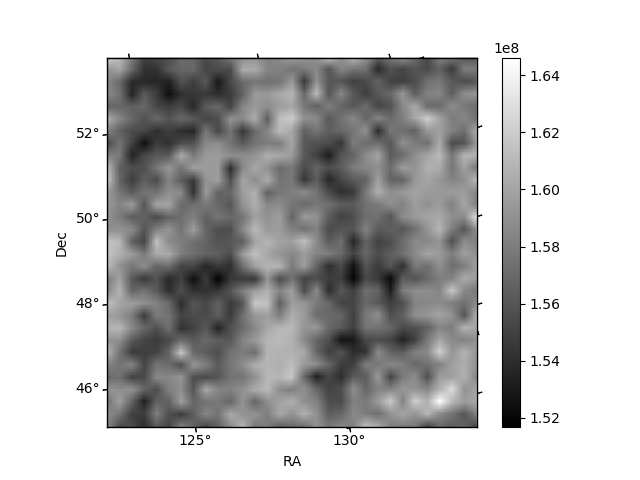
Histogram calculated using DETX and DETY for each event in the final _common_clean file
| Quadrant A | 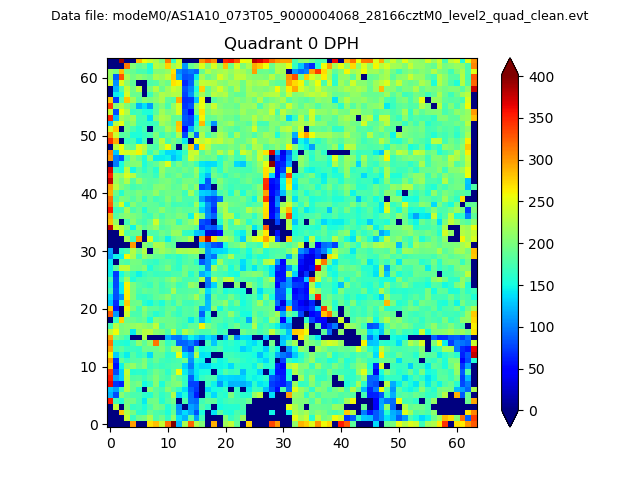 |
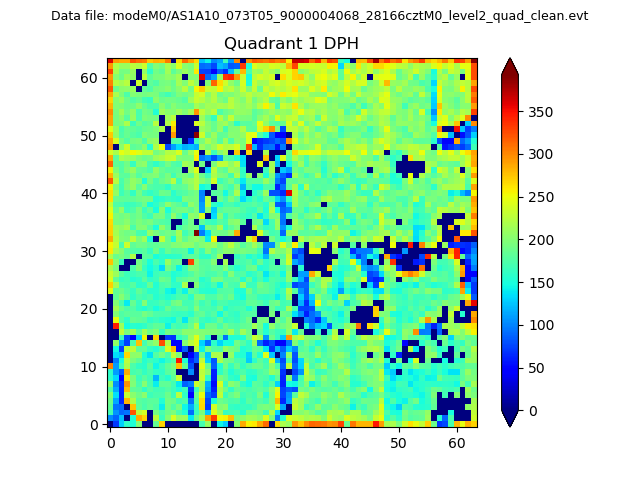 |
Quadrant B |
|---|---|---|---|
| Quadrant D | 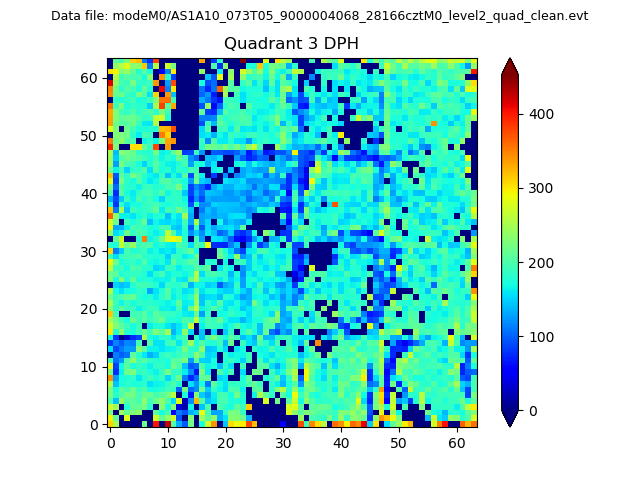 |
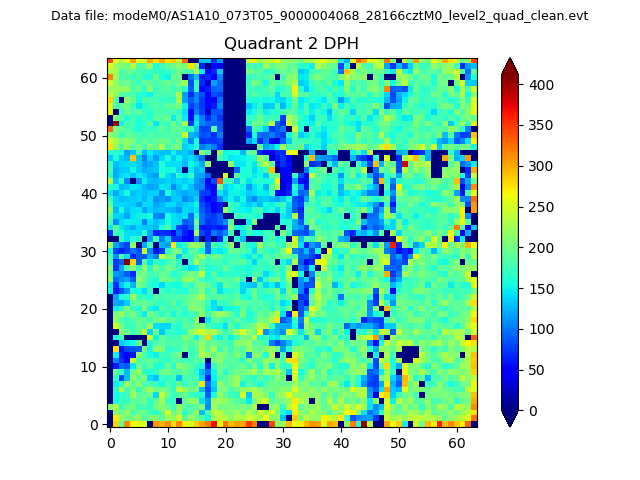 |
Quadrant C |
| Plot type | Count rate plots | Images |
|---|---|---|
| Comparison with Poisson distribution Blue bars denote a histogram of data divided into 1 sec bins. Red curve is a Poisson curve with rate = median count rate of data. |
 |
 |
| Quadrant-wise count rates Data is divided into 100 sec bins |
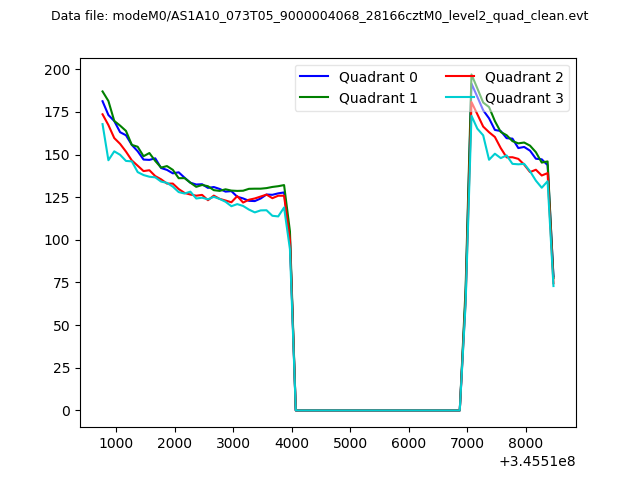 |
|
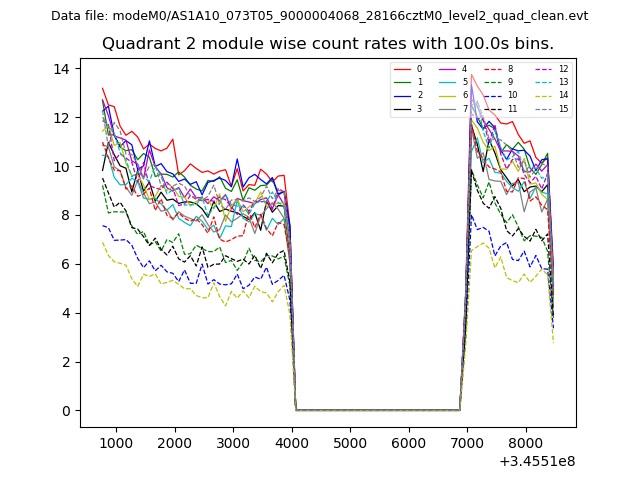
| Module-wise count rates for Quadrant A Data is divided into 100 sec bins |
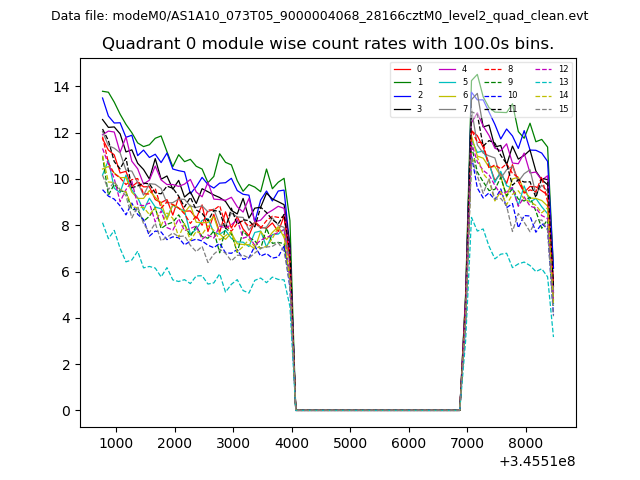 |
 |
| Module-wise count rates for Quadrant B Data is divided into 100 sec bins |
 |
 |
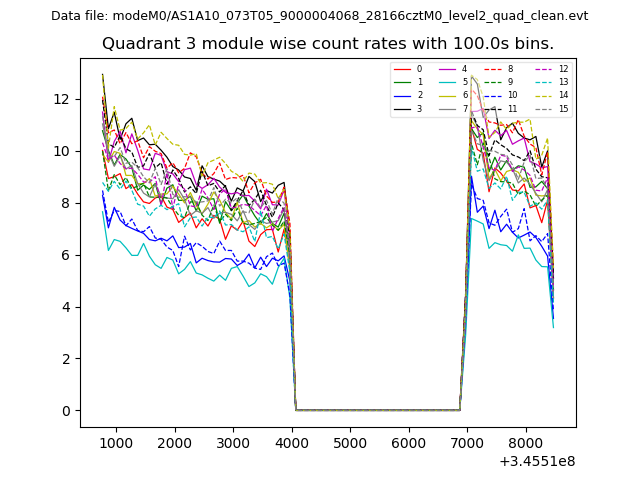
| Module-wise count rates for Quadrant C Data is divided into 100 sec bins |
 |
 |
| Module-wise count rates for Quadrant D Data is divided into 100 sec bins |
 |
 |
| Parameter | Plot |
|---|---|
| CZT HV Monitor | 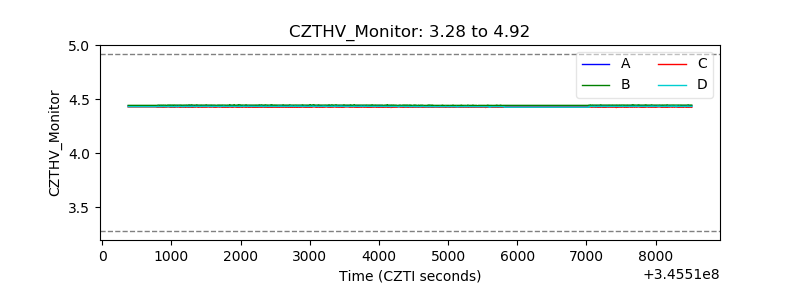 |
| D_VDD | 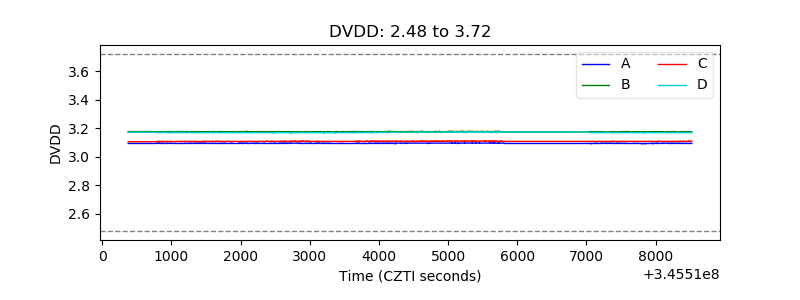 |
| Temperature 1 | 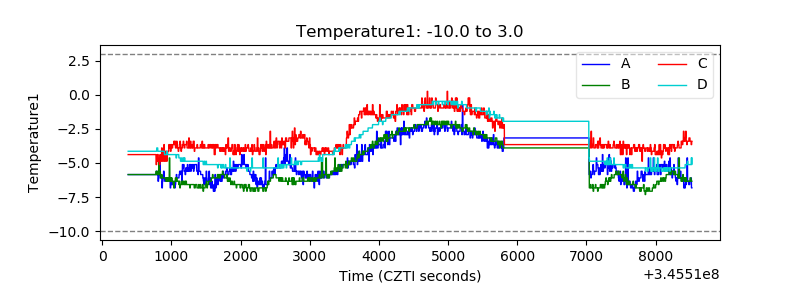 |
| Veto HV Monitor | 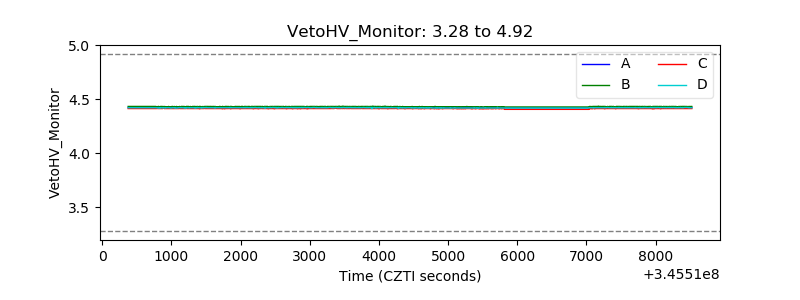 |
| Veto LLD | 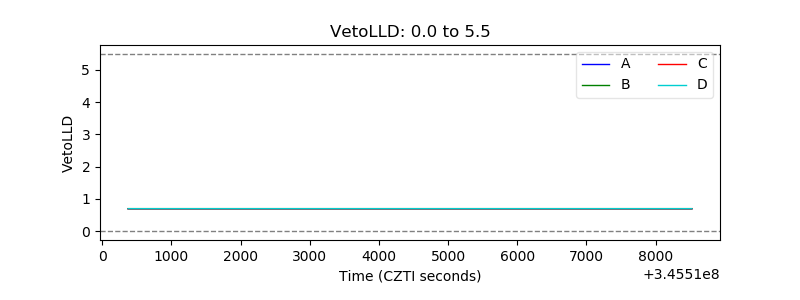 |
| Alpha Counter |  |
| _CPM_Rate | 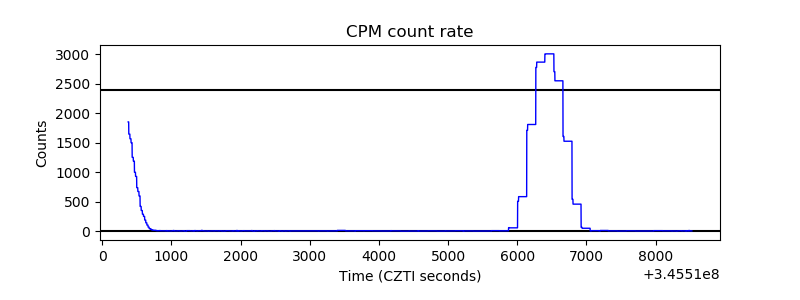 |
| CZT Counter | 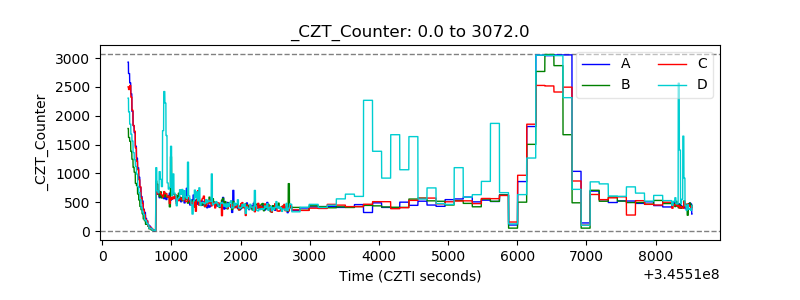 |
| +2.5 Volts monitor |  |
| +5 Volts monitor |  |
| _ROLL_ROT | 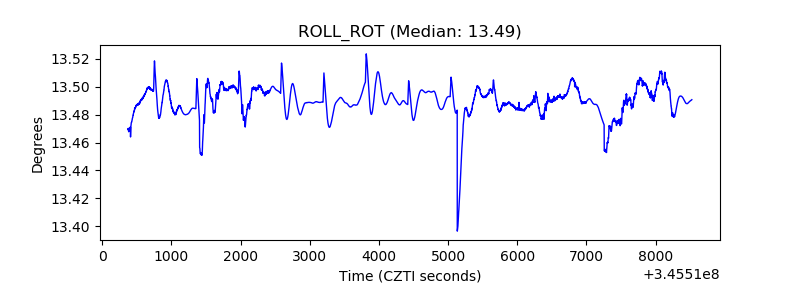 |
| _Roll_DEC | 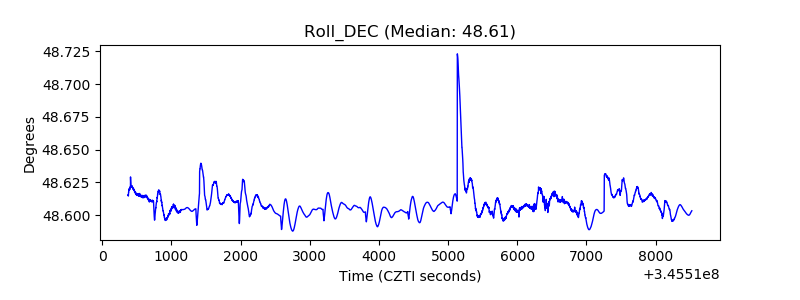 |
| _Roll_RA | 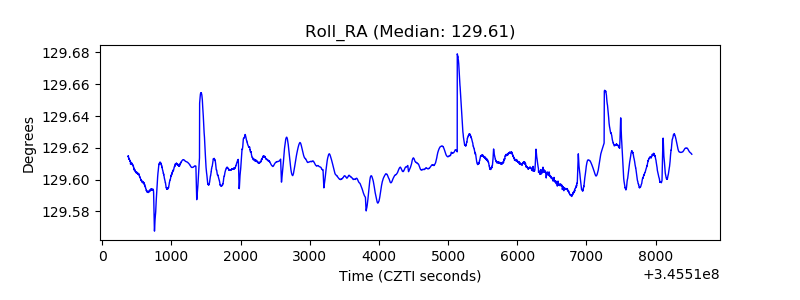 |
| Veto Counter | 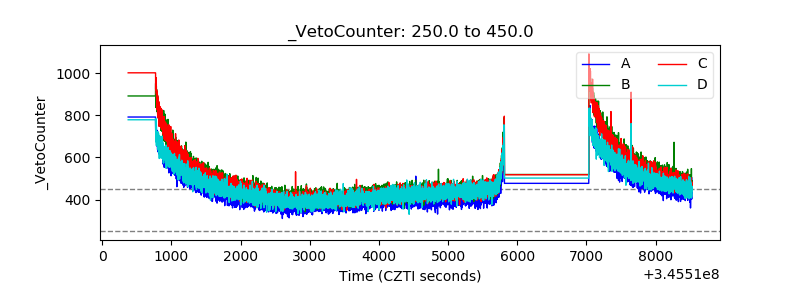 |