| Param | Original file | Final file |
|---|---|---|
| Filename | modeM0/AS1A10_073T05_9000004068_28167cztM0_level2.evt | modeM0/AS1A10_073T05_9000004068_28167cztM0_level2_quad_clean.evt |
| Size (bytes) | 537,266,880 | 98,553,600 |
| Size | 512.4 MB | 94.0 MB |
| Events in quadrant A | 3,076,989 | 667,826 |
| Events in quadrant B | 5,320,952 | 646,693 |
| Events in quadrant C | 3,091,889 | 632,176 |
| Events in quadrant D | 4,361,473 | 605,648 |
| Mode M0 | |||
|---|---|---|---|
| Quadrant | BADHDUFLAG | Total packets | Discarded packets |
| A | 0 | 12926 | 0 |
| B | 0 | 19791 | 0 |
| C | 0 | 13009 | 0 |
| D | 0 | 17155 | 0 |
| Mode M9 | |||
|---|---|---|---|
| Quadrant | BADHDUFLAG | Total packets | Discarded packets |
| A | 0 | 13 | 0 |
| B | 0 | 13 | 0 |
| C | 0 | 13 | 0 |
| D | 0 | 13 | 0 |
| Quadrant | Total seconds | Saturated seconds | Saturation percentage |
|---|---|---|---|
| A | 6188 | 19 | 0.307046% |
| B | 6189 | 936 | 15.123606% |
| C | 6189 | 53 | 0.856358% |
| D | 6189 | 228 | 3.683955% |
Noise dominated data is calculated using 1-second bins in cleaned event files. If a bin has >2000 counts, and if more than 50% of those come from <1% of pixels, then it is considered to be noise-dominated and hence unusable.
| Quadrant | # 1 sec bins | Bins with >0 counts | Bins with >2000 counts | High rate bins dominated by noise | Noise dominated (total time) | Noise dominated (detector-on time) | Marked lightcurve |
|---|---|---|---|---|---|---|---|
| A | 7479 | 6189 | 0 | 0 | 0.00% | 0.00% | 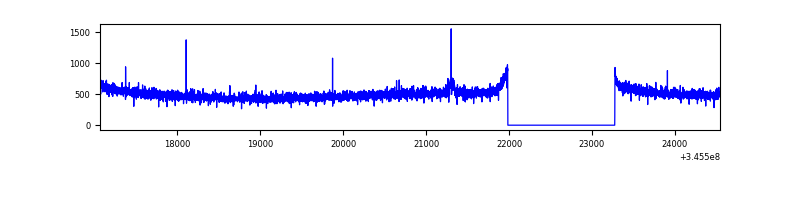 |
| B | 7480 | 6190 | 720 | 720 | 9.63% | 11.63% | 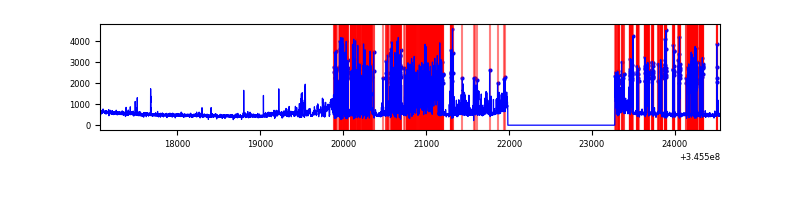 |
| C | 7480 | 6190 | 0 | 0 | 0.00% | 0.00% |  |
| D | 7480 | 6190 | 184 | 184 | 2.46% | 2.97% | 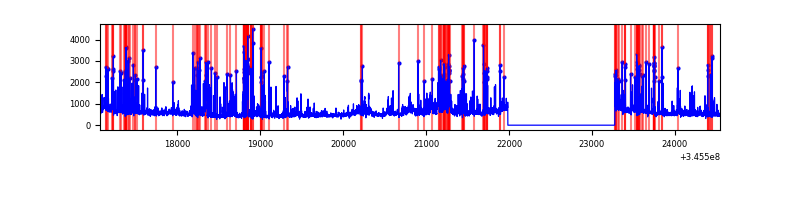 |
Top three noisy pixels from each quadrant. If the there are fewer than three noisy pixels in the level2.evt file, extra rows are filled as -1
| Pixel properties | Quadrant properties | ||||||
|---|---|---|---|---|---|---|---|
| Quadrant | DetID | PixID | Counts | Sigma | Mean | Median | Sigma |
| A | 13 | 254 | 9670 | 57.0 | 794 | 779 | 156.0 |
| A | 15 | 174 | 9314 | 54.72 | 794 | 779 | 156.0 |
| A | 3 | 137 | 7085 | 40.43 | 794 | 779 | 156.0 |
| B | 10 | 245 | 2382963 | 17302.01 | 738 | 723 | 137.7 |
| B | 0 | 230 | 21404 | 150.2 | 738 | 723 | 137.7 |
| B | 12 | 111 | 16216 | 112.52 | 738 | 723 | 137.7 |
| C | 14 | 238 | 124286 | 715.56 | 751 | 758 | 172.6 |
| C | 3 | 233 | 38232 | 217.07 | 751 | 758 | 172.6 |
| C | 13 | 61 | 5323 | 26.44 | 751 | 758 | 172.6 |
| D | 1 | 52 | 825883 | 4737.89 | 743 | 725 | 174.2 |
| D | 8 | 195 | 361437 | 2071.14 | 743 | 725 | 174.2 |
| D | 7 | 223 | 152624 | 872.17 | 743 | 725 | 174.2 |
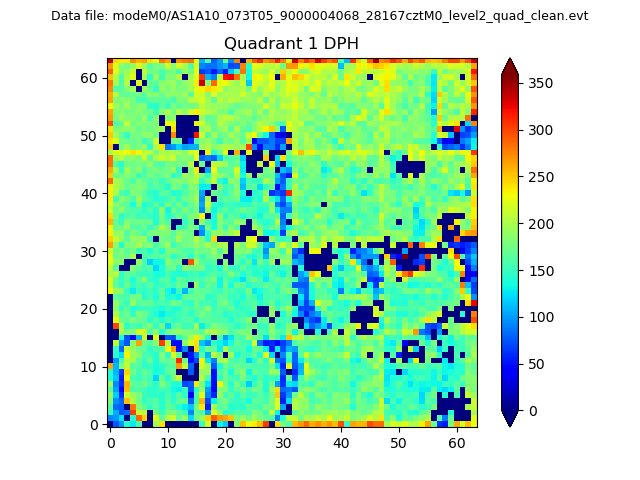
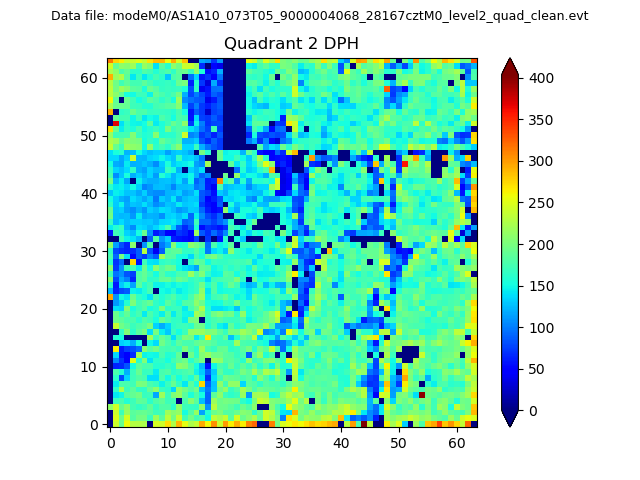
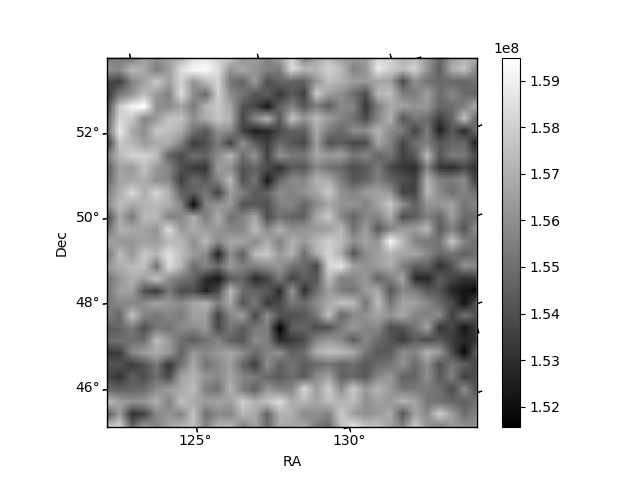
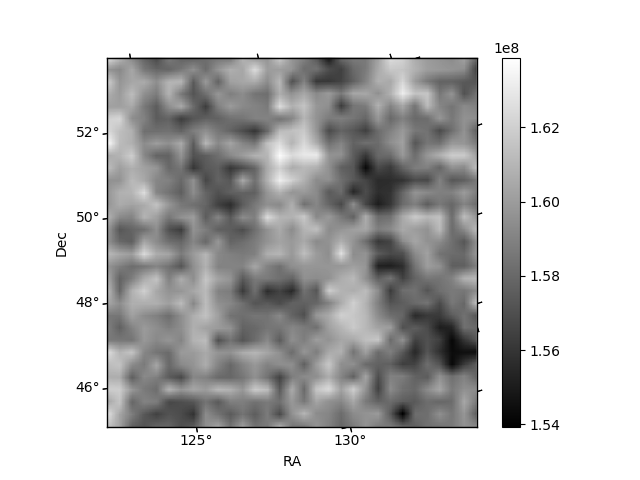
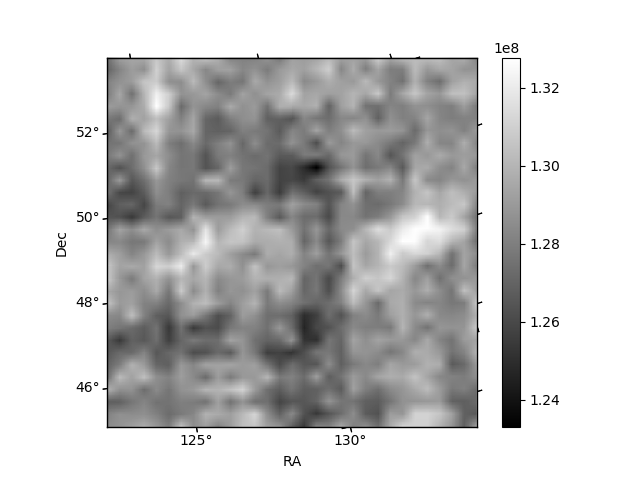
Histogram calculated using DETX and DETY for each event in the final _common_clean file
| Quadrant A | 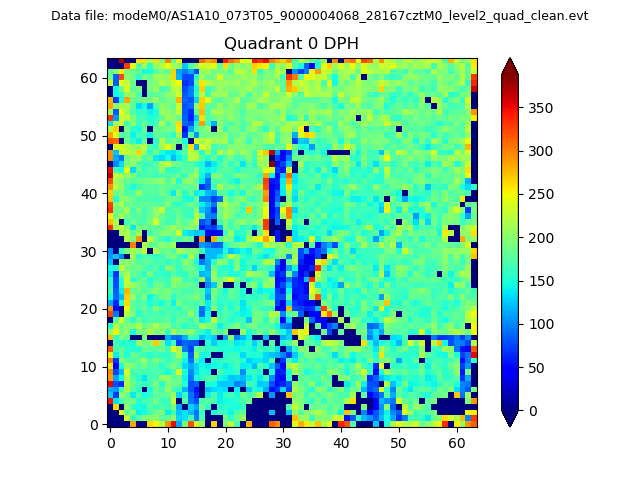 |
 |
Quadrant B |
|---|---|---|---|
| Quadrant D | 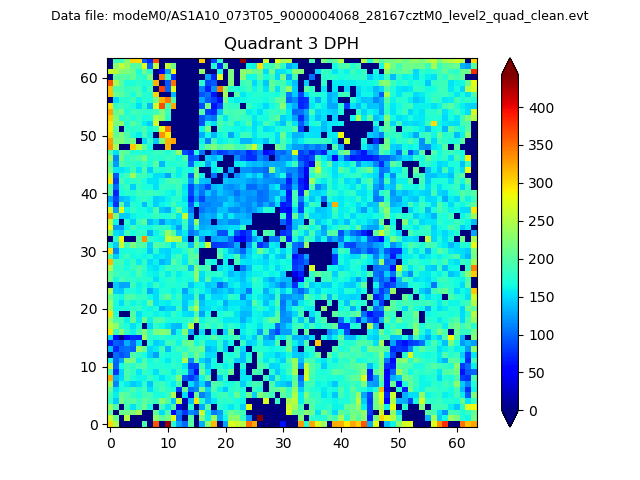 |
 |
Quadrant C |
| Plot type | Count rate plots | Images |
|---|---|---|
| Comparison with Poisson distribution Blue bars denote a histogram of data divided into 1 sec bins. Red curve is a Poisson curve with rate = median count rate of data. |
 |
 |
| Quadrant-wise count rates Data is divided into 100 sec bins |
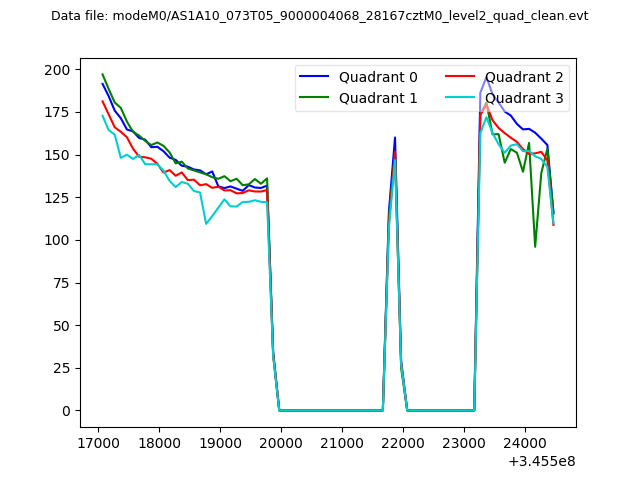 |
|
| Module-wise count rates for Quadrant A Data is divided into 100 sec bins |
 |
 |
| Module-wise count rates for Quadrant B Data is divided into 100 sec bins |
 |
 |
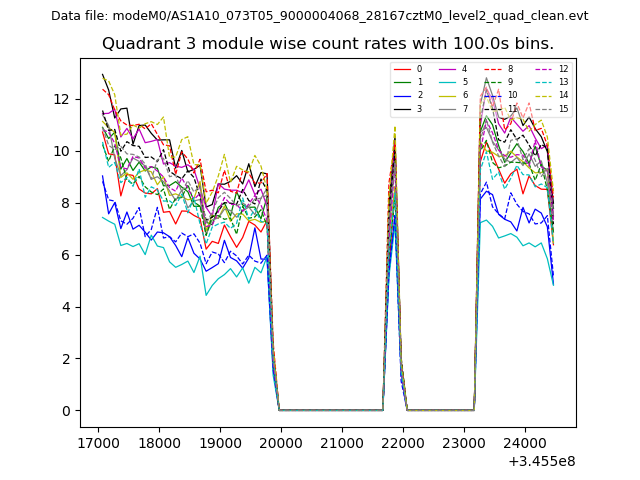
| Module-wise count rates for Quadrant C Data is divided into 100 sec bins |
 |
 |
| Module-wise count rates for Quadrant D Data is divided into 100 sec bins |
 |
 |
| Parameter | Plot |
|---|---|
| CZT HV Monitor |  |
| D_VDD | 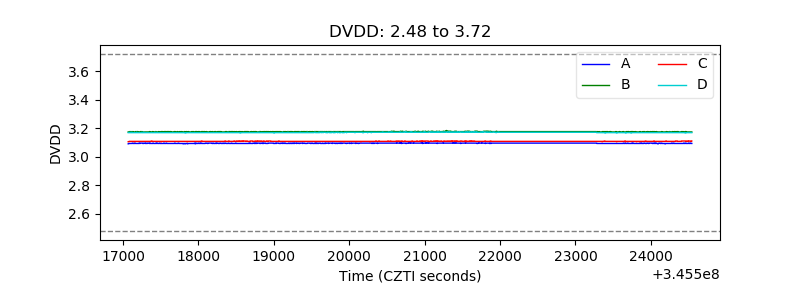 |
| Temperature 1 | 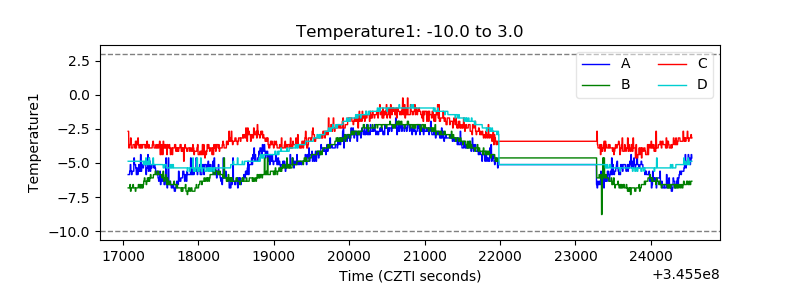 |
| Veto HV Monitor | 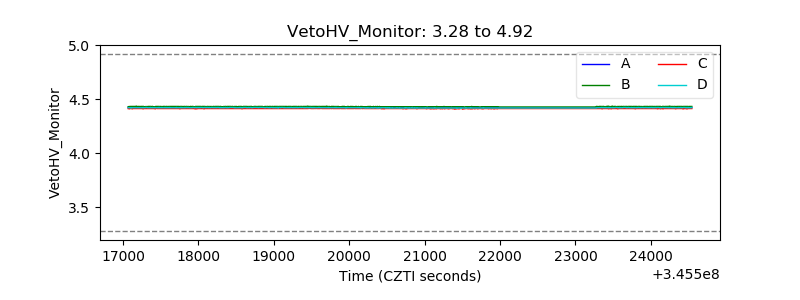 |
| Veto LLD | 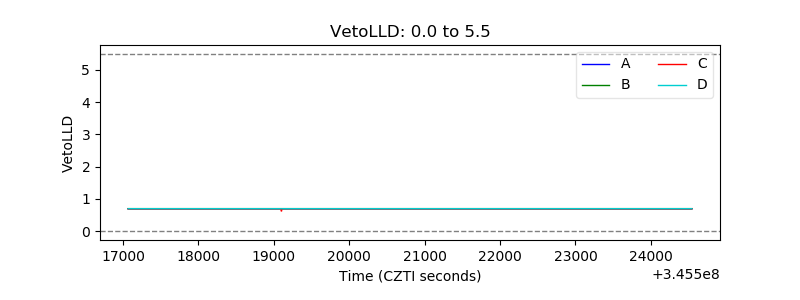 |
| Alpha Counter | 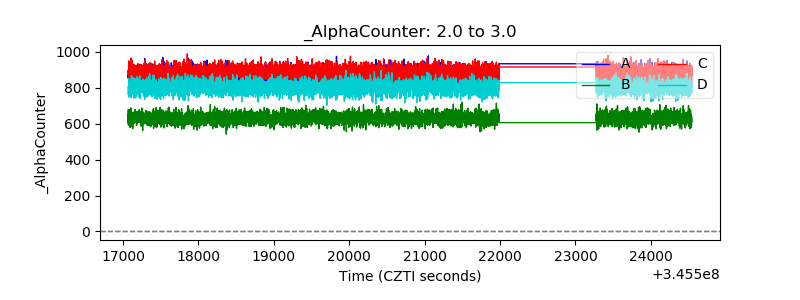 |
| _CPM_Rate | 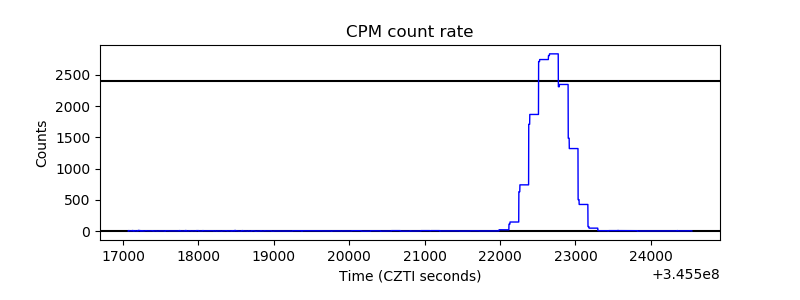 |
| CZT Counter | 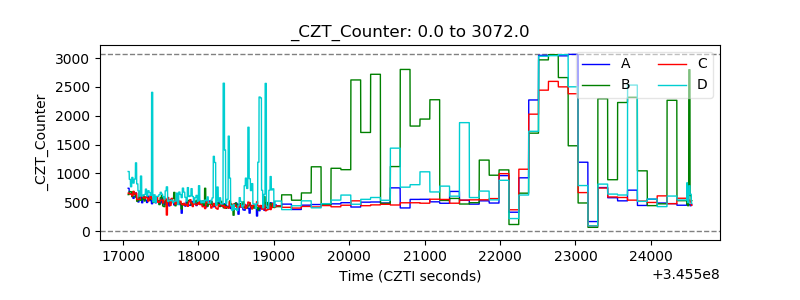 |
| +2.5 Volts monitor | 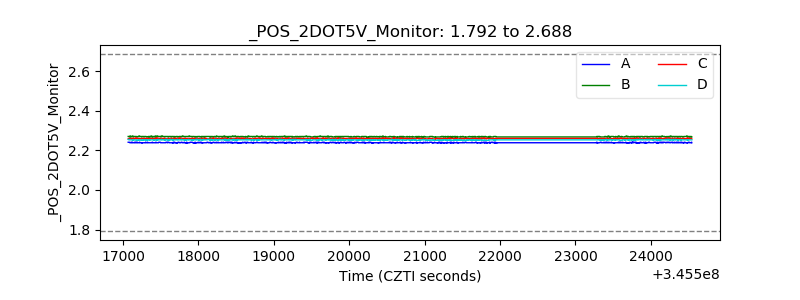 |
| +5 Volts monitor |  |
| _ROLL_ROT | 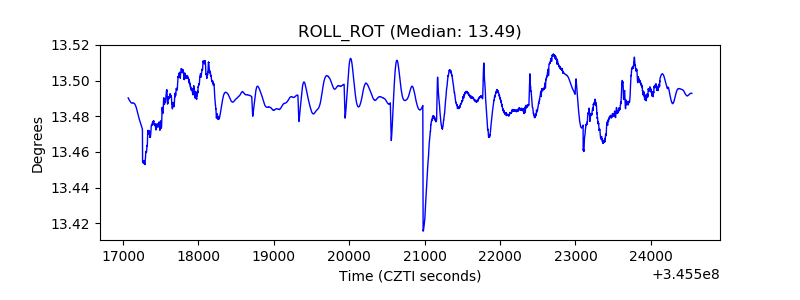 |
| _Roll_DEC | 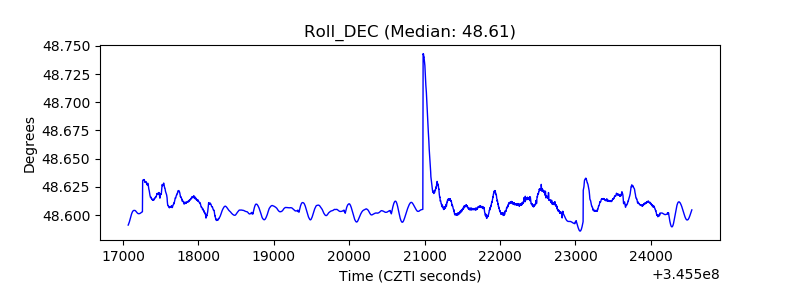 |
| _Roll_RA | 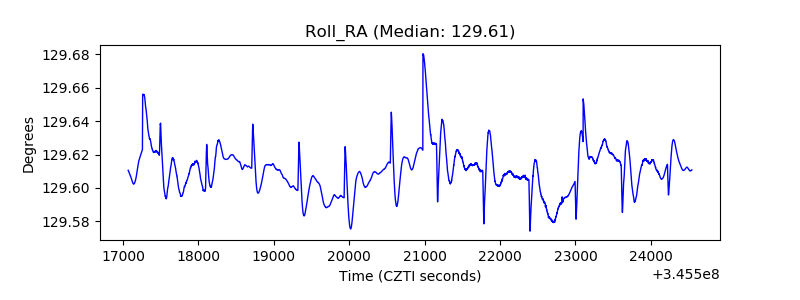 |
| Veto Counter |  |