| Param | Original file | Final file |
|---|---|---|
| Filename | modeM0/AS1A10_073T05_9000004068_28168cztM0_level2.evt | modeM0/AS1A10_073T05_9000004068_28168cztM0_level2_quad_clean.evt |
| Size (bytes) | 540,947,520 | 107,173,440 |
| Size | 515.9 MB | 102.2 MB |
| Events in quadrant A | 3,286,809 | 732,262 |
| Events in quadrant B | 4,373,417 | 705,692 |
| Events in quadrant C | 3,461,673 | 683,958 |
| Events in quadrant D | 4,820,956 | 671,405 |
| Mode M0 | |||
|---|---|---|---|
| Quadrant | BADHDUFLAG | Total packets | Discarded packets |
| A | 0 | 13556 | 0 |
| B | 0 | 17057 | 0 |
| C | 0 | 14191 | 0 |
| D | 0 | 18650 | 0 |
| Mode M9 | |||
|---|---|---|---|
| Quadrant | BADHDUFLAG | Total packets | Discarded packets |
| A | 0 | 15 | 0 |
| B | 0 | 16 | 0 |
| C | 0 | 16 | 0 |
| D | 0 | 16 | 0 |
| Quadrant | Total seconds | Saturated seconds | Saturation percentage |
|---|---|---|---|
| A | 6490 | 25 | 0.385208% |
| B | 6490 | 354 | 5.454545% |
| C | 6490 | 85 | 1.309707% |
| D | 6490 | 331 | 5.100154% |
Noise dominated data is calculated using 1-second bins in cleaned event files. If a bin has >2000 counts, and if more than 50% of those come from <1% of pixels, then it is considered to be noise-dominated and hence unusable.
| Quadrant | # 1 sec bins | Bins with >0 counts | Bins with >2000 counts | High rate bins dominated by noise | Noise dominated (total time) | Noise dominated (detector-on time) | Marked lightcurve |
|---|---|---|---|---|---|---|---|
| A | 7785 | 6491 | 0 | 0 | 0.00% | 0.00% | 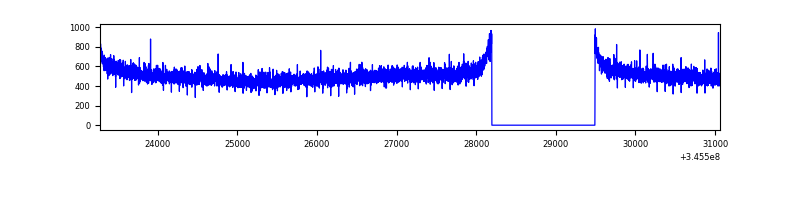 |
| B | 7785 | 6491 | 258 | 258 | 3.31% | 3.97% | 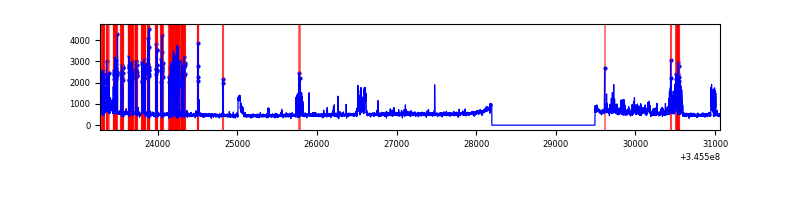 |
| C | 7785 | 6491 | 9 | 9 | 0.12% | 0.14% | 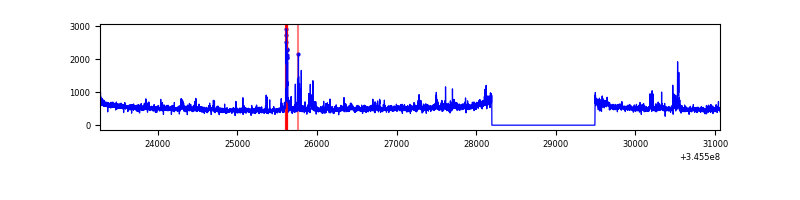 |
| D | 7785 | 6491 | 296 | 296 | 3.80% | 4.56% | 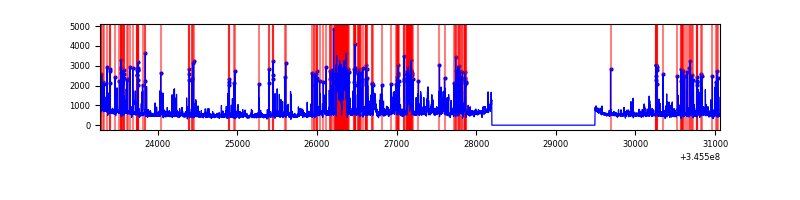 |
Top three noisy pixels from each quadrant. If the there are fewer than three noisy pixels in the level2.evt file, extra rows are filled as -1
| Pixel properties | Quadrant properties | ||||||
|---|---|---|---|---|---|---|---|
| Quadrant | DetID | PixID | Counts | Sigma | Mean | Median | Sigma |
| A | 13 | 254 | 9503 | 52.05 | 851 | 838 | 166.5 |
| A | 3 | 137 | 7583 | 40.52 | 851 | 838 | 166.5 |
| A | 0 | 226 | 7214 | 38.3 | 851 | 838 | 166.5 |
| B | 10 | 245 | 1043205 | 6833.15 | 820 | 802 | 152.6 |
| B | 15 | 32 | 78791 | 511.23 | 820 | 802 | 152.6 |
| B | 0 | 230 | 27285 | 173.6 | 820 | 802 | 152.6 |
| C | 3 | 233 | 220025 | 1215.11 | 794 | 800 | 180.4 |
| C | 14 | 238 | 132416 | 729.51 | 794 | 800 | 180.4 |
| C | 15 | 208 | 8544 | 42.92 | 794 | 800 | 180.4 |
| D | 1 | 52 | 593613 | 3182.53 | 792 | 773 | 186.3 |
| D | 8 | 195 | 460159 | 2466.11 | 792 | 773 | 186.3 |
| D | 5 | 222 | 282886 | 1514.46 | 792 | 773 | 186.3 |
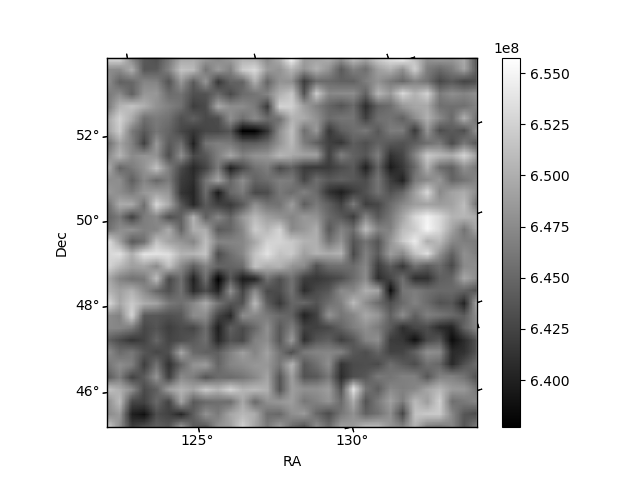
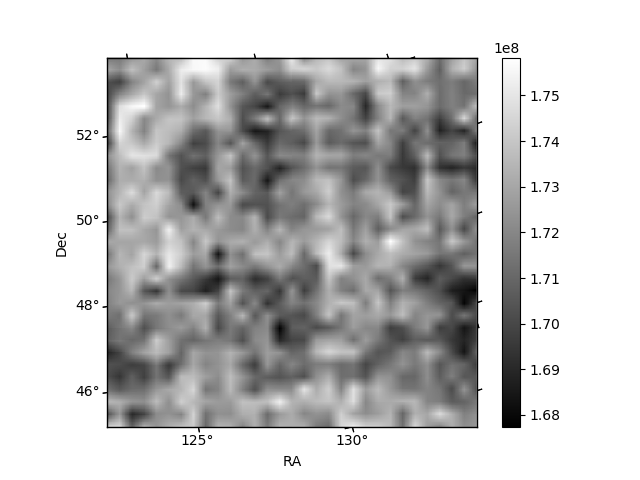
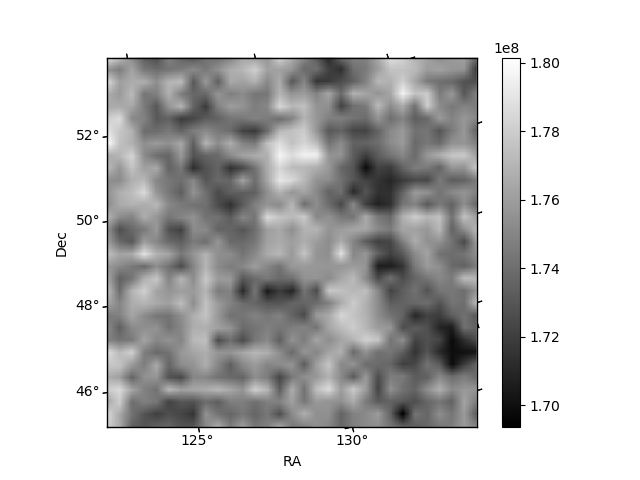
Histogram calculated using DETX and DETY for each event in the final _common_clean file
| Quadrant A | 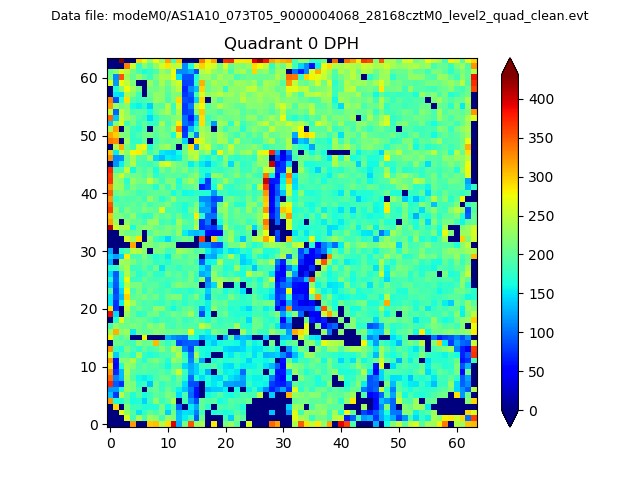 |
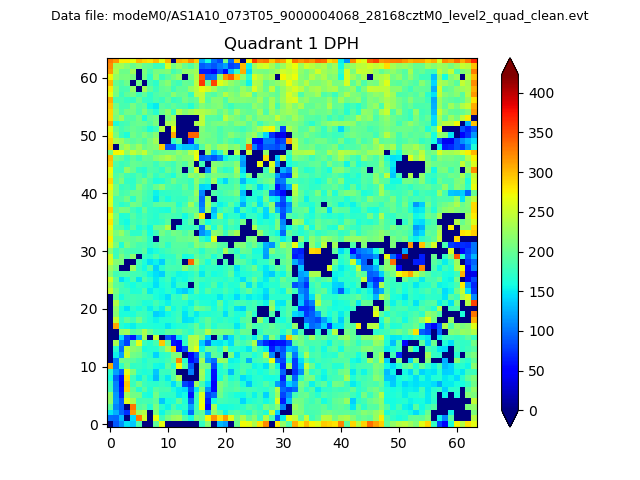 |
Quadrant B |
|---|---|---|---|
| Quadrant D | 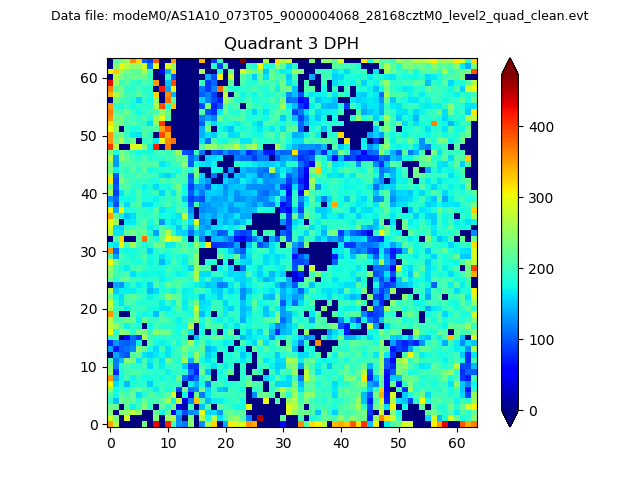 |
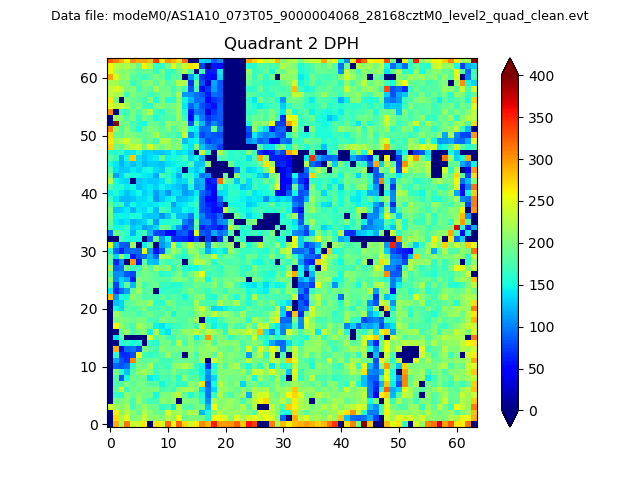 |
Quadrant C |
| Plot type | Count rate plots | Images |
|---|---|---|
| Comparison with Poisson distribution Blue bars denote a histogram of data divided into 1 sec bins. Red curve is a Poisson curve with rate = median count rate of data. |
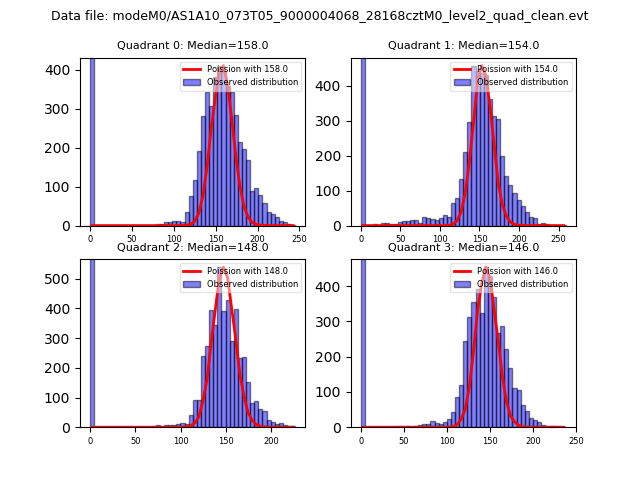 |
 |
| Quadrant-wise count rates Data is divided into 100 sec bins |
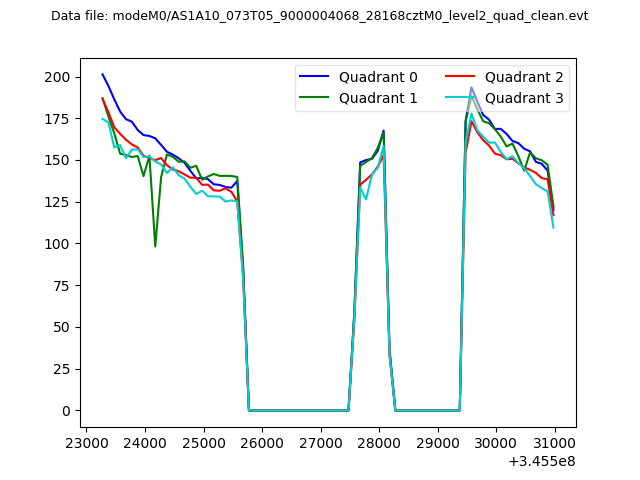 |
|
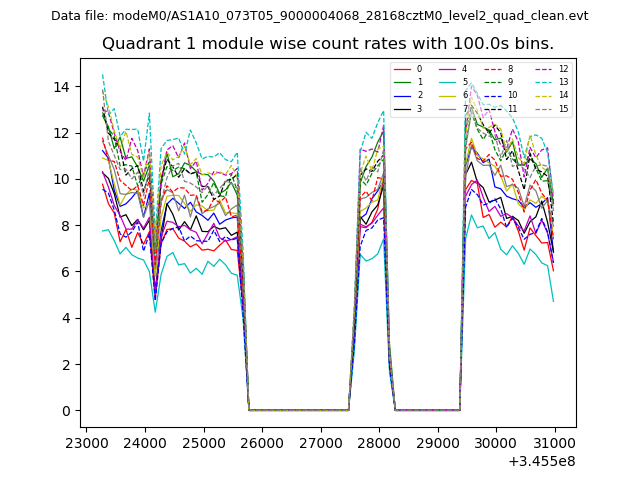
| Module-wise count rates for Quadrant A Data is divided into 100 sec bins |
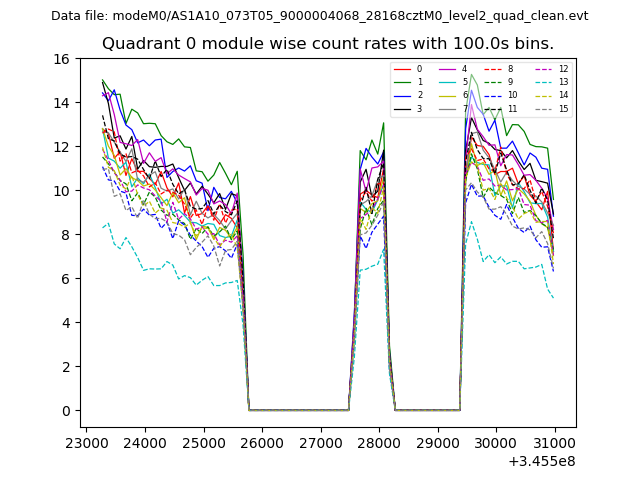 |
 |
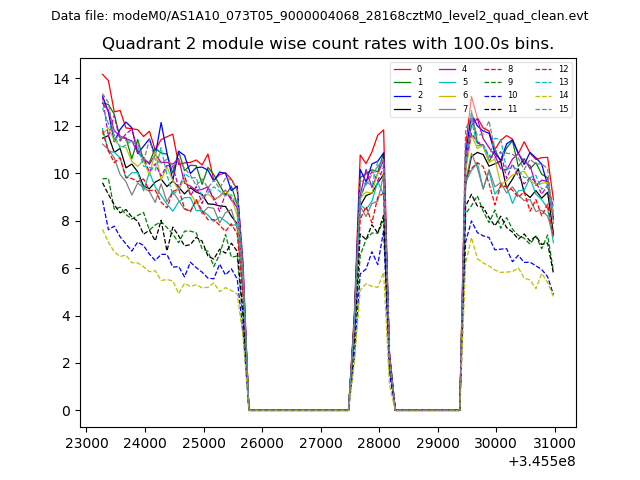
| Module-wise count rates for Quadrant B Data is divided into 100 sec bins |
 |
 |
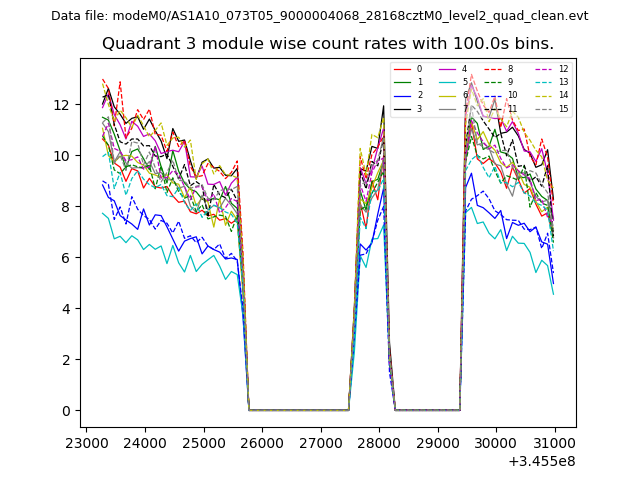
| Module-wise count rates for Quadrant C Data is divided into 100 sec bins |
 |
 |
| Module-wise count rates for Quadrant D Data is divided into 100 sec bins |
 |
 |
| Parameter | Plot |
|---|---|
| CZT HV Monitor | 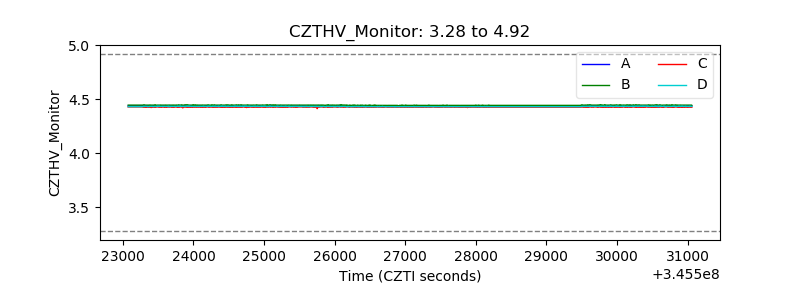 |
| D_VDD | 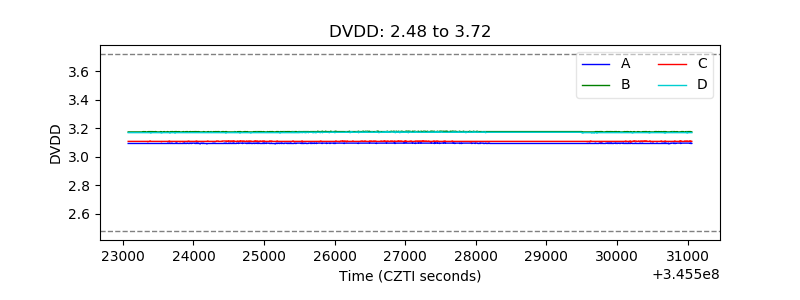 |
| Temperature 1 | 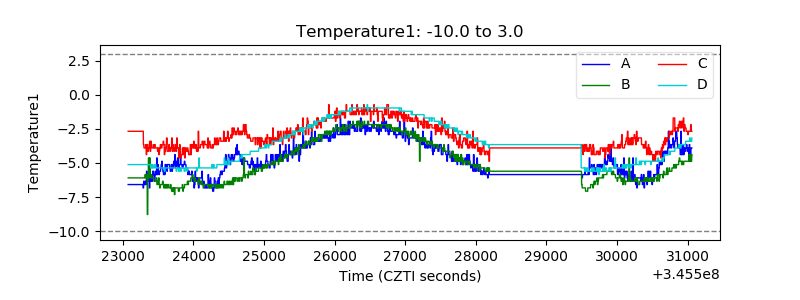 |
| Veto HV Monitor | 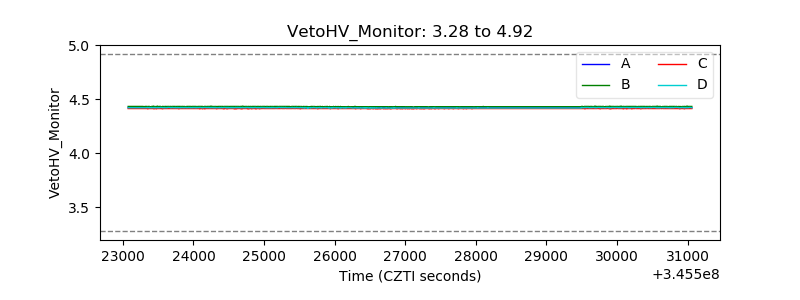 |
| Veto LLD | 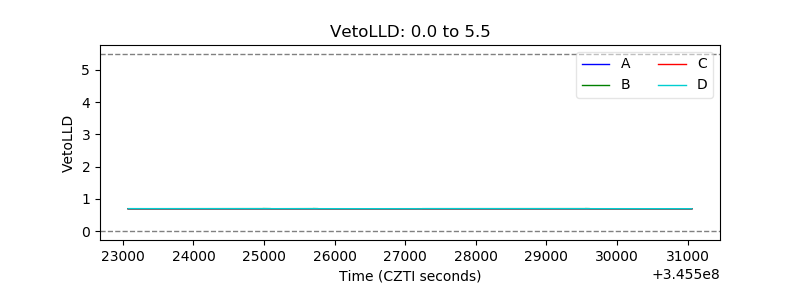 |
| Alpha Counter | 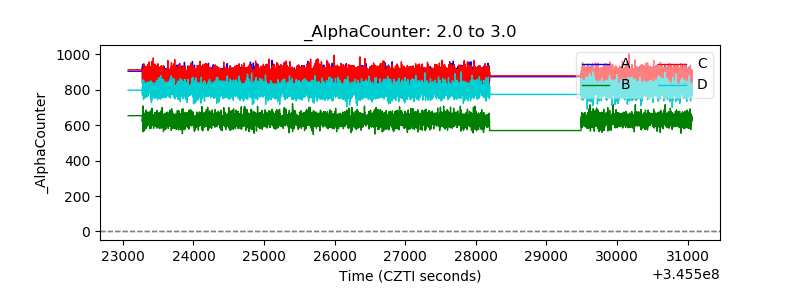 |
| _CPM_Rate | 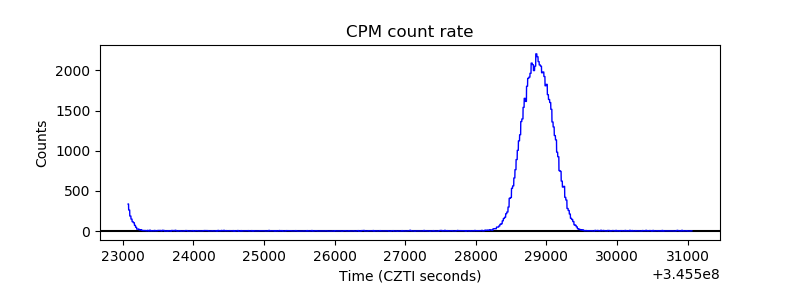 |
| CZT Counter | 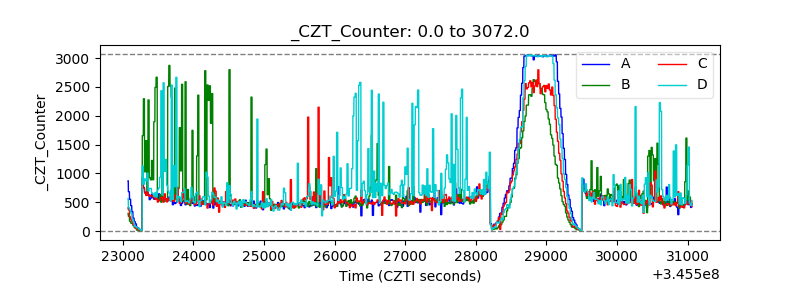 |
| +2.5 Volts monitor |  |
| +5 Volts monitor |  |
| _ROLL_ROT | 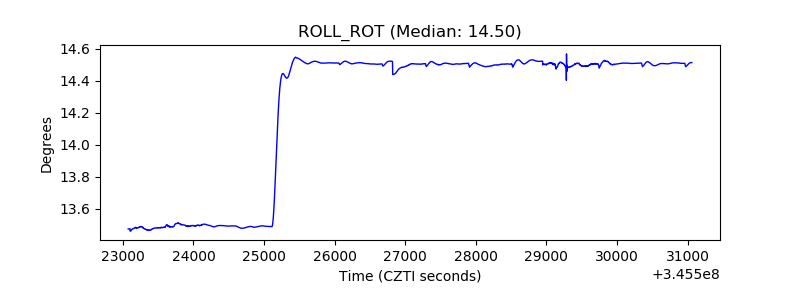 |
| _Roll_DEC | 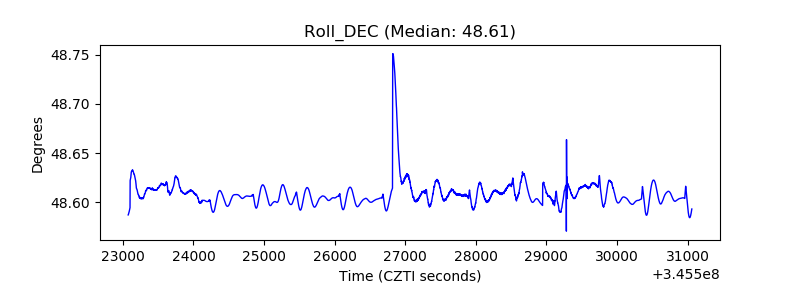 |
| _Roll_RA | 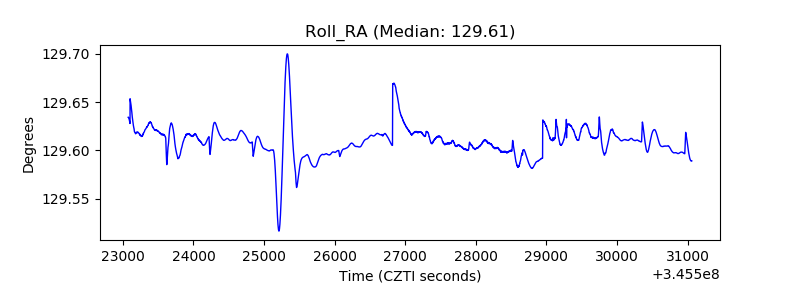 |
| Veto Counter | 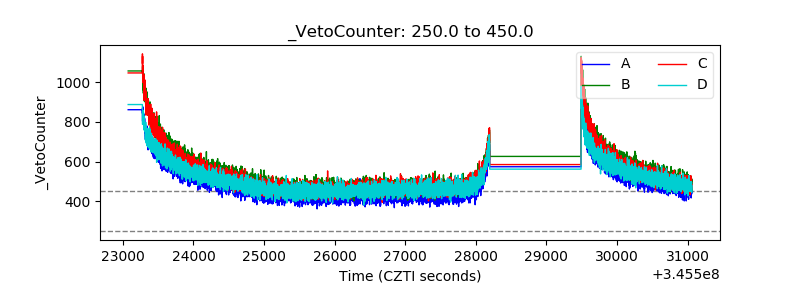 |