| Param | Original file | Final file |
|---|---|---|
| Filename | modeM0/AS1A10_073T05_9000004068_28170cztM0_level2.evt | modeM0/AS1A10_073T05_9000004068_28170cztM0_level2_quad_clean.evt |
| Size (bytes) | 510,995,520 | 86,791,680 |
| Size | 487.3 MB | 82.8 MB |
| Events in quadrant A | 2,944,109 | 576,605 |
| Events in quadrant B | 3,189,289 | 572,751 |
| Events in quadrant C | 3,003,994 | 545,945 |
| Events in quadrant D | 5,926,918 | 509,328 |
| Mode M0 | |||
|---|---|---|---|
| Quadrant | BADHDUFLAG | Total packets | Discarded packets |
| A | 0 | 12362 | 0 |
| B | 0 | 13160 | 0 |
| C | 0 | 12590 | 0 |
| D | 0 | 21720 | 0 |
| Mode M9 | |||
|---|---|---|---|
| Quadrant | BADHDUFLAG | Total packets | Discarded packets |
| A | 0 | 11 | 0 |
| B | 0 | 11 | 0 |
| C | 0 | 11 | 0 |
| D | 0 | 11 | 0 |
| Quadrant | Total seconds | Saturated seconds | Saturation percentage |
|---|---|---|---|
| A | 6061 | 57 | 0.940439% |
| B | 6062 | 113 | 1.864071% |
| C | 6062 | 83 | 1.369185% |
| D | 6061 | 745 | 12.291701% |
Noise dominated data is calculated using 1-second bins in cleaned event files. If a bin has >2000 counts, and if more than 50% of those come from <1% of pixels, then it is considered to be noise-dominated and hence unusable.
| Quadrant | # 1 sec bins | Bins with >0 counts | Bins with >2000 counts | High rate bins dominated by noise | Noise dominated (total time) | Noise dominated (detector-on time) | Marked lightcurve |
|---|---|---|---|---|---|---|---|
| A | 7156 | 6062 | 0 | 0 | 0.00% | 0.00% | 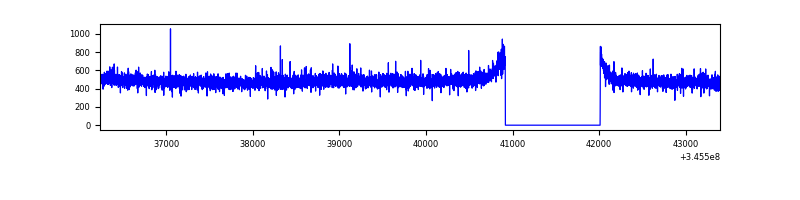 |
| B | 7157 | 6063 | 42 | 42 | 0.59% | 0.69% | 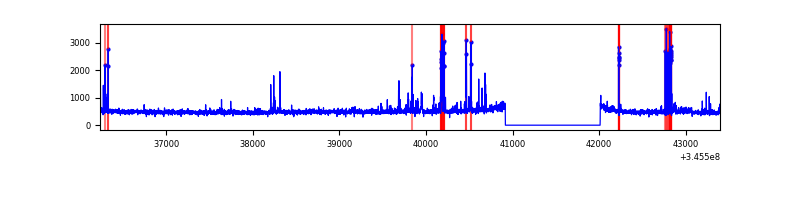 |
| C | 7157 | 6063 | 9 | 9 | 0.13% | 0.15% | 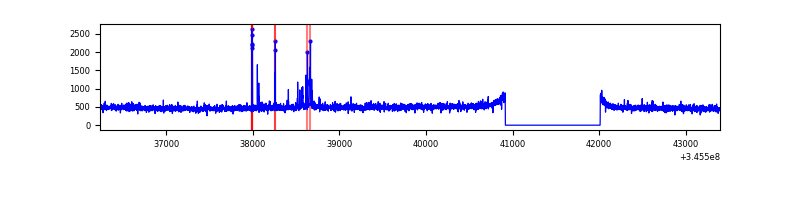 |
| D | 7156 | 6061 | 645 | 645 | 9.01% | 10.64% | 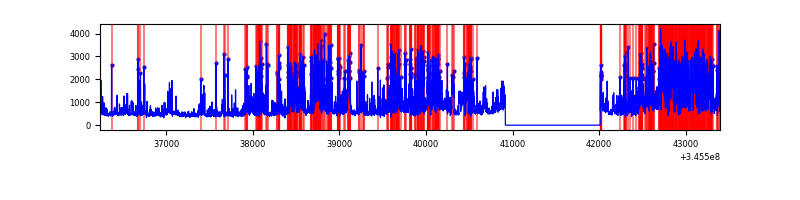 |
Top three noisy pixels from each quadrant. If the there are fewer than three noisy pixels in the level2.evt file, extra rows are filled as -1
| Pixel properties | Quadrant properties | ||||||
|---|---|---|---|---|---|---|---|
| Quadrant | DetID | PixID | Counts | Sigma | Mean | Median | Sigma |
| A | 13 | 254 | 9288 | 56.49 | 762 | 748 | 151.2 |
| A | 3 | 137 | 7168 | 42.46 | 762 | 748 | 151.2 |
| A | 0 | 226 | 6482 | 37.93 | 762 | 748 | 151.2 |
| B | 10 | 245 | 218612 | 1534.12 | 743 | 723 | 142.0 |
| B | 10 | 246 | 32473 | 223.55 | 743 | 723 | 142.0 |
| B | 12 | 111 | 17074 | 115.12 | 743 | 723 | 142.0 |
| C | 14 | 238 | 117564 | 707.61 | 711 | 715 | 165.1 |
| C | 3 | 233 | 110035 | 662.01 | 711 | 715 | 165.1 |
| C | 13 | 61 | 4860 | 25.1 | 711 | 715 | 165.1 |
| D | 1 | 52 | 1868857 | 11342.37 | 698 | 680 | 164.7 |
| D | 5 | 222 | 798272 | 4842.47 | 698 | 680 | 164.7 |
| D | 8 | 195 | 242324 | 1467.11 | 698 | 680 | 164.7 |
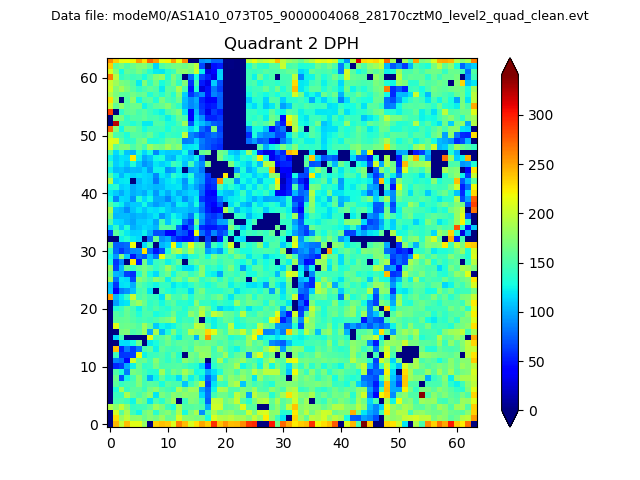
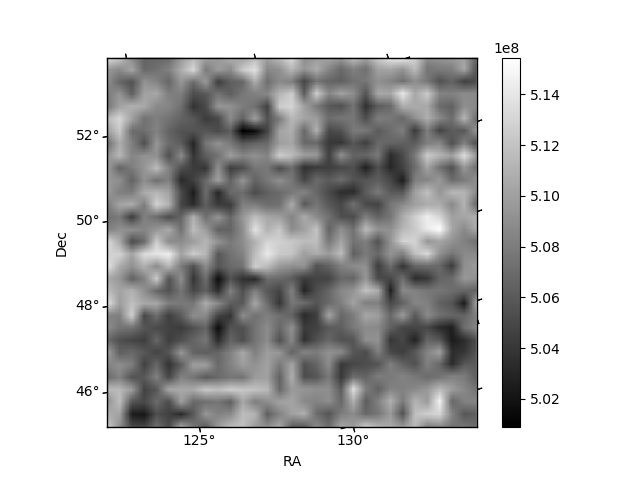
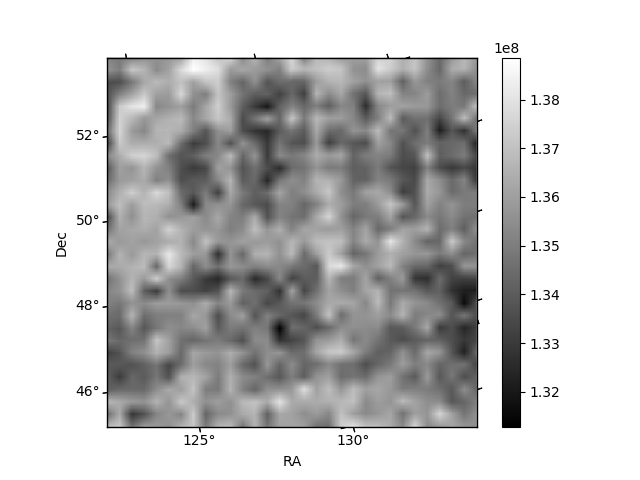
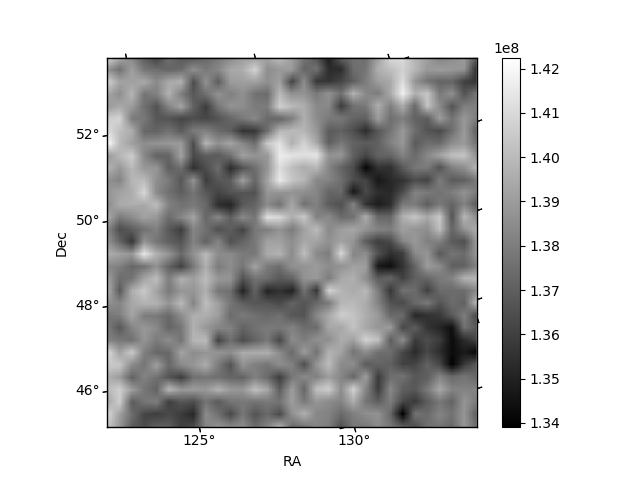
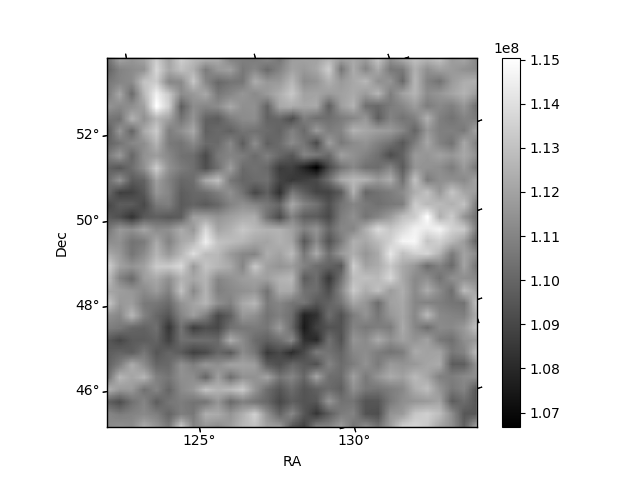
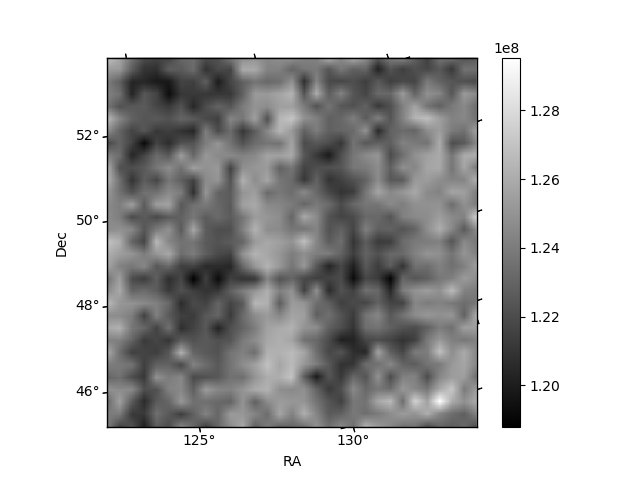
Histogram calculated using DETX and DETY for each event in the final _common_clean file
| Quadrant A | 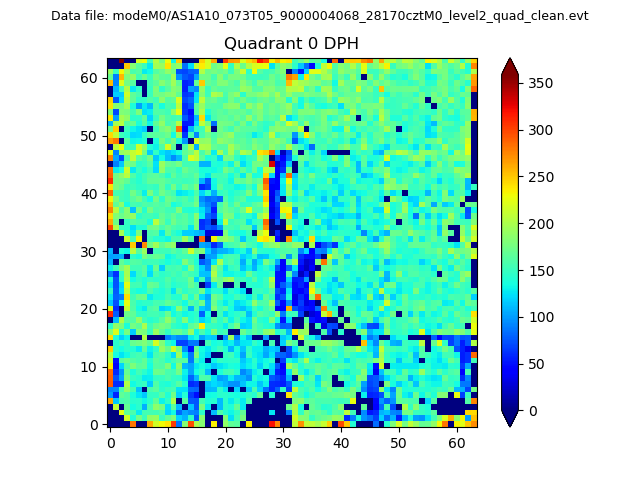 |
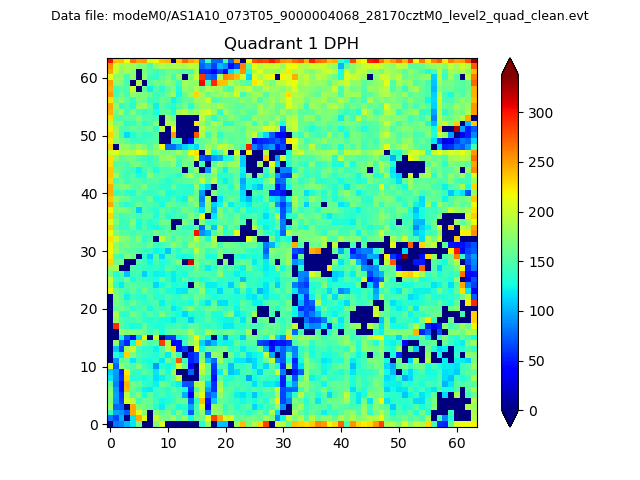 |
Quadrant B |
|---|---|---|---|
| Quadrant D | 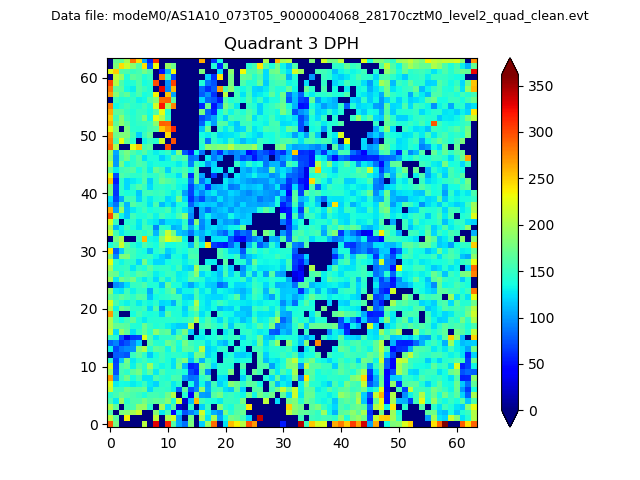 |
 |
Quadrant C |
| Plot type | Count rate plots | Images |
|---|---|---|
| Comparison with Poisson distribution Blue bars denote a histogram of data divided into 1 sec bins. Red curve is a Poisson curve with rate = median count rate of data. |
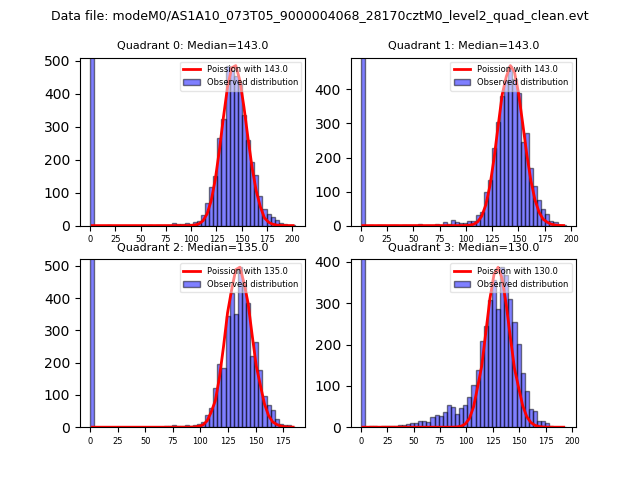 |
 |
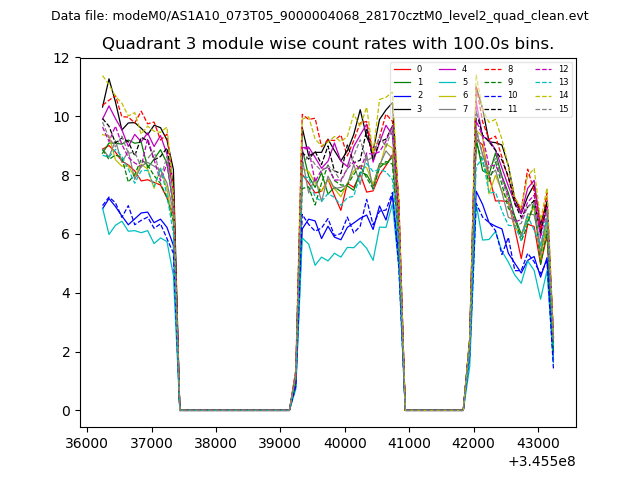
| Quadrant-wise count rates Data is divided into 100 sec bins |
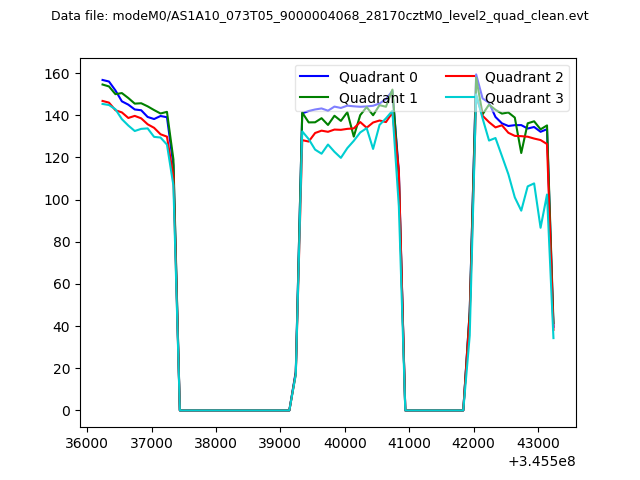 |
|
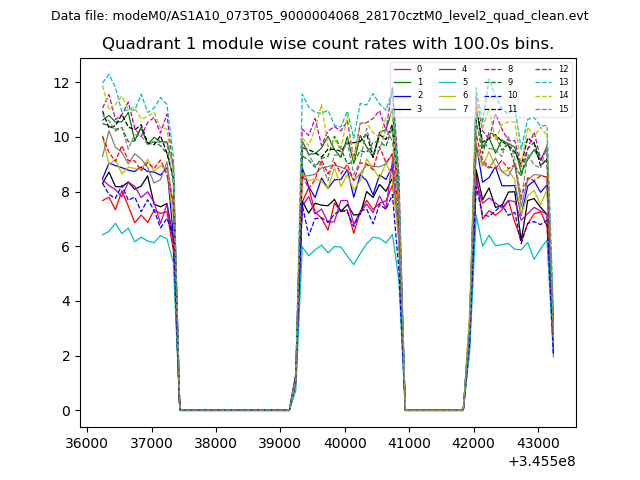
| Module-wise count rates for Quadrant A Data is divided into 100 sec bins |
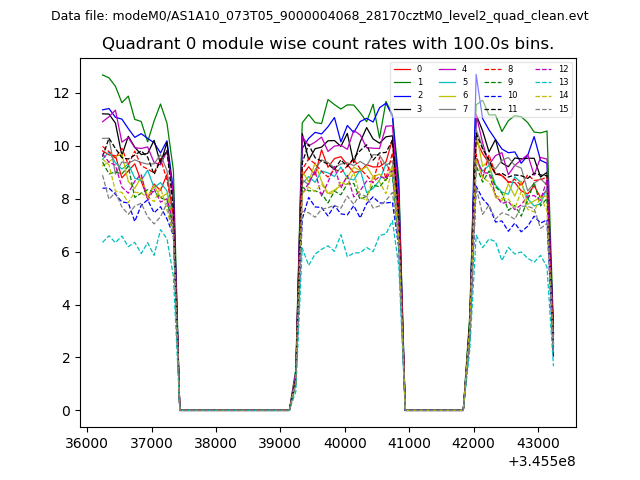 |
 |
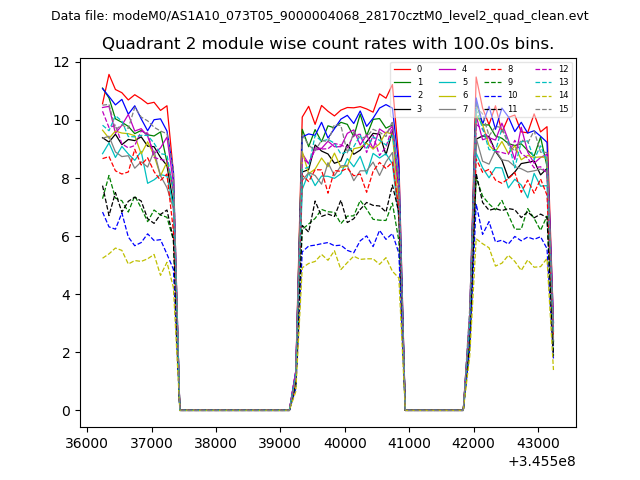
| Module-wise count rates for Quadrant B Data is divided into 100 sec bins |
 |
 |
| Module-wise count rates for Quadrant C Data is divided into 100 sec bins |
 |
 |
| Module-wise count rates for Quadrant D Data is divided into 100 sec bins |
 |
 |
| Parameter | Plot |
|---|---|
| CZT HV Monitor | 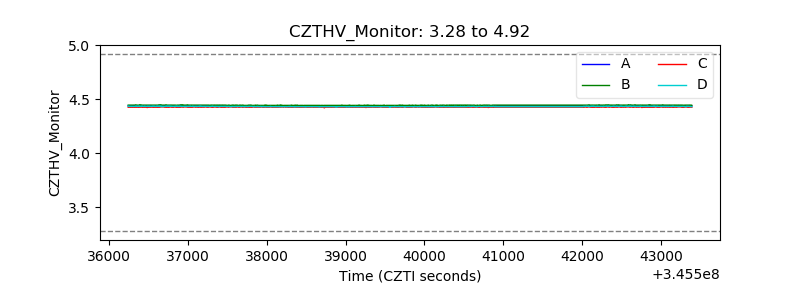 |
| D_VDD | 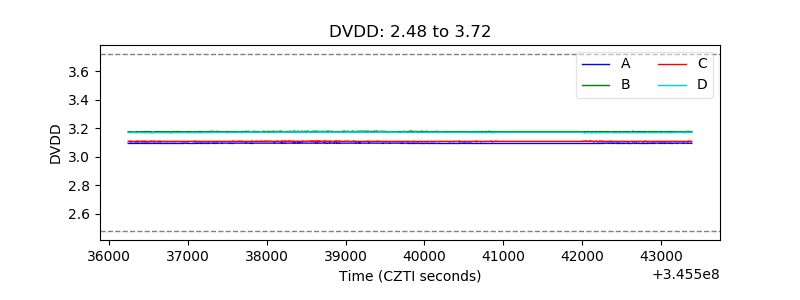 |
| Temperature 1 | 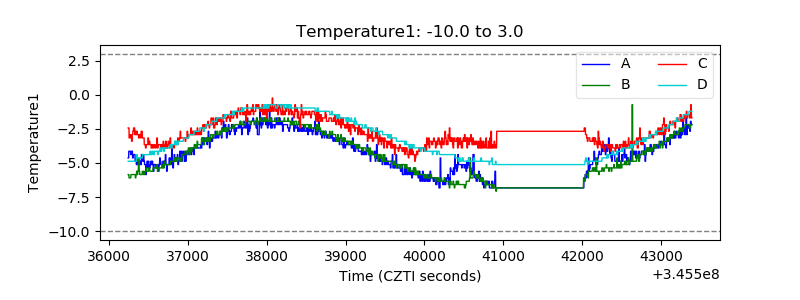 |
| Veto HV Monitor | 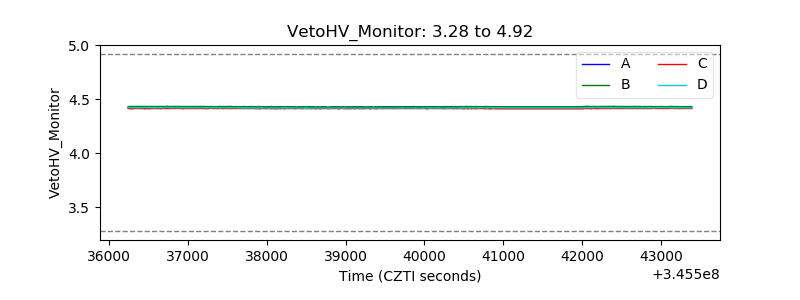 |
| Veto LLD | 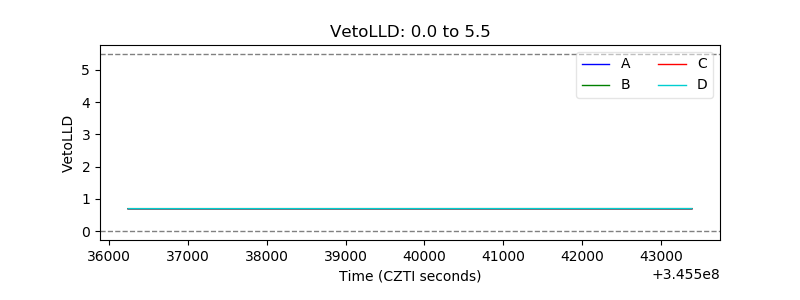 |
| Alpha Counter | 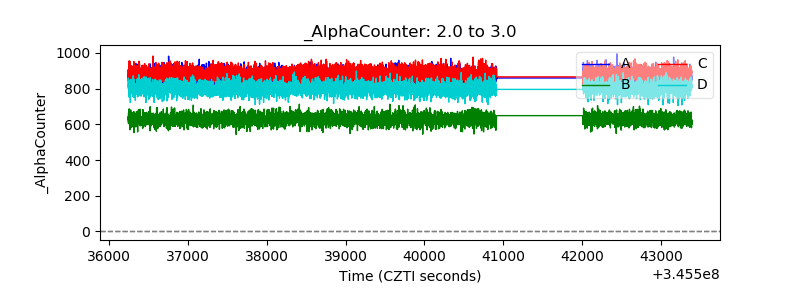 |
| _CPM_Rate | 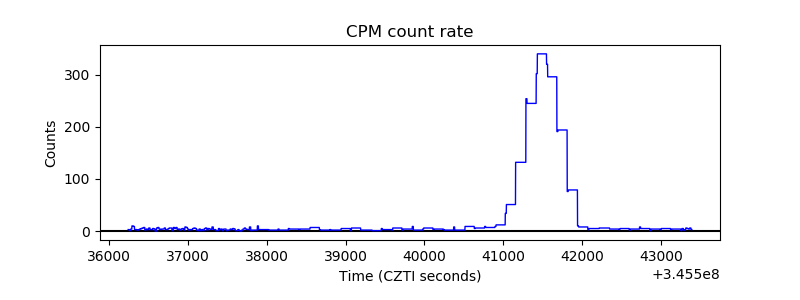 |
| CZT Counter | 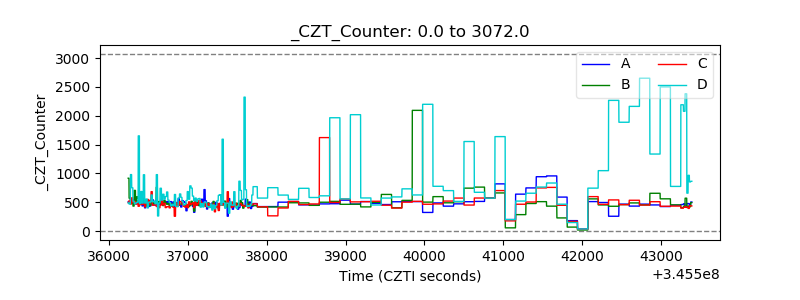 |
| +2.5 Volts monitor |  |
| +5 Volts monitor |  |
| _ROLL_ROT |  |
| _Roll_DEC | 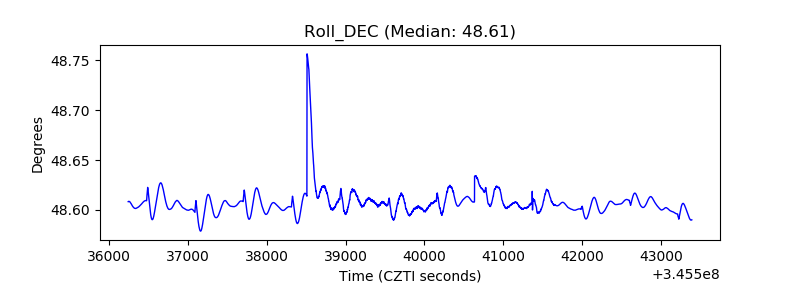 |
| _Roll_RA | 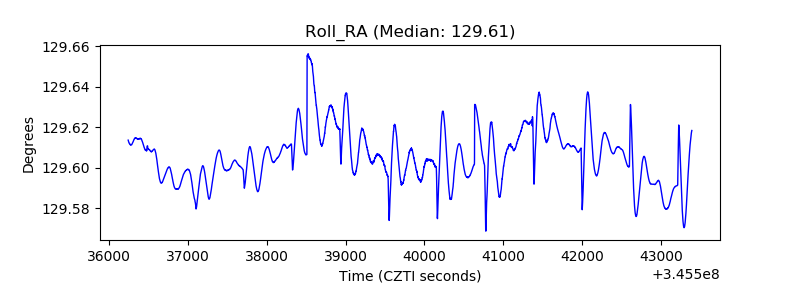 |
| Veto Counter | 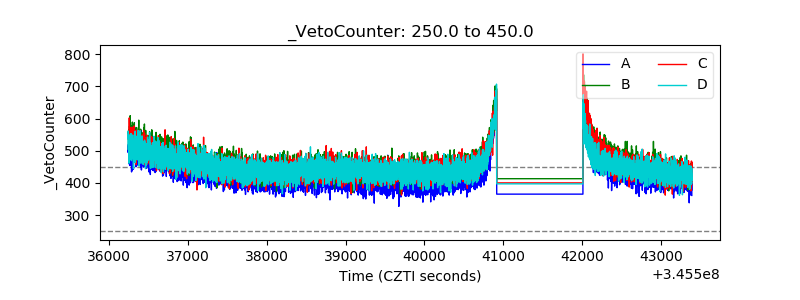 |