| Param | Original file | Final file |
|---|---|---|
| Filename | modeM0/AS1A10_073T05_9000004068_28171cztM0_level2.evt | modeM0/AS1A10_073T05_9000004068_28171cztM0_level2_quad_clean.evt |
| Size (bytes) | 536,152,320 | 82,010,880 |
| Size | 511.3 MB | 78.2 MB |
| Events in quadrant A | 2,982,716 | 534,522 |
| Events in quadrant B | 3,120,525 | 534,351 |
| Events in quadrant C | 3,013,957 | 510,376 |
| Events in quadrant D | 6,693,026 | 464,413 |
| Mode M0 | |||
|---|---|---|---|
| Quadrant | BADHDUFLAG | Total packets | Discarded packets |
| A | 0 | 12857 | 0 |
| B | 0 | 13272 | 0 |
| C | 0 | 12953 | 0 |
| D | 0 | 24197 | 0 |
| Mode M9 | |||
|---|---|---|---|
| Quadrant | BADHDUFLAG | Total packets | Discarded packets |
| A | 0 | 7 | 0 |
| B | 0 | 7 | 0 |
| C | 0 | 7 | 0 |
| D | 0 | 7 | 0 |
| Quadrant | Total seconds | Saturated seconds | Saturation percentage |
|---|---|---|---|
| A | 6295 | 104 | 1.652105% |
| B | 6296 | 142 | 2.255400% |
| C | 6296 | 109 | 1.731258% |
| D | 6296 | 1028 | 16.327827% |
Noise dominated data is calculated using 1-second bins in cleaned event files. If a bin has >2000 counts, and if more than 50% of those come from <1% of pixels, then it is considered to be noise-dominated and hence unusable.
| Quadrant | # 1 sec bins | Bins with >0 counts | Bins with >2000 counts | High rate bins dominated by noise | Noise dominated (total time) | Noise dominated (detector-on time) | Marked lightcurve |
|---|---|---|---|---|---|---|---|
| A | 7015 | 6295 | 0 | 0 | 0.00% | 0.00% | 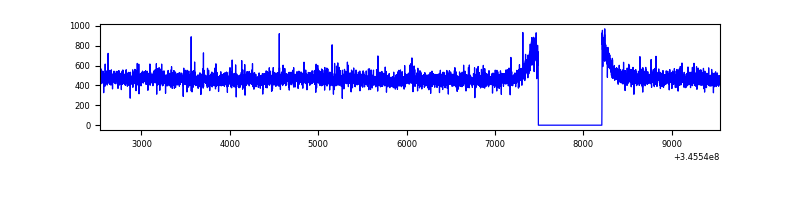 |
| B | 7016 | 6296 | 32 | 32 | 0.46% | 0.51% |  |
| C | 7016 | 6296 | 0 | 0 | 0.00% | 0.00% | 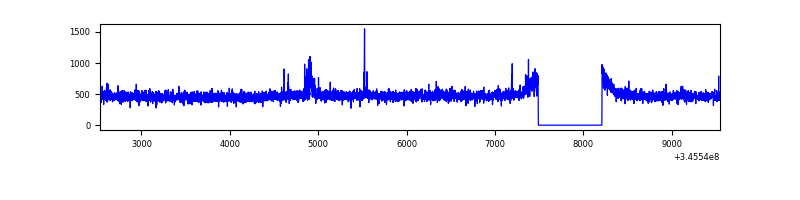 |
| D | 7015 | 6295 | 872 | 872 | 12.43% | 13.85% | 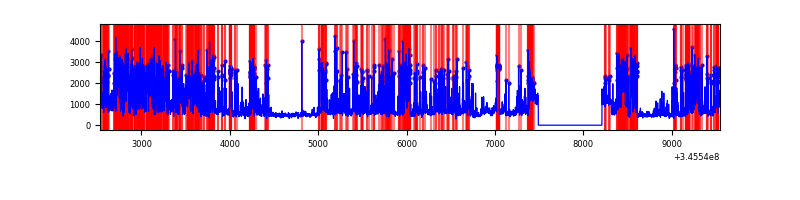 |
Top three noisy pixels from each quadrant. If the there are fewer than three noisy pixels in the level2.evt file, extra rows are filled as -1
| Pixel properties | Quadrant properties | ||||||
|---|---|---|---|---|---|---|---|
| Quadrant | DetID | PixID | Counts | Sigma | Mean | Median | Sigma |
| A | 13 | 254 | 10193 | 61.0 | 772 | 757 | 154.7 |
| A | 3 | 137 | 7523 | 43.74 | 772 | 757 | 154.7 |
| A | 0 | 226 | 6646 | 38.07 | 772 | 757 | 154.7 |
| B | 10 | 245 | 117459 | 808.26 | 755 | 735 | 144.4 |
| B | 12 | 111 | 17572 | 116.59 | 755 | 735 | 144.4 |
| B | 11 | 111 | 15987 | 105.61 | 755 | 735 | 144.4 |
| C | 14 | 238 | 118765 | 696.02 | 727 | 730 | 169.6 |
| C | 3 | 233 | 57707 | 335.97 | 727 | 730 | 169.6 |
| C | 13 | 61 | 4931 | 24.77 | 727 | 730 | 169.6 |
| D | 1 | 52 | 2377616 | 14411.61 | 697 | 677 | 164.9 |
| D | 5 | 222 | 712669 | 4316.88 | 697 | 677 | 164.9 |
| D | 8 | 195 | 542275 | 3283.76 | 697 | 677 | 164.9 |
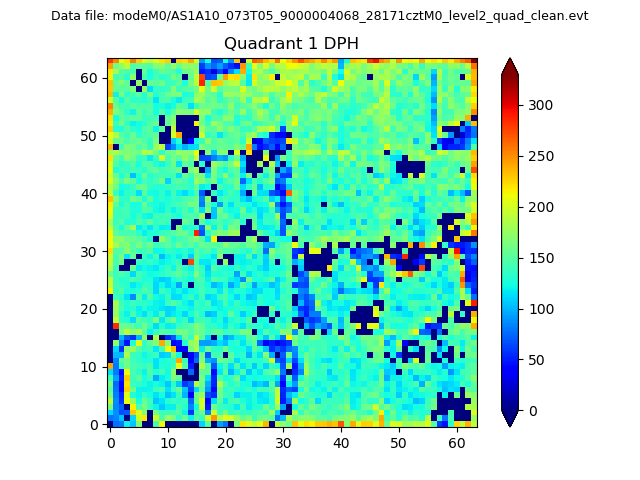
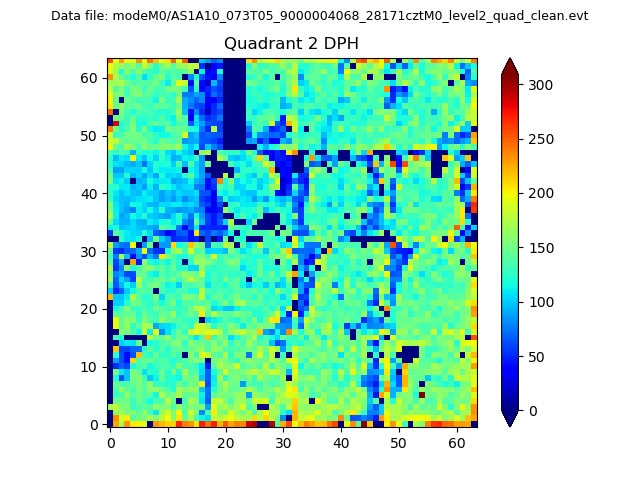
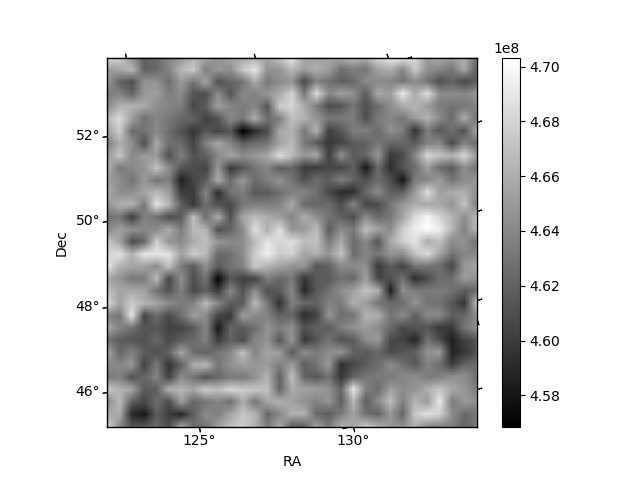
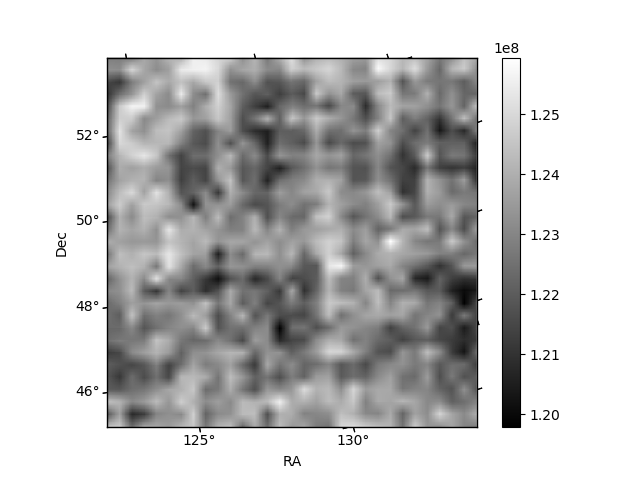
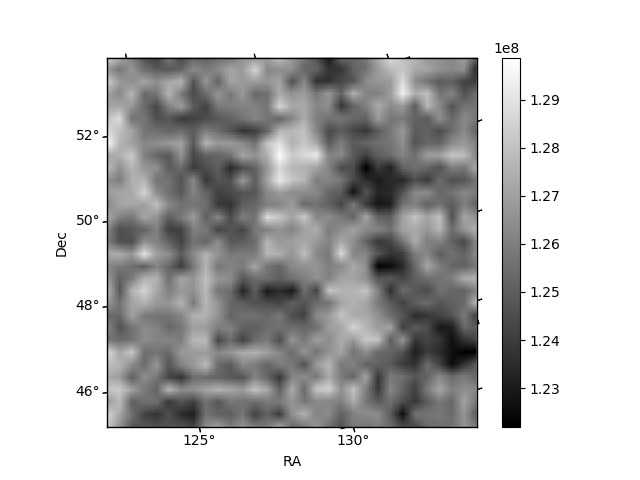
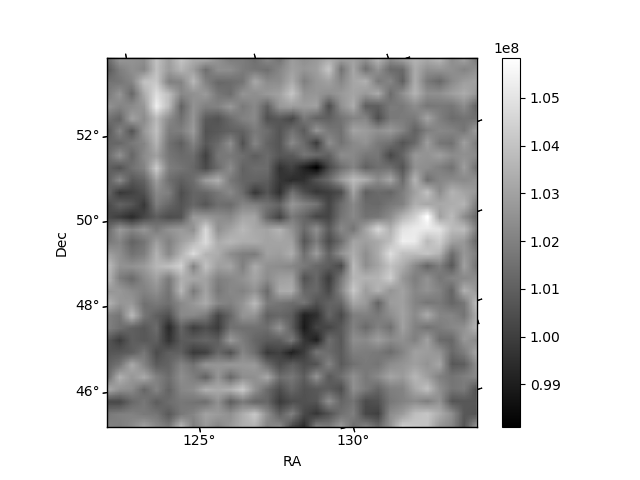
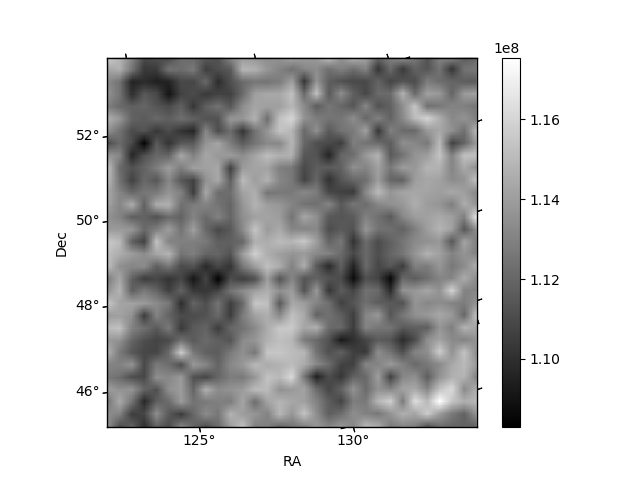
Histogram calculated using DETX and DETY for each event in the final _common_clean file
| Quadrant A | 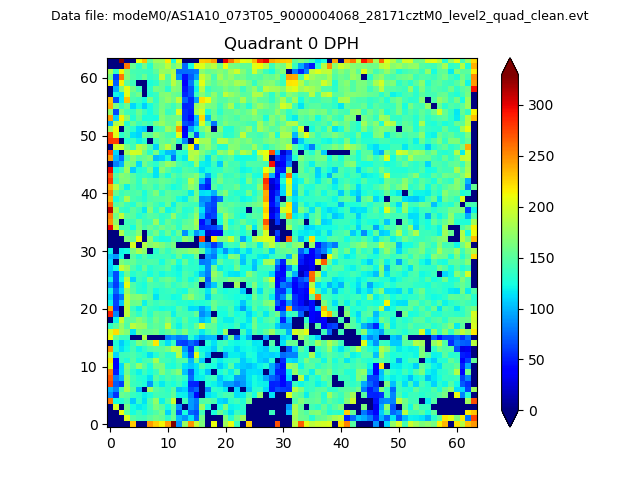 |
 |
Quadrant B |
|---|---|---|---|
| Quadrant D | 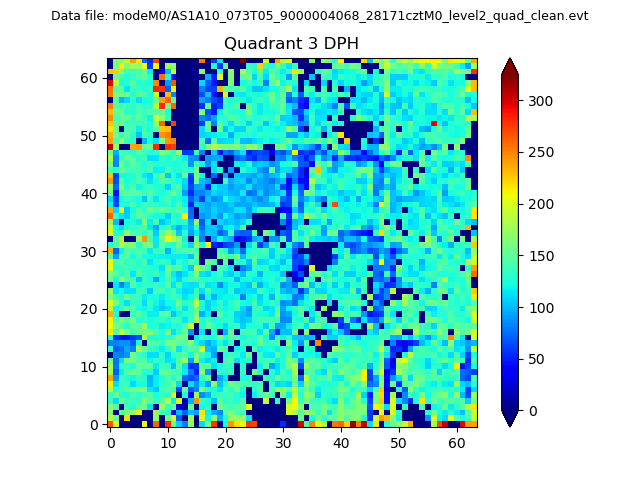 |
 |
Quadrant C |
| Plot type | Count rate plots | Images |
|---|---|---|
| Comparison with Poisson distribution Blue bars denote a histogram of data divided into 1 sec bins. Red curve is a Poisson curve with rate = median count rate of data. |
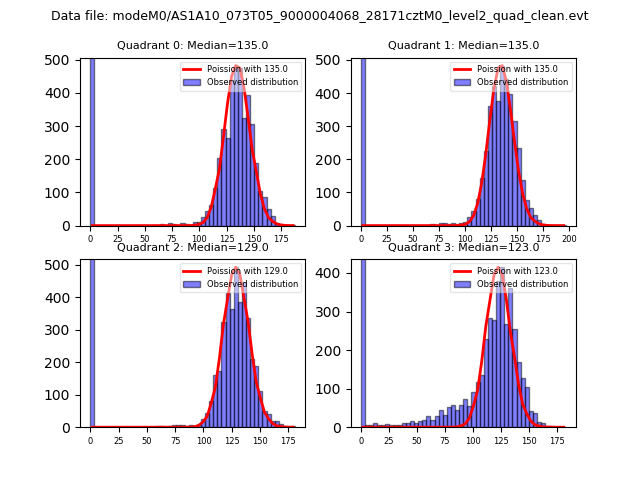 |
 |
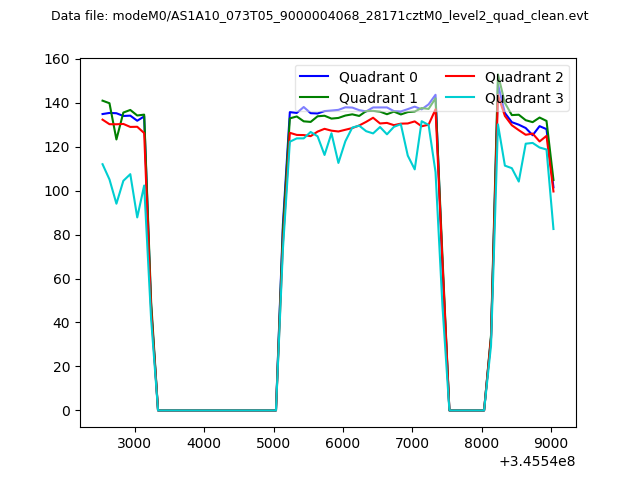
| Quadrant-wise count rates Data is divided into 100 sec bins |
 |
|
| Module-wise count rates for Quadrant A Data is divided into 100 sec bins |
 |
 |
| Module-wise count rates for Quadrant B Data is divided into 100 sec bins |
 |
 |
| Module-wise count rates for Quadrant C Data is divided into 100 sec bins |
 |
 |
| Module-wise count rates for Quadrant D Data is divided into 100 sec bins |
 |
 |
| Parameter | Plot |
|---|---|
| CZT HV Monitor | 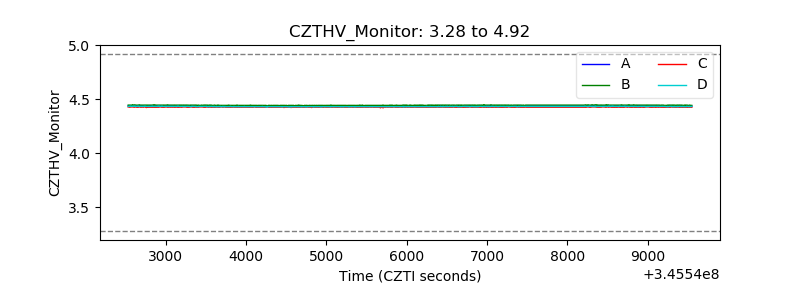 |
| D_VDD |  |
| Temperature 1 | 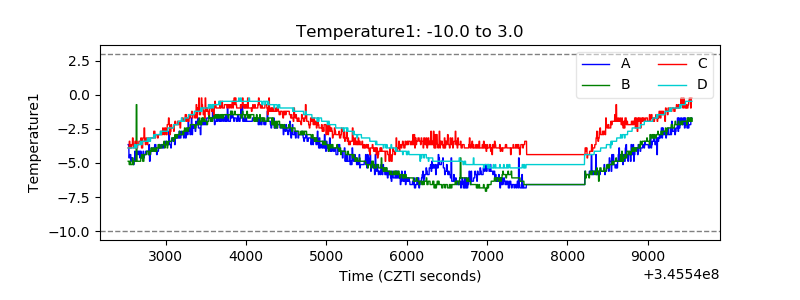 |
| Veto HV Monitor | 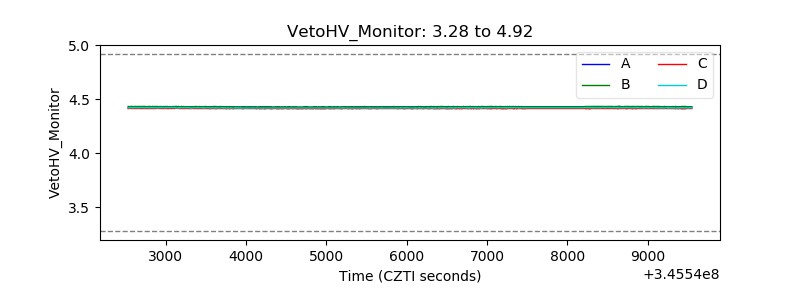 |
| Veto LLD | 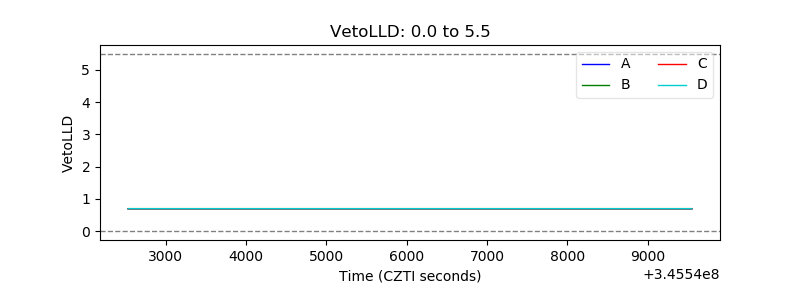 |
| Alpha Counter | 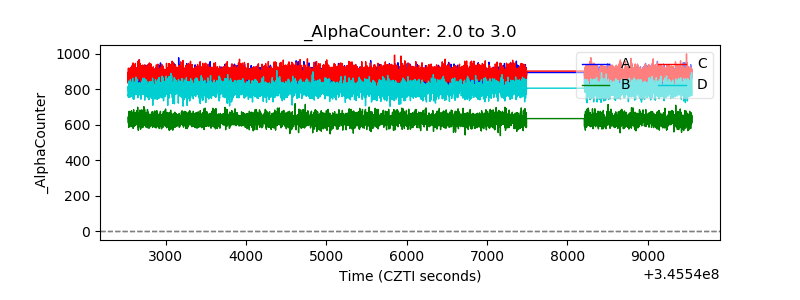 |
| _CPM_Rate | 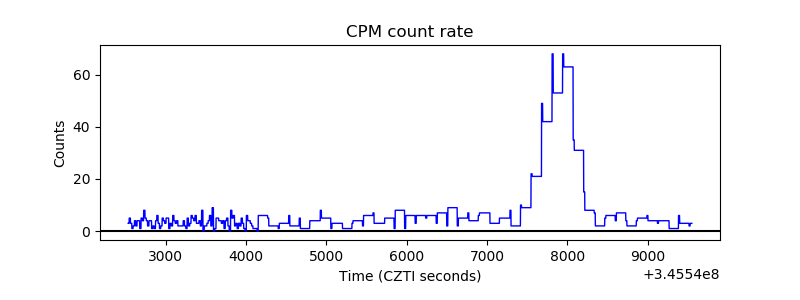 |
| CZT Counter | 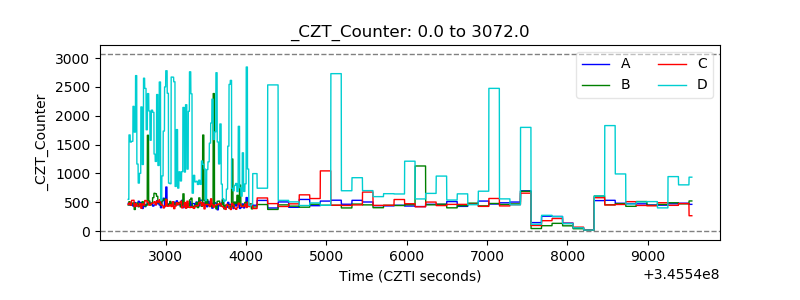 |
| +2.5 Volts monitor |  |
| +5 Volts monitor | 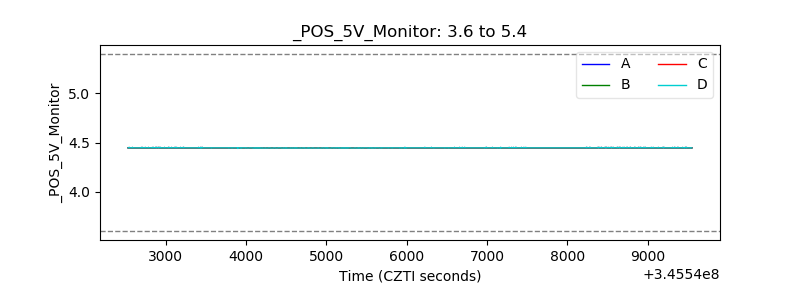 |
| _ROLL_ROT | 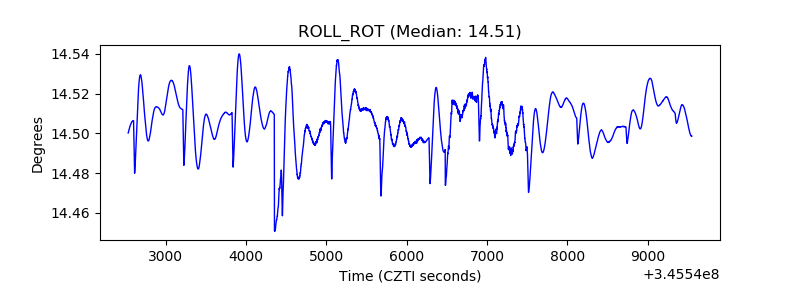 |
| _Roll_DEC | 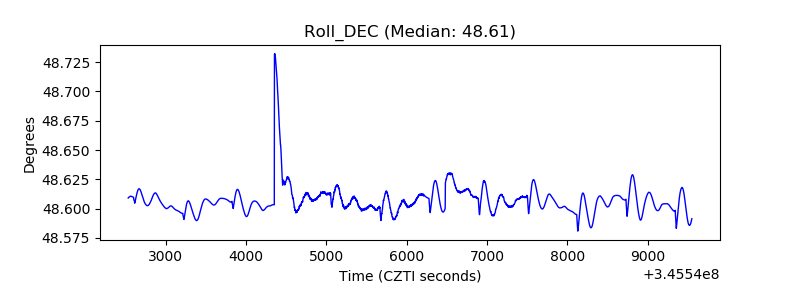 |
| _Roll_RA | 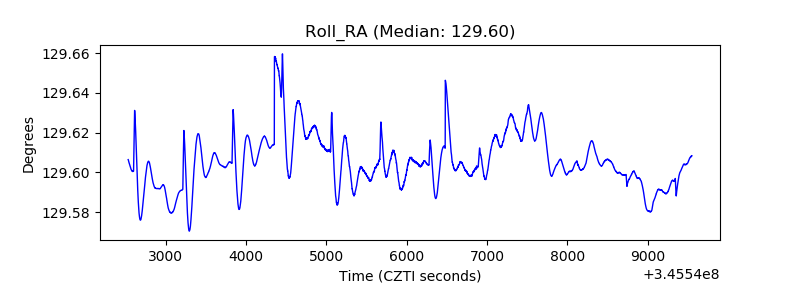 |
| Veto Counter | 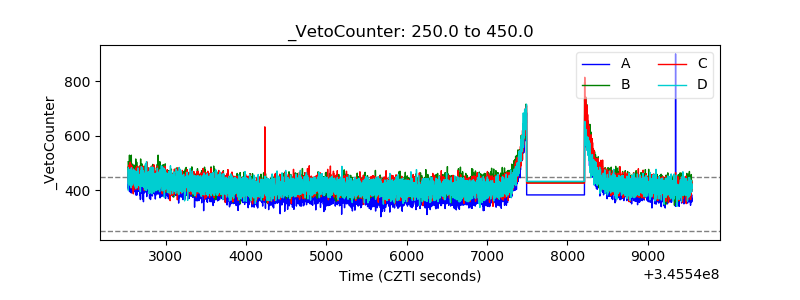 |