| Param | Original file | Final file |
|---|---|---|
| Filename | modeM0/AS1A10_073T05_9000004068_28172cztM0_level2.evt | modeM0/AS1A10_073T05_9000004068_28172cztM0_level2_quad_clean.evt |
| Size (bytes) | 591,716,160 | 92,770,560 |
| Size | 564.3 MB | 88.5 MB |
| Events in quadrant A | 3,444,605 | 598,845 |
| Events in quadrant B | 3,638,575 | 595,206 |
| Events in quadrant C | 3,601,229 | 568,328 |
| Events in quadrant D | 6,746,184 | 544,121 |
| Mode M0 | |||
|---|---|---|---|
| Quadrant | BADHDUFLAG | Total packets | Discarded packets |
| A | 0 | 14901 | 0 |
| B | 0 | 15465 | 0 |
| C | 0 | 15227 | 0 |
| D | 0 | 24922 | 0 |
| Mode M9 | |||
|---|---|---|---|
| Quadrant | BADHDUFLAG | Total packets | Discarded packets |
| A | 0 | 5 | 0 |
| B | 0 | 5 | 0 |
| C | 0 | 5 | 0 |
| D | 0 | 5 | 0 |
| Quadrant | Total seconds | Saturated seconds | Saturation percentage |
|---|---|---|---|
| A | 7216 | 162 | 2.245011% |
| B | 7203 | 195 | 2.707205% |
| C | 7204 | 221 | 3.067740% |
| D | 7192 | 877 | 12.194105% |
Noise dominated data is calculated using 1-second bins in cleaned event files. If a bin has >2000 counts, and if more than 50% of those come from <1% of pixels, then it is considered to be noise-dominated and hence unusable.
| Quadrant | # 1 sec bins | Bins with >0 counts | Bins with >2000 counts | High rate bins dominated by noise | Noise dominated (total time) | Noise dominated (detector-on time) | Marked lightcurve |
|---|---|---|---|---|---|---|---|
| A | 7789 | 7277 | 0 | 0 | 0.00% | 0.00% | 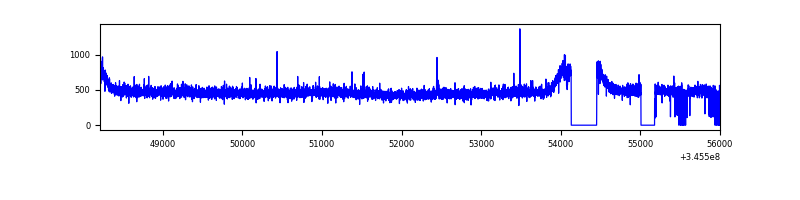 |
| B | 7789 | 7268 | 17 | 17 | 0.22% | 0.23% | 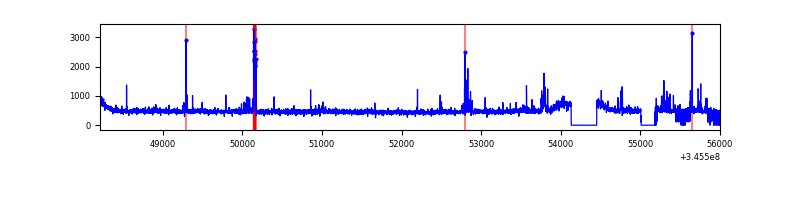 |
| C | 7789 | 7266 | 13 | 13 | 0.17% | 0.18% | 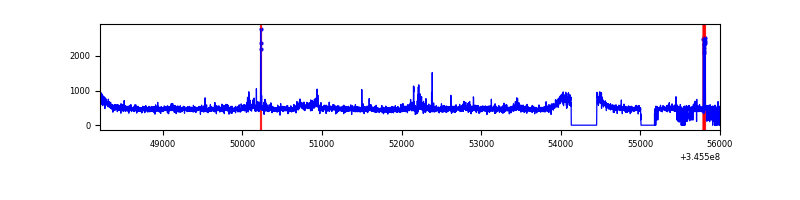 |
| D | 7786 | 7271 | 658 | 658 | 8.45% | 9.05% | 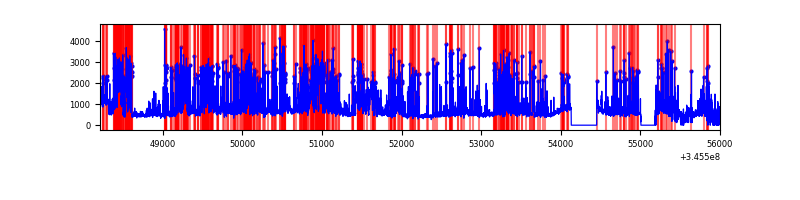 |
Top three noisy pixels from each quadrant. If the there are fewer than three noisy pixels in the level2.evt file, extra rows are filled as -1
| Pixel properties | Quadrant properties | ||||||
|---|---|---|---|---|---|---|---|
| Quadrant | DetID | PixID | Counts | Sigma | Mean | Median | Sigma |
| A | 13 | 254 | 11585 | 60.24 | 888 | 867 | 177.9 |
| A | 12 | 16 | 9422 | 48.08 | 888 | 867 | 177.9 |
| A | 3 | 137 | 8822 | 44.71 | 888 | 867 | 177.9 |
| B | 10 | 245 | 159444 | 948.28 | 869 | 848 | 167.2 |
| B | 12 | 111 | 20882 | 119.79 | 869 | 848 | 167.2 |
| B | 0 | 230 | 19163 | 109.51 | 869 | 848 | 167.2 |
| C | 3 | 233 | 209123 | 1066.25 | 834 | 838 | 195.3 |
| C | 14 | 238 | 134688 | 685.2 | 834 | 838 | 195.3 |
| C | 13 | 61 | 5793 | 25.37 | 834 | 838 | 195.3 |
| D | 1 | 52 | 2213536 | 11371.08 | 819 | 797 | 194.6 |
| D | 8 | 195 | 834774 | 4285.74 | 819 | 797 | 194.6 |
| D | 2 | 250 | 374788 | 1921.91 | 819 | 797 | 194.6 |
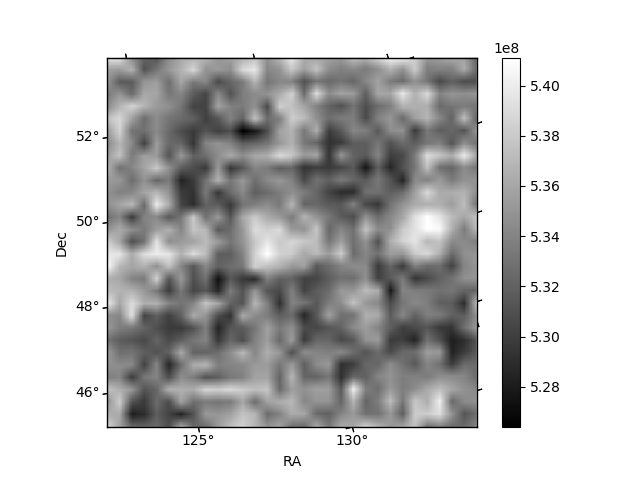
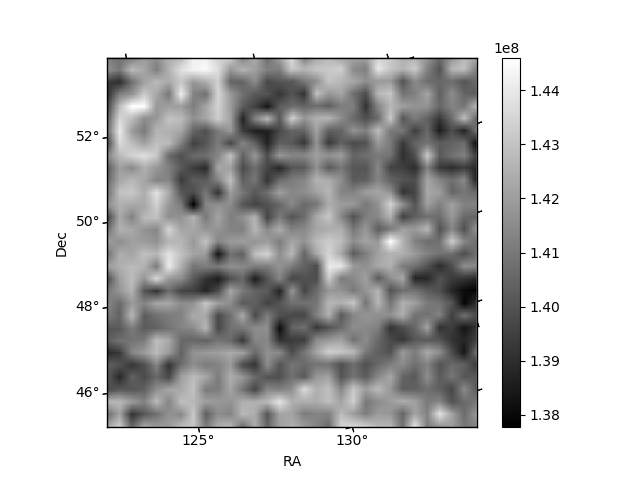
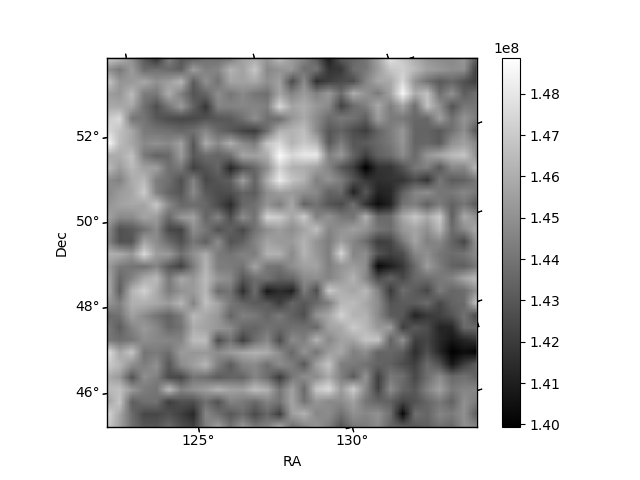
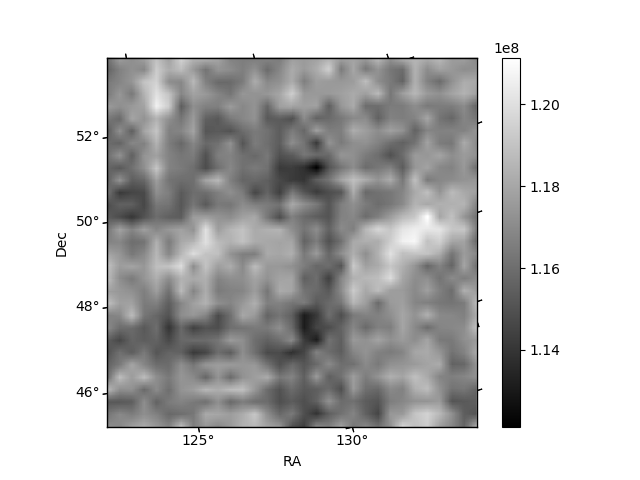
Histogram calculated using DETX and DETY for each event in the final _common_clean file
| Quadrant A | 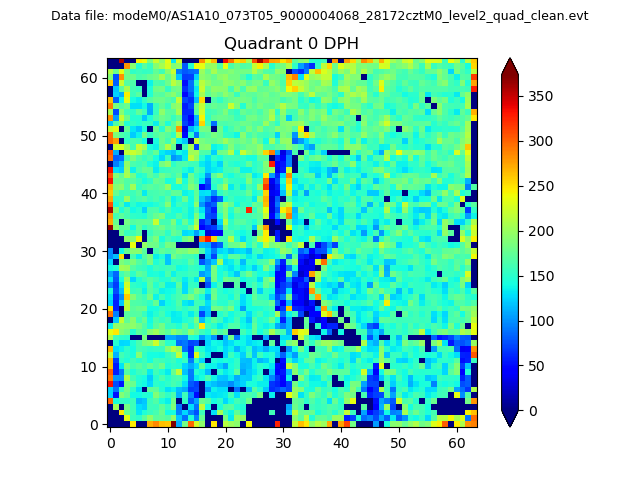 |
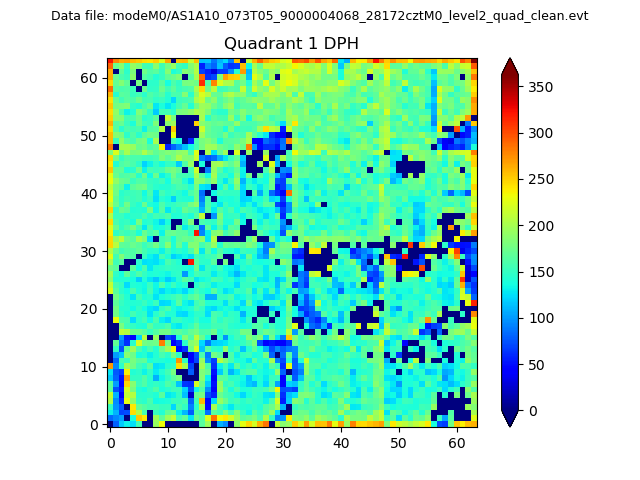 |
Quadrant B |
|---|---|---|---|
| Quadrant D |  |
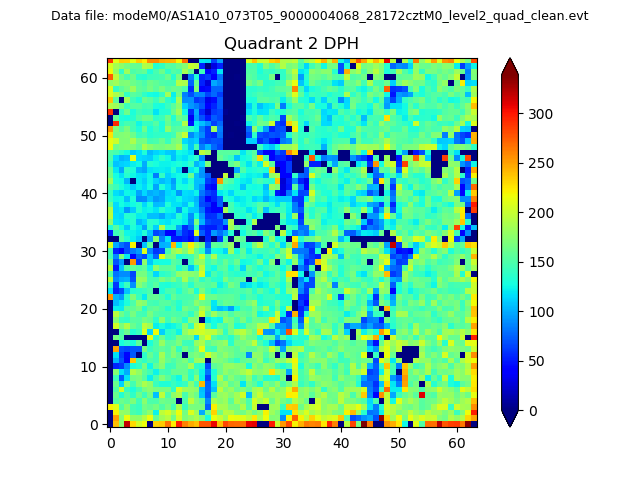 |
Quadrant C |
| Plot type | Count rate plots | Images |
|---|---|---|
| Comparison with Poisson distribution Blue bars denote a histogram of data divided into 1 sec bins. Red curve is a Poisson curve with rate = median count rate of data. |
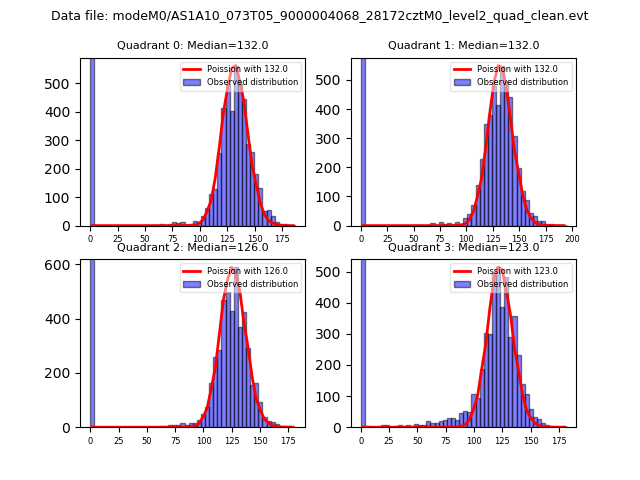 |
 |
| Quadrant-wise count rates Data is divided into 100 sec bins |
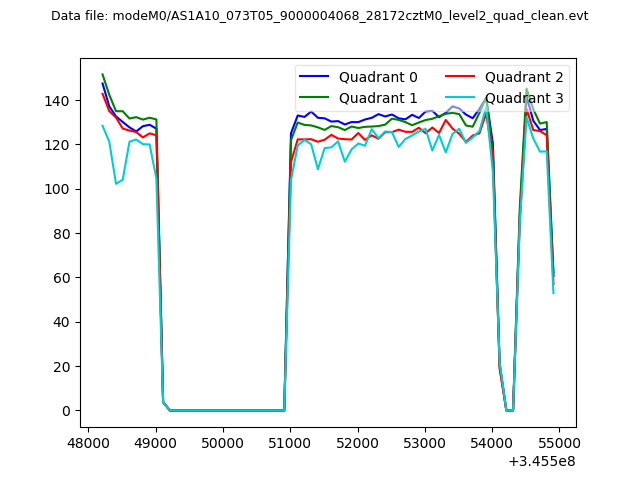 |
|
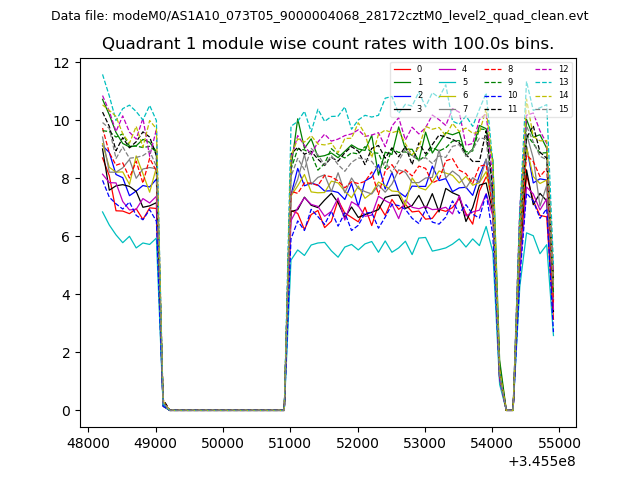
| Module-wise count rates for Quadrant A Data is divided into 100 sec bins |
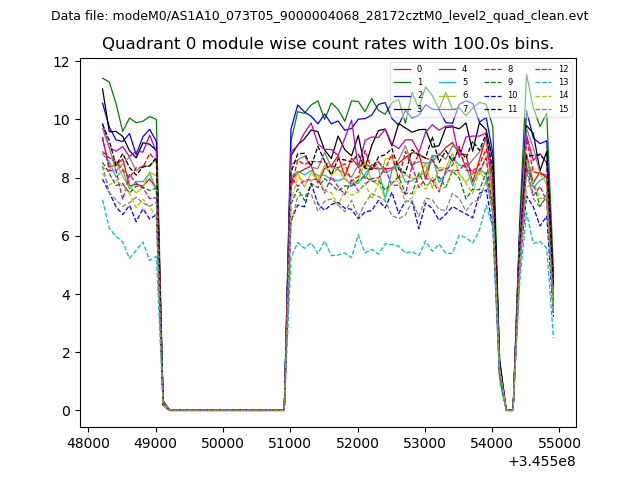 |
 |
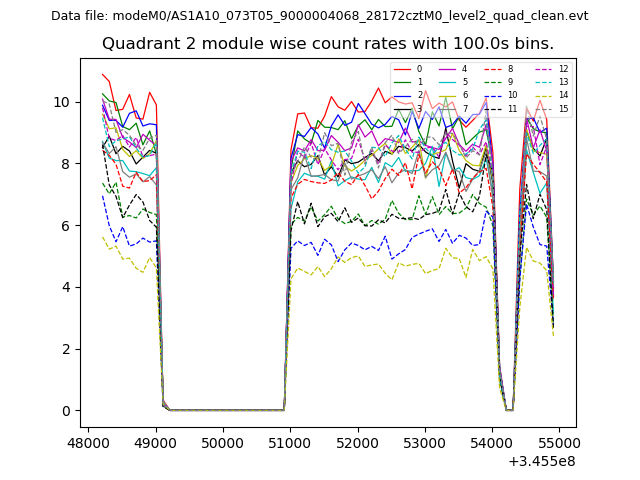
| Module-wise count rates for Quadrant B Data is divided into 100 sec bins |
 |
 |
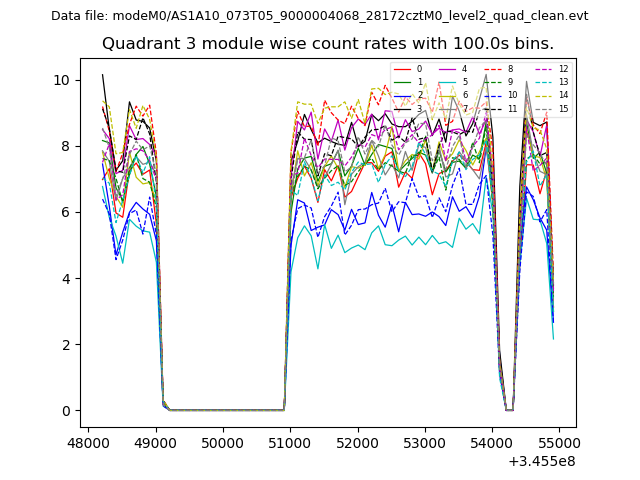
| Module-wise count rates for Quadrant C Data is divided into 100 sec bins |
 |
 |
| Module-wise count rates for Quadrant D Data is divided into 100 sec bins |
 |
 |
| Parameter | Plot |
|---|---|
| CZT HV Monitor | 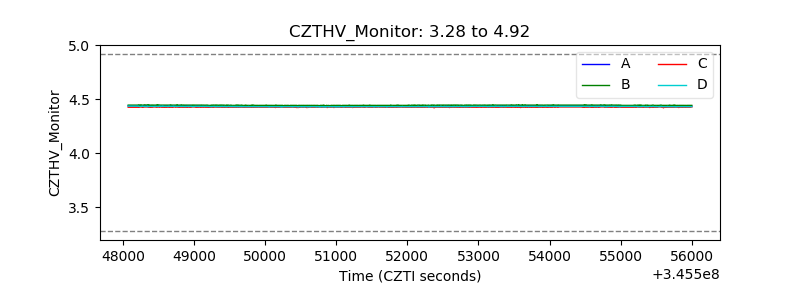 |
| D_VDD | 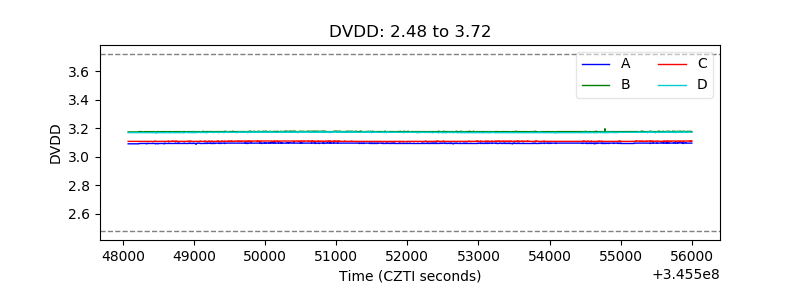 |
| Temperature 1 | 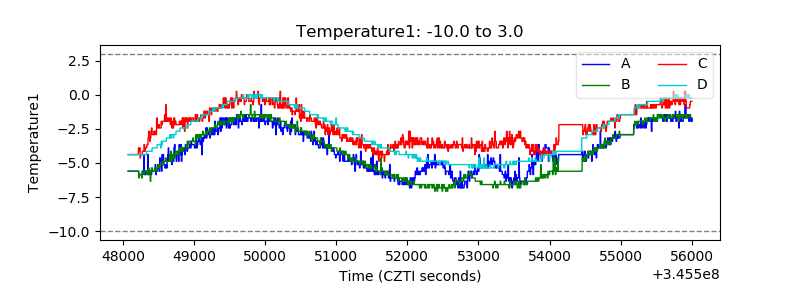 |
| Veto HV Monitor | 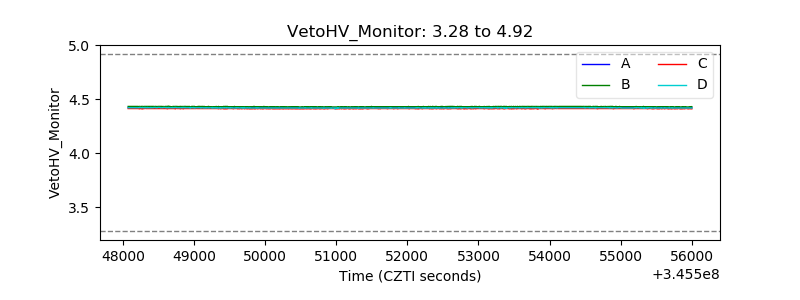 |
| Veto LLD | 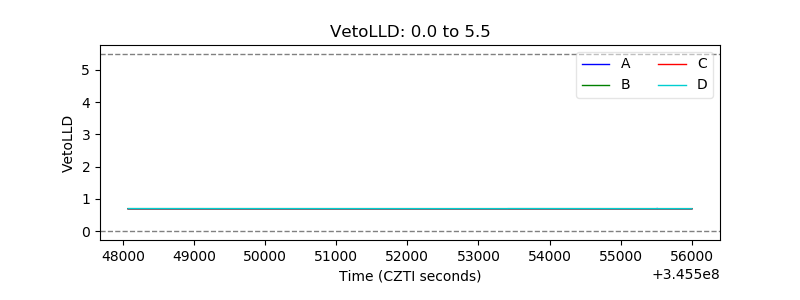 |
| Alpha Counter | 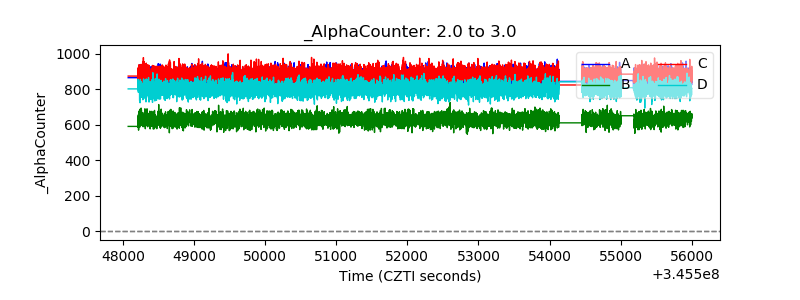 |
| _CPM_Rate | 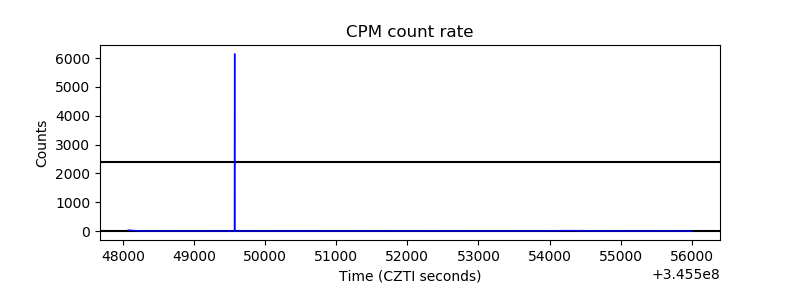 |
| CZT Counter | 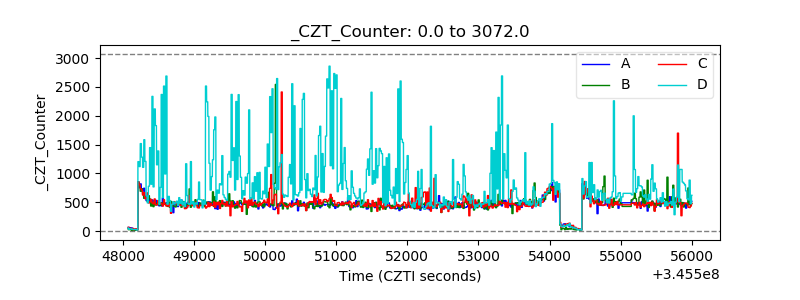 |
| +2.5 Volts monitor |  |
| +5 Volts monitor |  |
| _ROLL_ROT | 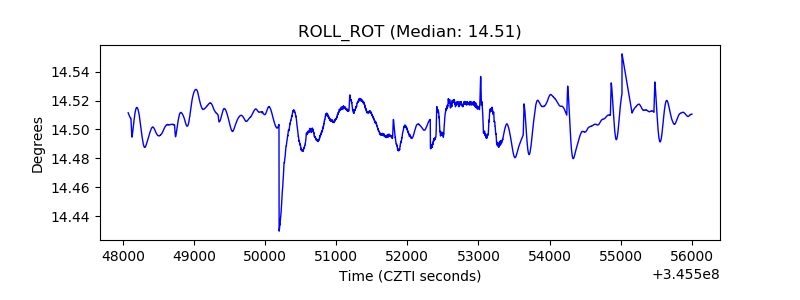 |
| _Roll_DEC | 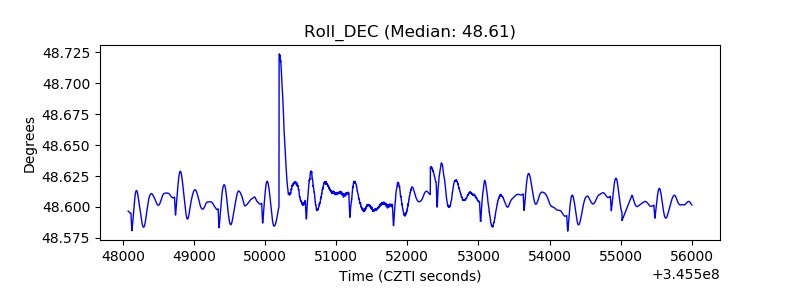 |
| _Roll_RA | 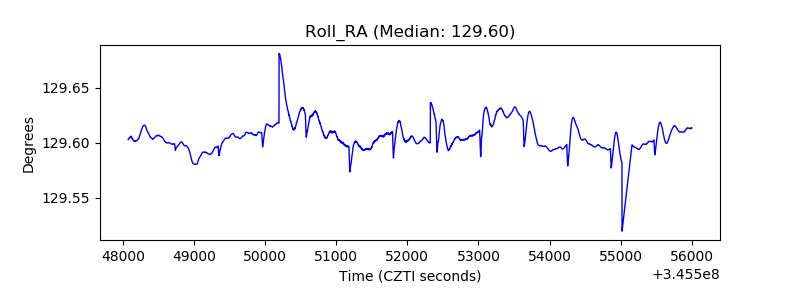 |
| Veto Counter | 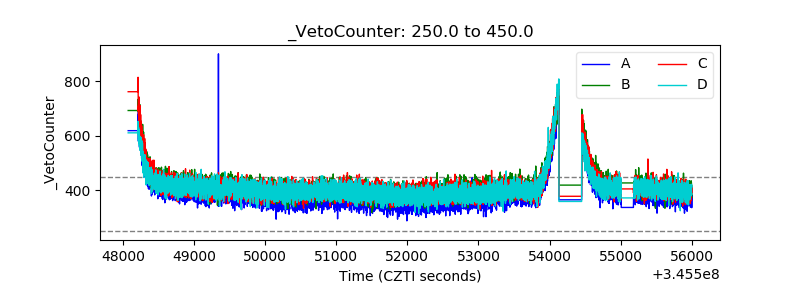 |