| Param | Original file | Final file |
|---|---|---|
| Filename | modeM0/AS1A10_073T05_9000004068_28173cztM0_level2.evt | modeM0/AS1A10_073T05_9000004068_28173cztM0_level2_quad_clean.evt |
| Size (bytes) | 647,902,080 | 86,137,920 |
| Size | 617.9 MB | 82.1 MB |
| Events in quadrant A | 3,688,744 | 541,962 |
| Events in quadrant B | 4,917,034 | 531,149 |
| Events in quadrant C | 3,793,323 | 511,236 |
| Events in quadrant D | 6,705,418 | 492,498 |
| Mode M0 | |||
|---|---|---|---|
| Quadrant | BADHDUFLAG | Total packets | Discarded packets |
| A | 0 | 15862 | 0 |
| B | 0 | 19524 | 0 |
| C | 0 | 16037 | 0 |
| D | 0 | 25136 | 0 |
| Mode M9 | |||
|---|---|---|---|
| Quadrant | BADHDUFLAG | Total packets | Discarded packets |
| A | 0 | 2 | 0 |
| B | 0 | 2 | 0 |
| C | 0 | 2 | 0 |
| D | 0 | 2 | 0 |
| Quadrant | Total seconds | Saturated seconds | Saturation percentage |
|---|---|---|---|
| A | 7632 | 133 | 1.742662% |
| B | 7633 | 422 | 5.528626% |
| C | 7633 | 207 | 2.711909% |
| D | 7633 | 777 | 10.179484% |
Noise dominated data is calculated using 1-second bins in cleaned event files. If a bin has >2000 counts, and if more than 50% of those come from <1% of pixels, then it is considered to be noise-dominated and hence unusable.
| Quadrant | # 1 sec bins | Bins with >0 counts | Bins with >2000 counts | High rate bins dominated by noise | Noise dominated (total time) | Noise dominated (detector-on time) | Marked lightcurve |
|---|---|---|---|---|---|---|---|
| A | 7852 | 7632 | 0 | 0 | 0.00% | 0.00% | 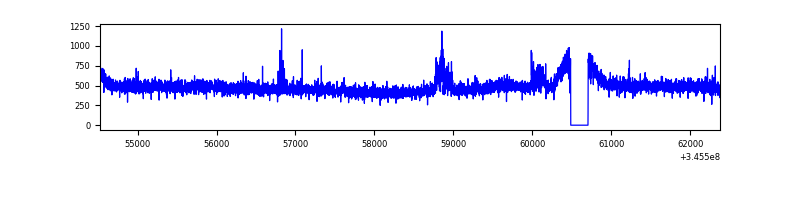 |
| B | 7853 | 7633 | 187 | 187 | 2.38% | 2.45% |  |
| C | 7853 | 7633 | 18 | 18 | 0.23% | 0.24% | 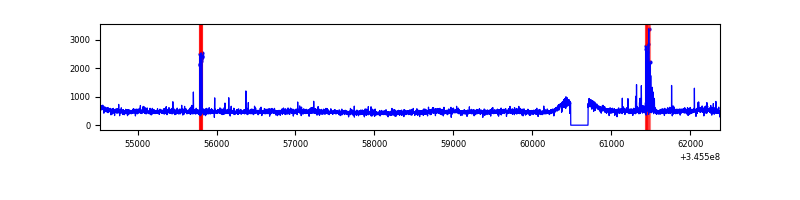 |
| D | 7853 | 7634 | 555 | 555 | 7.07% | 7.27% | 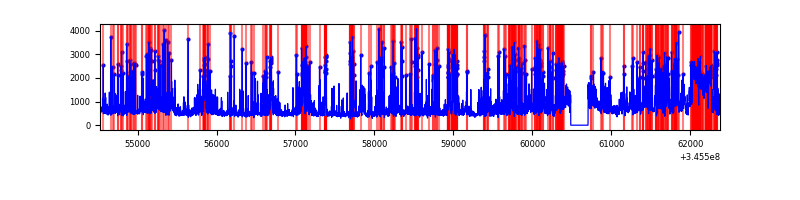 |
Top three noisy pixels from each quadrant. If the there are fewer than three noisy pixels in the level2.evt file, extra rows are filled as -1
| Pixel properties | Quadrant properties | ||||||
|---|---|---|---|---|---|---|---|
| Quadrant | DetID | PixID | Counts | Sigma | Mean | Median | Sigma |
| A | 6 | 16 | 60424 | 317.93 | 935 | 915 | 187.2 |
| A | 12 | 16 | 14203 | 70.99 | 935 | 915 | 187.2 |
| A | 13 | 254 | 12621 | 62.54 | 935 | 915 | 187.2 |
| B | 10 | 245 | 1103948 | 6367.2 | 904 | 880 | 173.2 |
| B | 10 | 246 | 164023 | 941.7 | 904 | 880 | 173.2 |
| B | 0 | 230 | 29006 | 162.35 | 904 | 880 | 173.2 |
| C | 3 | 233 | 154462 | 751.59 | 878 | 882 | 204.3 |
| C | 14 | 238 | 140801 | 684.73 | 878 | 882 | 204.3 |
| C | 15 | 208 | 68611 | 331.45 | 878 | 882 | 204.3 |
| D | 1 | 52 | 1826999 | 8809.48 | 871 | 846 | 207.3 |
| D | 8 | 195 | 651448 | 3138.55 | 871 | 846 | 207.3 |
| D | 13 | 104 | 413284 | 1989.63 | 871 | 846 | 207.3 |
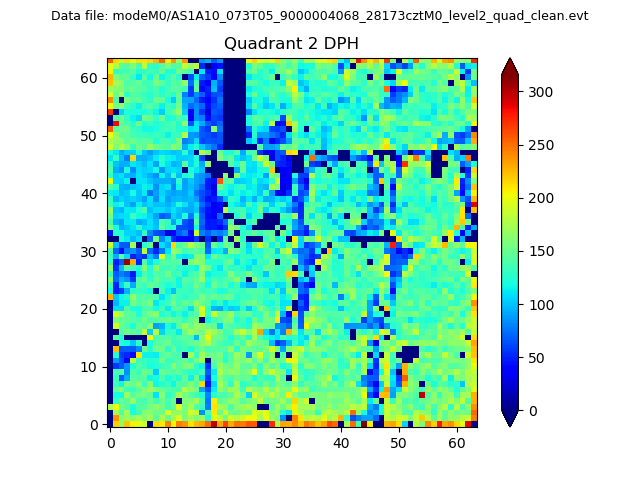
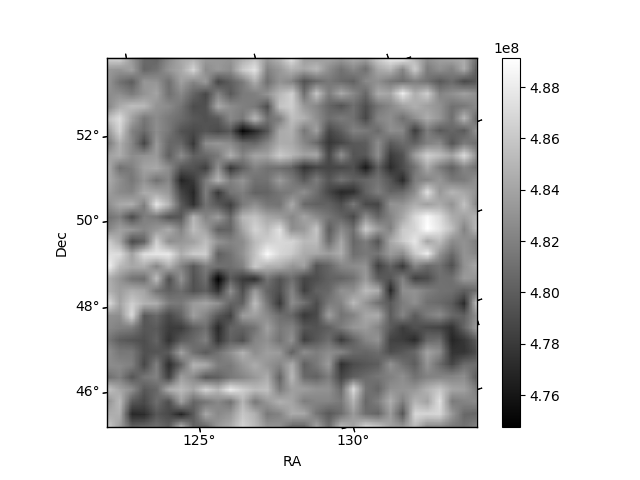
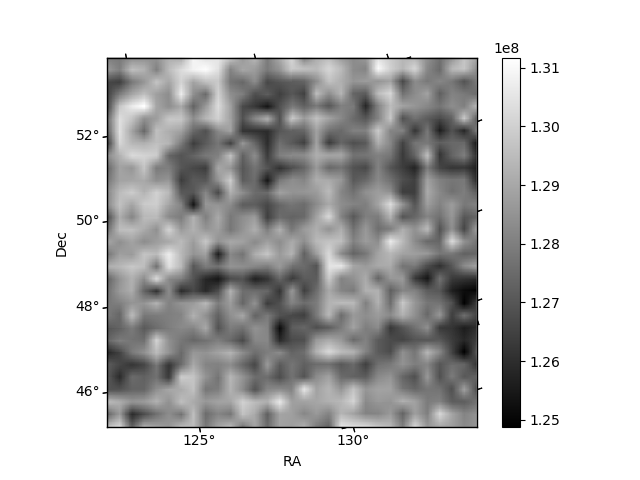
Histogram calculated using DETX and DETY for each event in the final _common_clean file
| Quadrant A |  |
 |
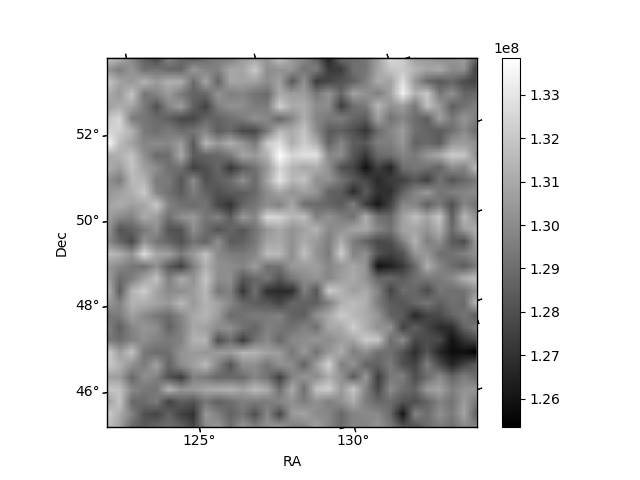
Quadrant B |
|---|---|---|---|
| Quadrant D |  |
 |
Quadrant C |
| Plot type | Count rate plots | Images |
|---|---|---|
| Comparison with Poisson distribution Blue bars denote a histogram of data divided into 1 sec bins. Red curve is a Poisson curve with rate = median count rate of data. |
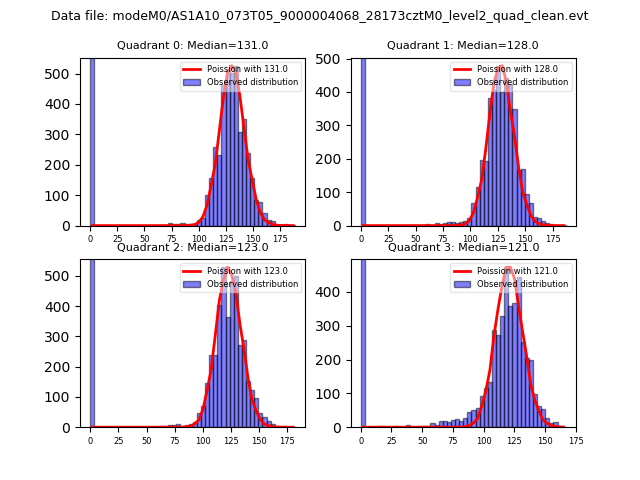 |
 |
| Quadrant-wise count rates Data is divided into 100 sec bins |
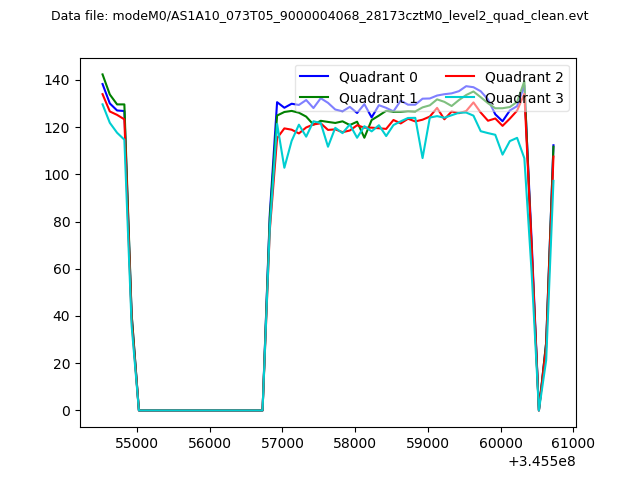 |
|
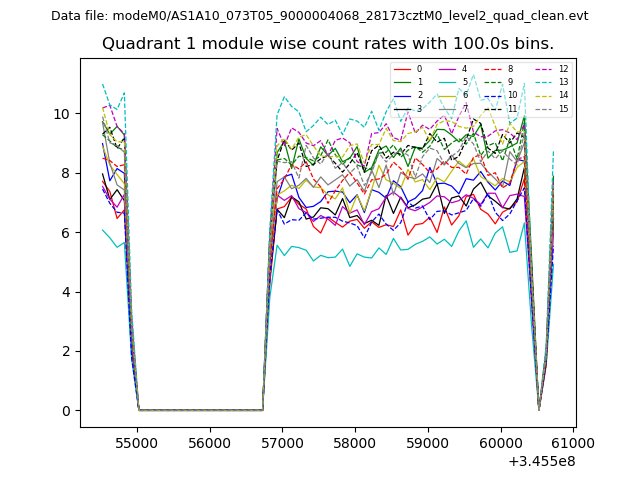
| Module-wise count rates for Quadrant A Data is divided into 100 sec bins |
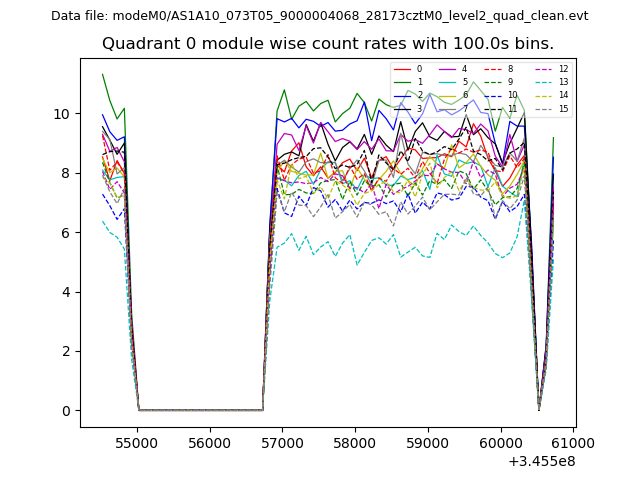 |
 |
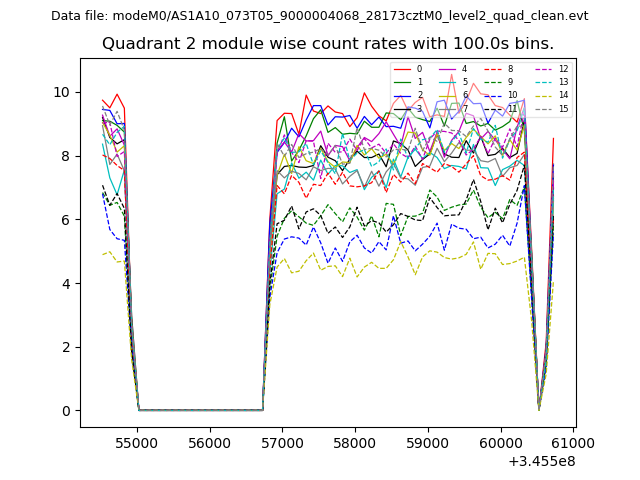
| Module-wise count rates for Quadrant B Data is divided into 100 sec bins |
 |
 |
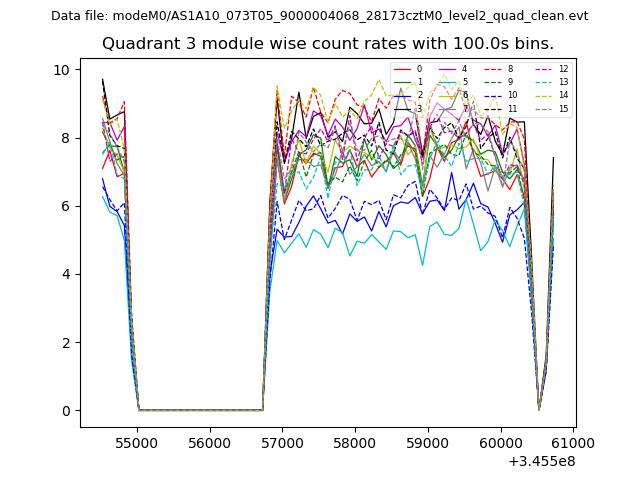
| Module-wise count rates for Quadrant C Data is divided into 100 sec bins |
 |
 |
| Module-wise count rates for Quadrant D Data is divided into 100 sec bins |
 |
 |
| Parameter | Plot |
|---|---|
| CZT HV Monitor | 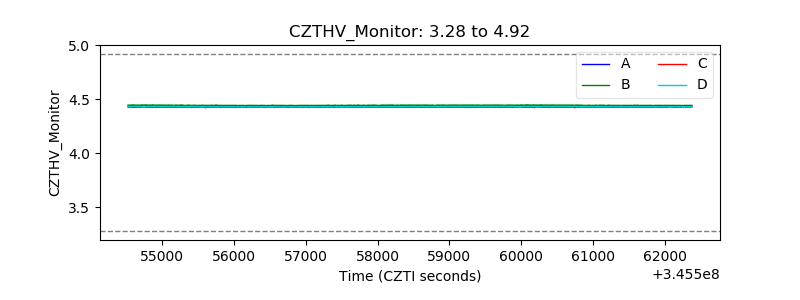 |
| D_VDD | 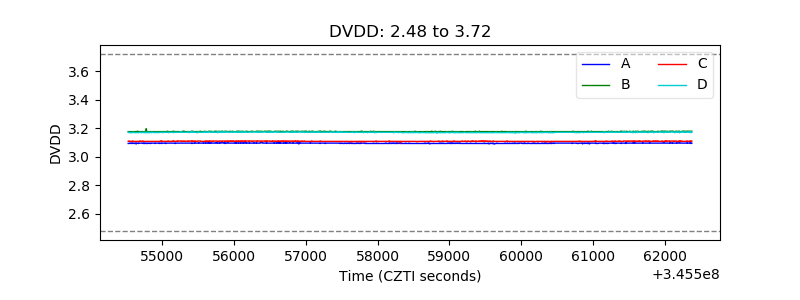 |
| Temperature 1 | 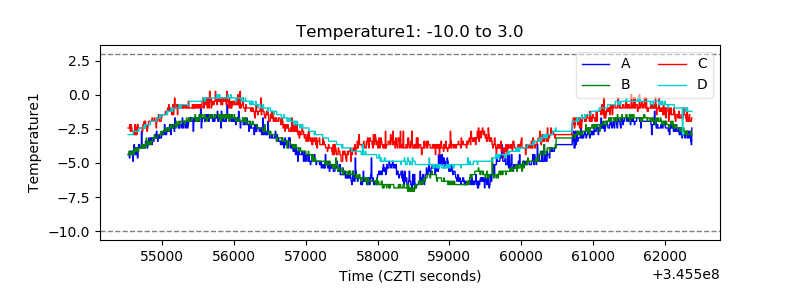 |
| Veto HV Monitor | 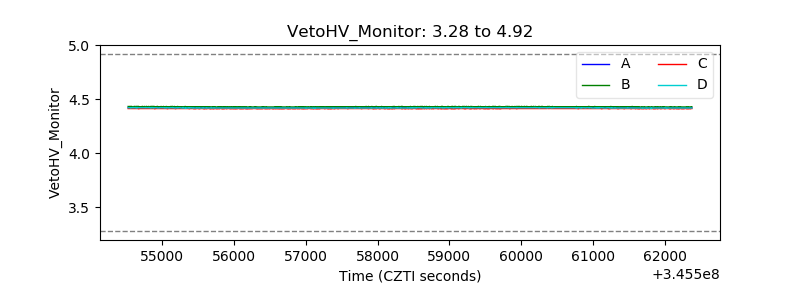 |
| Veto LLD |  |
| Alpha Counter | 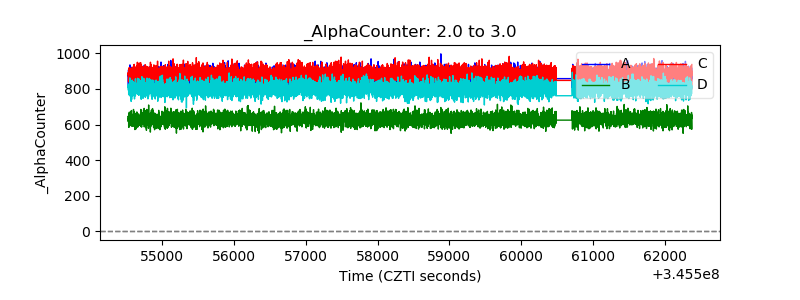 |
| _CPM_Rate |  |
| CZT Counter | 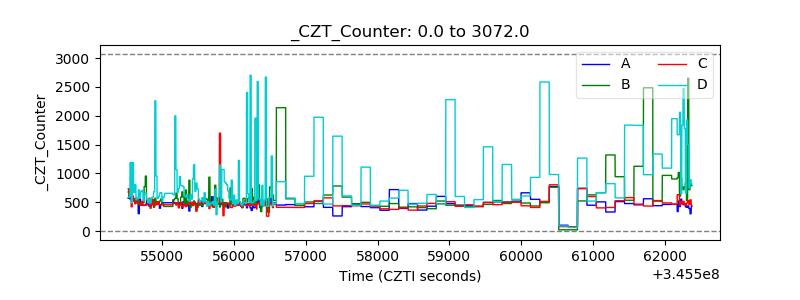 |
| +2.5 Volts monitor |  |
| +5 Volts monitor | 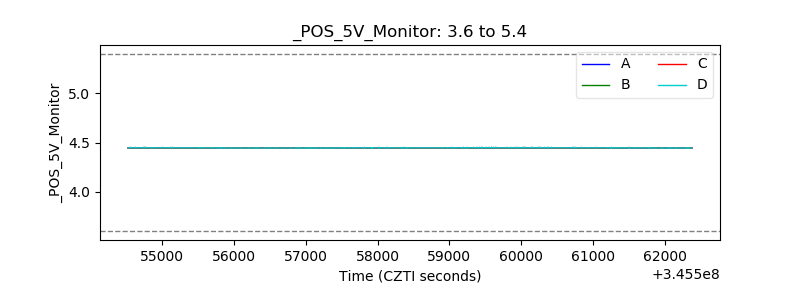 |
| _ROLL_ROT | 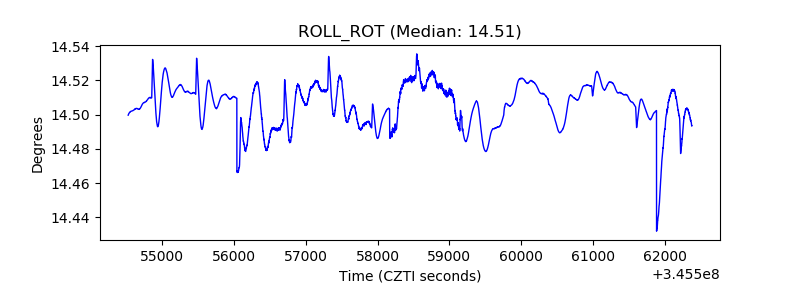 |
| _Roll_DEC | 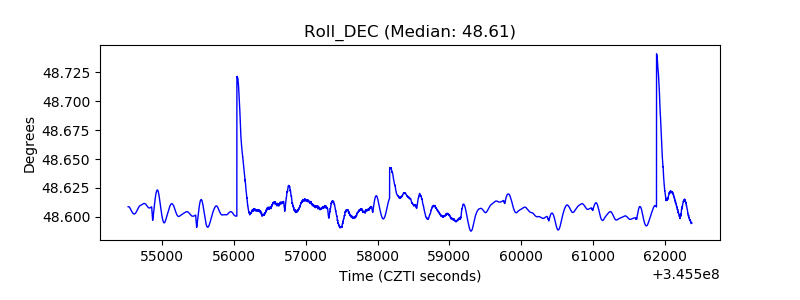 |
| _Roll_RA | 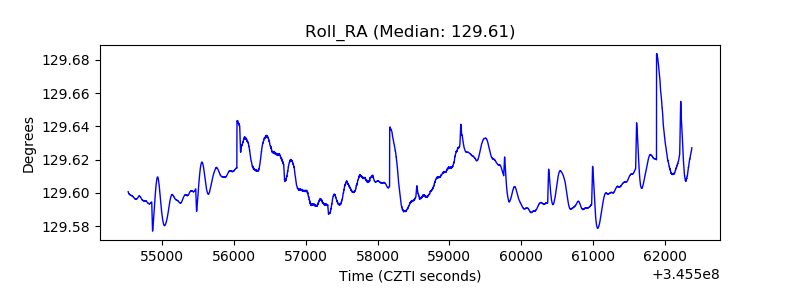 |
| Veto Counter | 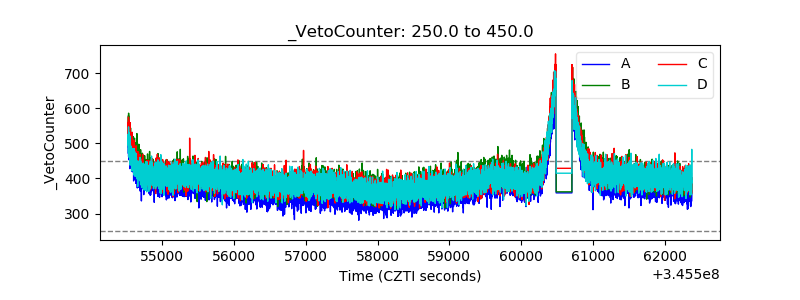 |