| Param | Original file | Final file |
|---|---|---|
| Filename | modeM0/AS1A10_073T05_9000004068_28174cztM0_level2.evt | modeM0/AS1A10_073T05_9000004068_28174cztM0_level2_quad_clean.evt |
| Size (bytes) | 588,418,560 | 80,709,120 |
| Size | 561.2 MB | 77.0 MB |
| Events in quadrant A | 3,263,043 | 509,836 |
| Events in quadrant B | 4,436,276 | 498,003 |
| Events in quadrant C | 3,493,923 | 479,645 |
| Events in quadrant D | 6,154,938 | 471,247 |
| Mode M0 | |||
|---|---|---|---|
| Quadrant | BADHDUFLAG | Total packets | Discarded packets |
| A | 0 | 14199 | 0 |
| B | 0 | 17739 | 0 |
| C | 0 | 14771 | 0 |
| D | 0 | 23114 | 0 |
| Mode M9 | |||
|---|---|---|---|
| Quadrant | BADHDUFLAG | Total packets | Discarded packets |
| A | 0 | 4 | 0 |
| B | 0 | 4 | 0 |
| C | 0 | 4 | 0 |
| D | 0 | 4 | 0 |
| Quadrant | Total seconds | Saturated seconds | Saturation percentage |
|---|---|---|---|
| A | 6962 | 81 | 1.163459% |
| B | 6963 | 249 | 3.576045% |
| C | 6963 | 154 | 2.211690% |
| D | 6963 | 797 | 11.446216% |
Noise dominated data is calculated using 1-second bins in cleaned event files. If a bin has >2000 counts, and if more than 50% of those come from <1% of pixels, then it is considered to be noise-dominated and hence unusable.
| Quadrant | # 1 sec bins | Bins with >0 counts | Bins with >2000 counts | High rate bins dominated by noise | Noise dominated (total time) | Noise dominated (detector-on time) | Marked lightcurve |
|---|---|---|---|---|---|---|---|
| A | 7347 | 6962 | 0 | 0 | 0.00% | 0.00% | 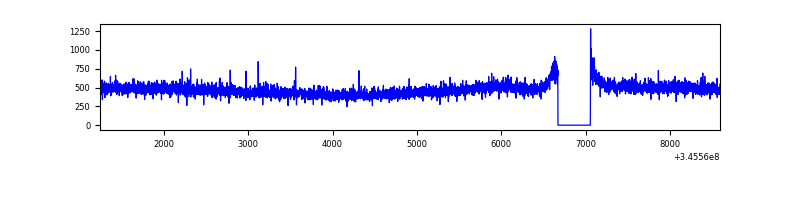 |
| B | 7348 | 6963 | 107 | 107 | 1.46% | 1.54% | 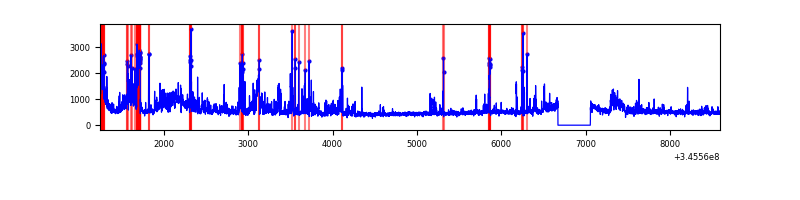 |
| C | 7348 | 6963 | 9 | 9 | 0.12% | 0.13% | 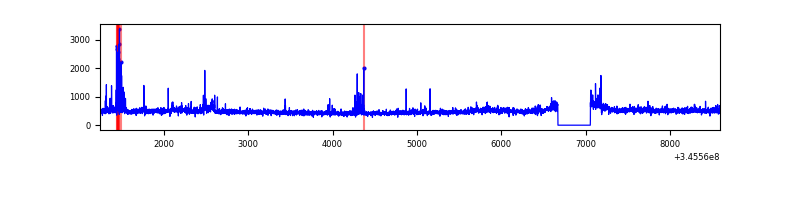 |
| D | 7348 | 6963 | 612 | 612 | 8.33% | 8.79% | 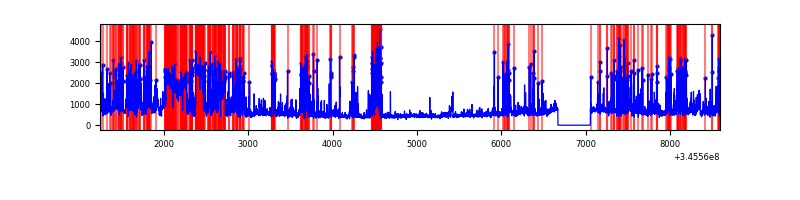 |
Top three noisy pixels from each quadrant. If the there are fewer than three noisy pixels in the level2.evt file, extra rows are filled as -1
| Pixel properties | Quadrant properties | ||||||
|---|---|---|---|---|---|---|---|
| Quadrant | DetID | PixID | Counts | Sigma | Mean | Median | Sigma |
| A | 13 | 254 | 11219 | 61.17 | 841 | 821 | 170.0 |
| A | 3 | 137 | 8223 | 43.54 | 841 | 821 | 170.0 |
| A | 0 | 226 | 7179 | 37.4 | 841 | 821 | 170.0 |
| B | 10 | 245 | 980343 | 6220.46 | 819 | 797 | 157.5 |
| B | 10 | 246 | 105209 | 663.05 | 819 | 797 | 157.5 |
| B | 15 | 32 | 80592 | 506.73 | 819 | 797 | 157.5 |
| C | 3 | 233 | 167224 | 894.92 | 794 | 798 | 186.0 |
| C | 14 | 238 | 127726 | 682.53 | 794 | 798 | 186.0 |
| C | 15 | 208 | 101488 | 541.44 | 794 | 798 | 186.0 |
| D | 1 | 52 | 1685082 | 9061.07 | 781 | 760 | 185.9 |
| D | 13 | 104 | 491985 | 2642.62 | 781 | 760 | 185.9 |
| D | 2 | 250 | 484658 | 2603.2 | 781 | 760 | 185.9 |
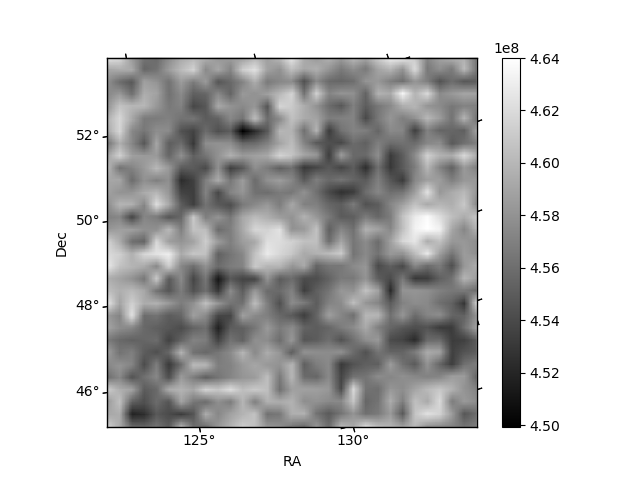
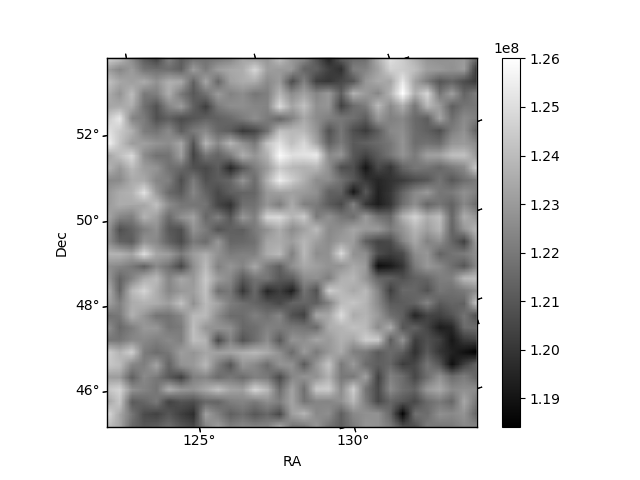
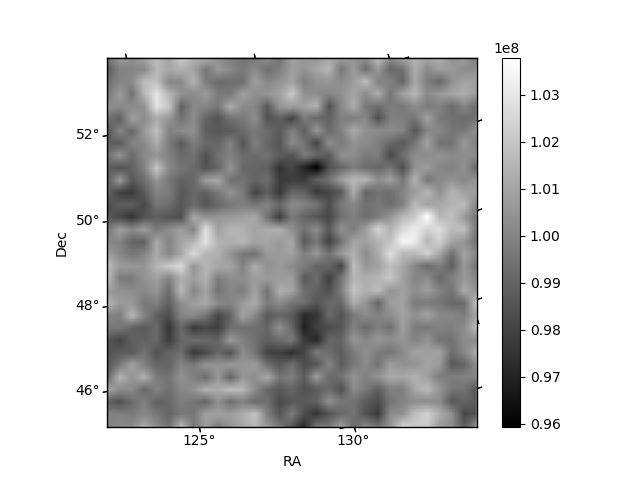
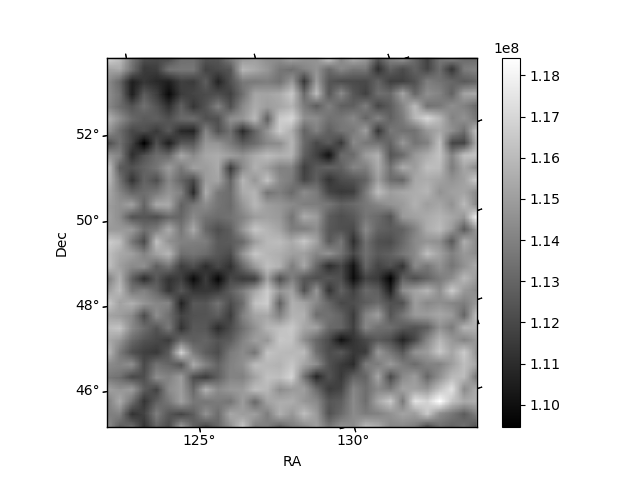
Histogram calculated using DETX and DETY for each event in the final _common_clean file
| Quadrant A | 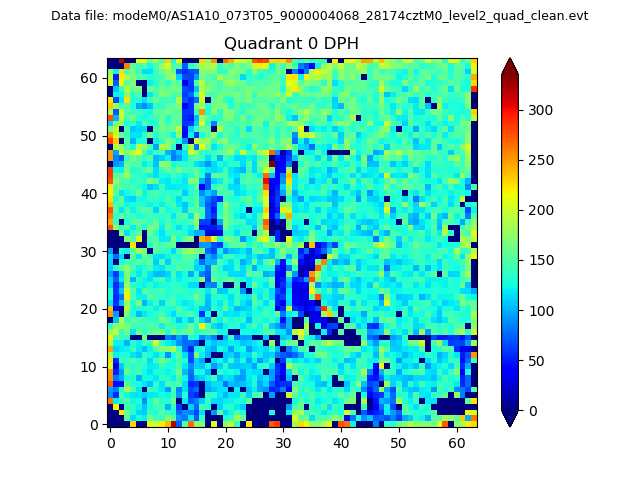 |
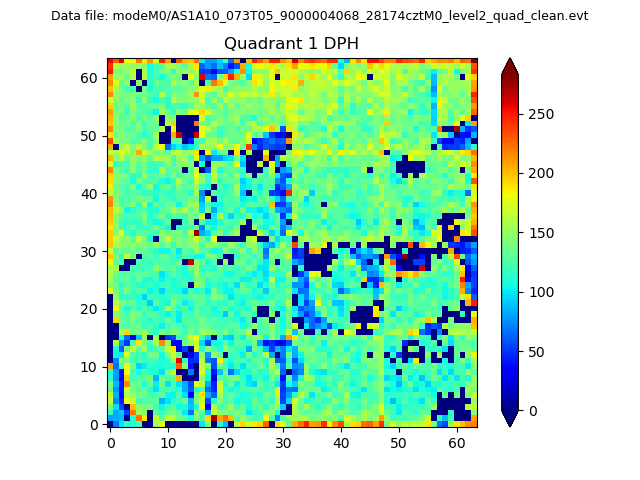 |
Quadrant B |
|---|---|---|---|
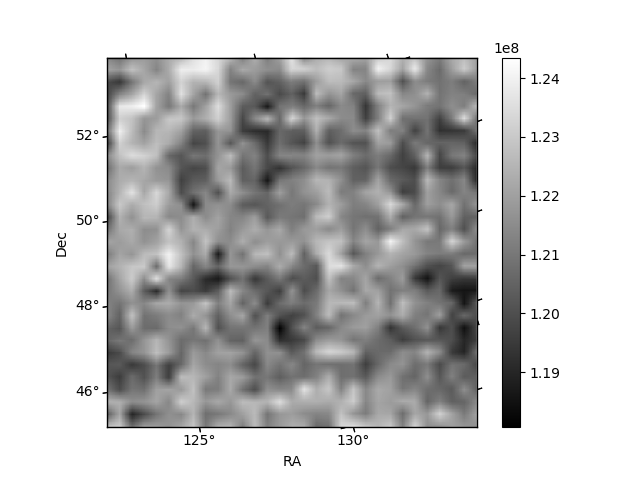
| Quadrant D |  |
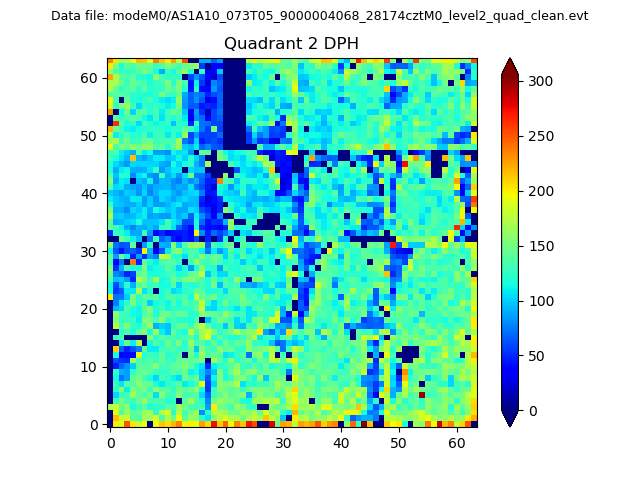 |
Quadrant C |
| Plot type | Count rate plots | Images |
|---|---|---|
| Comparison with Poisson distribution Blue bars denote a histogram of data divided into 1 sec bins. Red curve is a Poisson curve with rate = median count rate of data. |
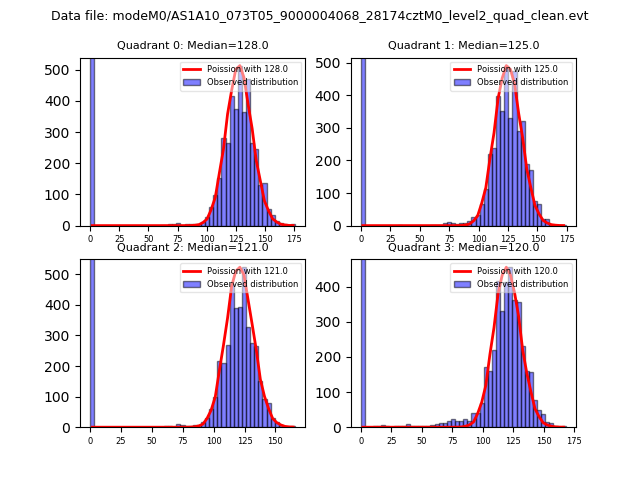 |
 |
| Quadrant-wise count rates Data is divided into 100 sec bins |
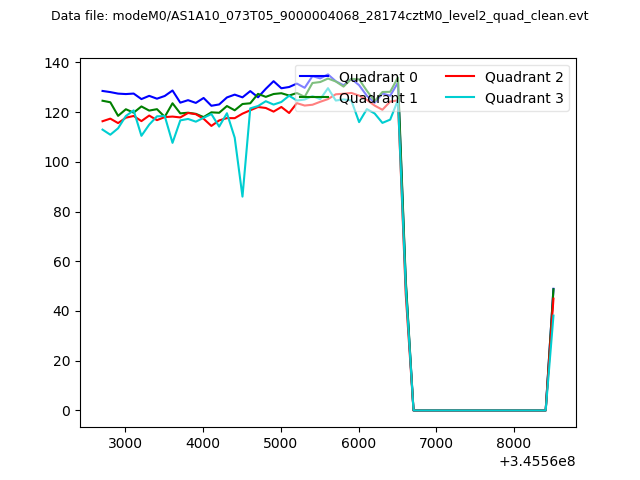 |
|
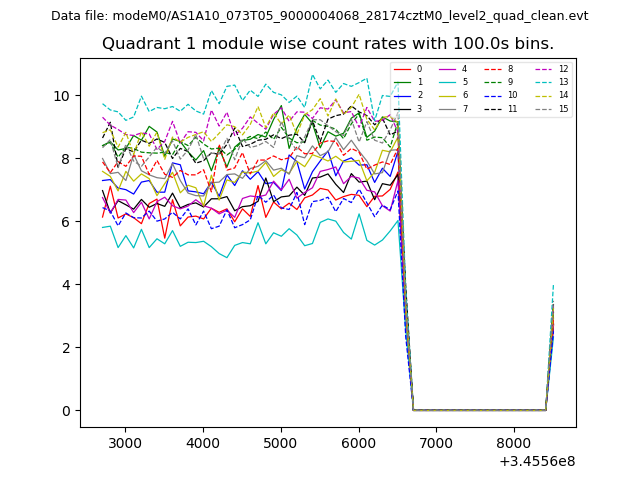
| Module-wise count rates for Quadrant A Data is divided into 100 sec bins |
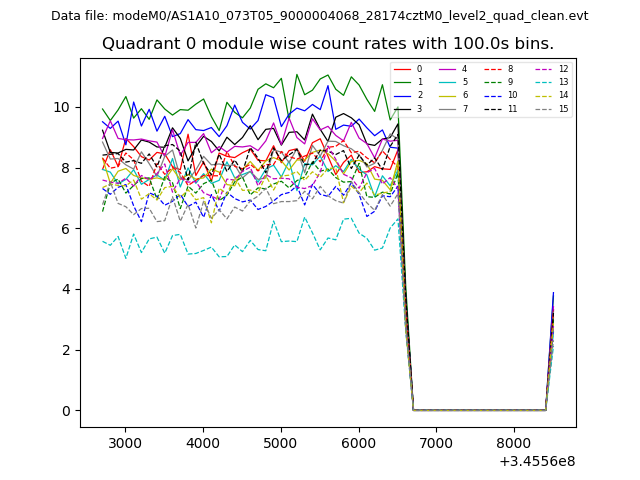 |
 |
| Module-wise count rates for Quadrant B Data is divided into 100 sec bins |
 |
 |
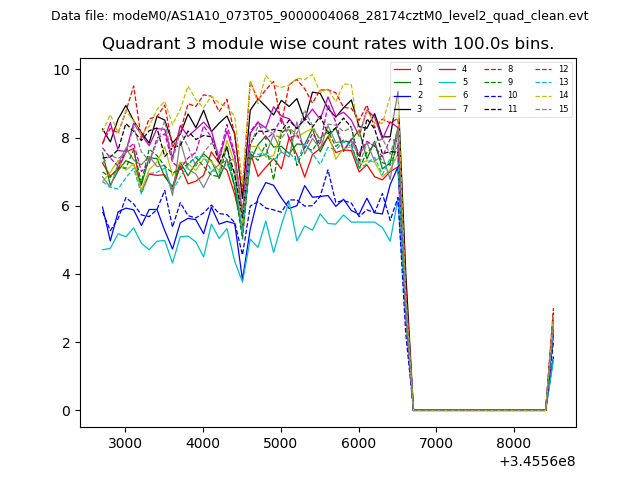
| Module-wise count rates for Quadrant C Data is divided into 100 sec bins |
 |
 |
| Module-wise count rates for Quadrant D Data is divided into 100 sec bins |
 |
 |
| Parameter | Plot |
|---|---|
| CZT HV Monitor | 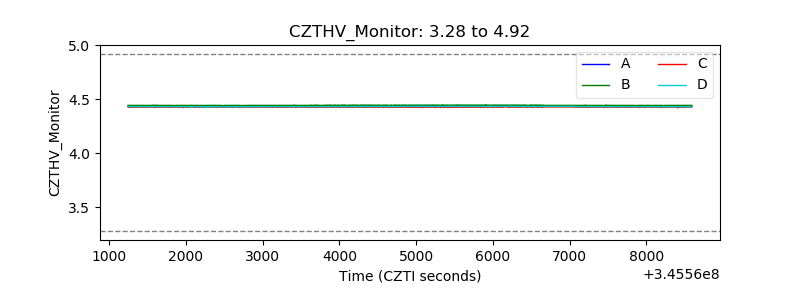 |
| D_VDD | 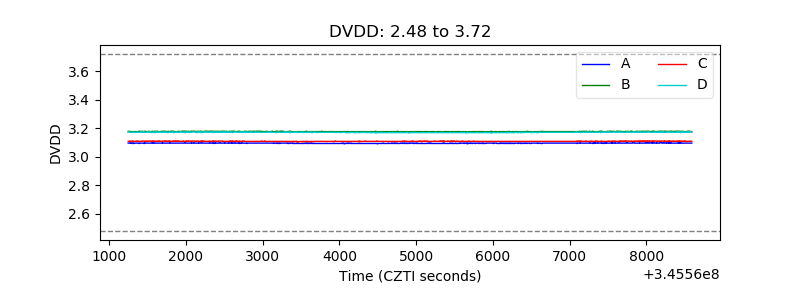 |
| Temperature 1 | 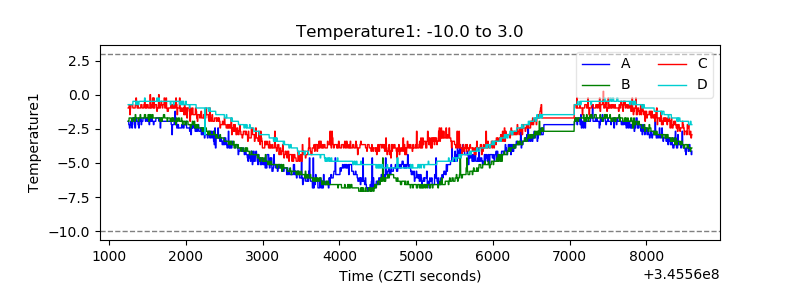 |
| Veto HV Monitor | 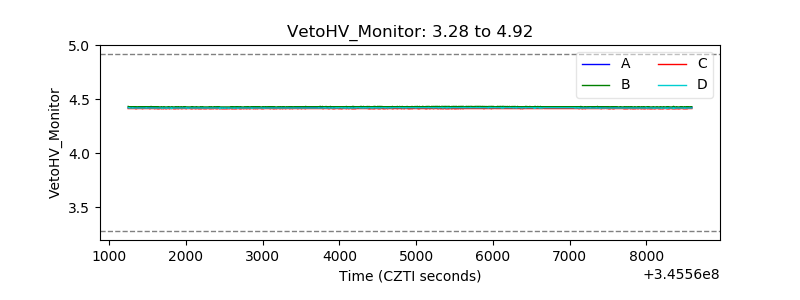 |
| Veto LLD | 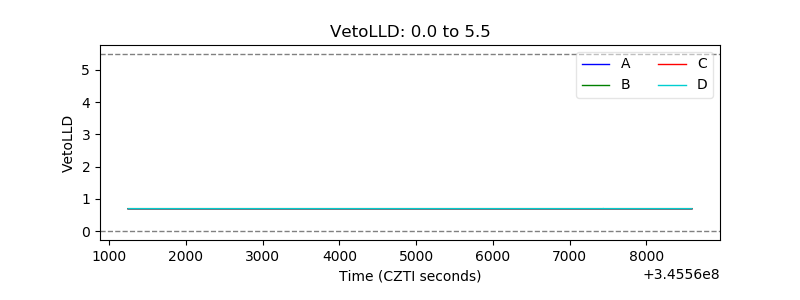 |
| Alpha Counter | 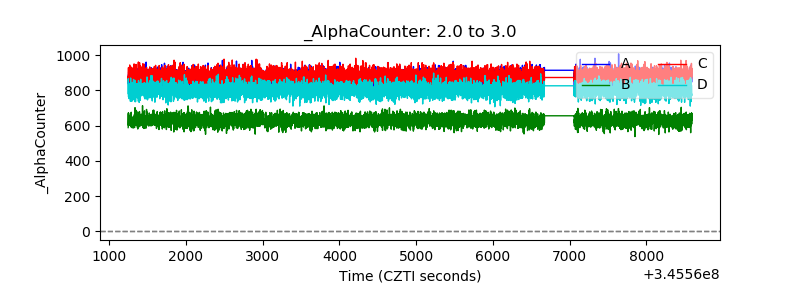 |
| _CPM_Rate | 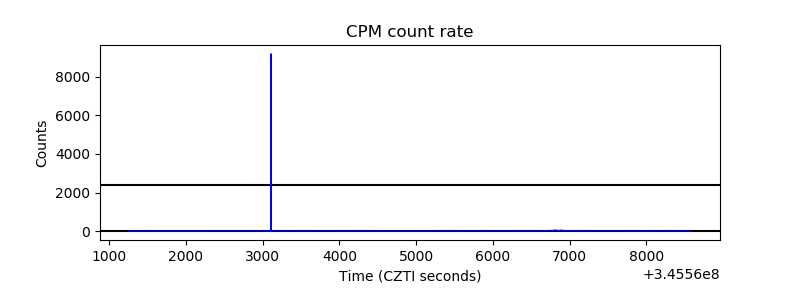 |
| CZT Counter | 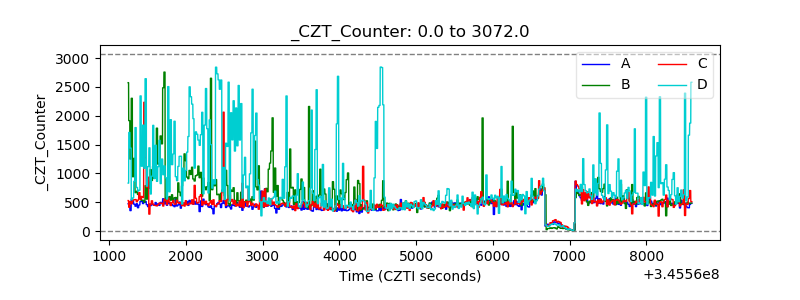 |
| +2.5 Volts monitor |  |
| +5 Volts monitor | 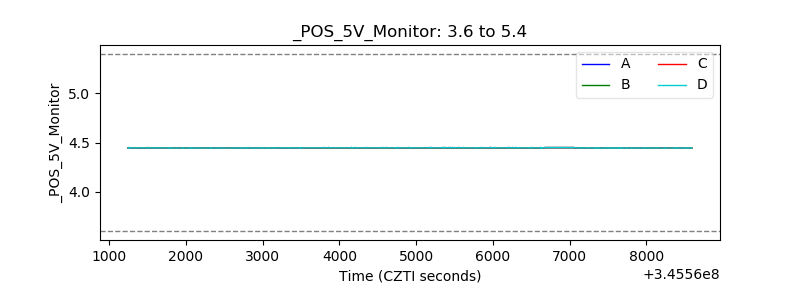 |
| _ROLL_ROT | 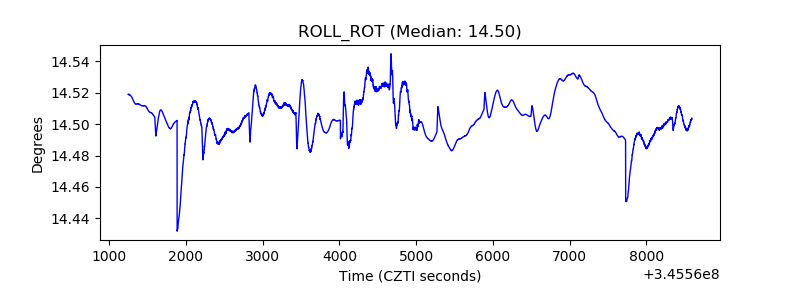 |
| _Roll_DEC | 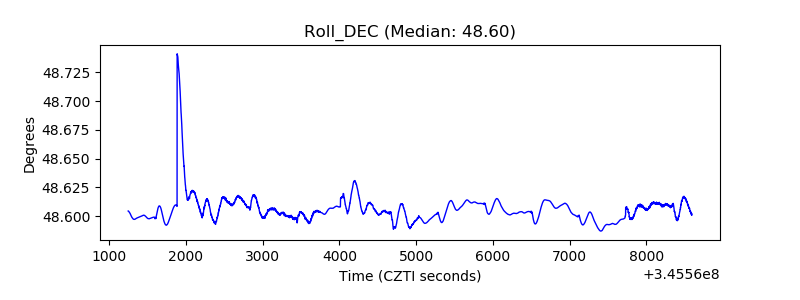 |
| _Roll_RA | 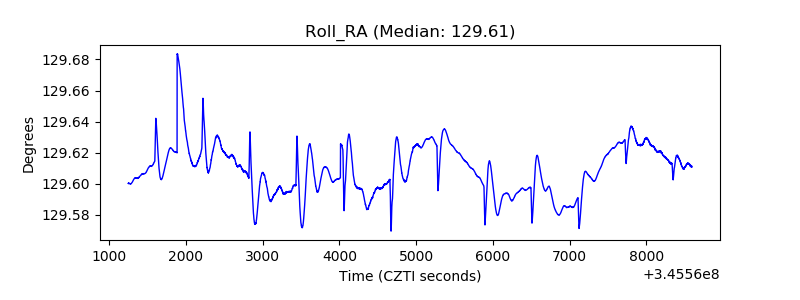 |
| Veto Counter | 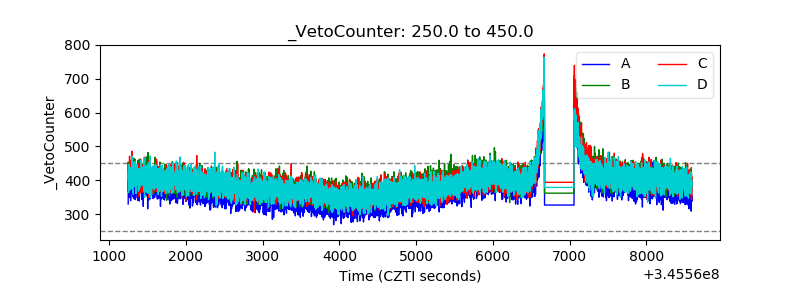 |