| Param | Original file | Final file |
|---|---|---|
| Filename | modeM0/AS1A10_073T05_9000004068_28177cztM0_level2.evt | modeM0/AS1A10_073T05_9000004068_28177cztM0_level2_quad_clean.evt |
| Size (bytes) | 592,822,080 | 100,918,080 |
| Size | 565.4 MB | 96.2 MB |
| Events in quadrant A | 3,270,000 | 666,968 |
| Events in quadrant B | 4,452,871 | 656,762 |
| Events in quadrant C | 3,526,687 | 633,332 |
| Events in quadrant D | 6,231,891 | 613,705 |
| Mode M0 | |||
|---|---|---|---|
| Quadrant | BADHDUFLAG | Total packets | Discarded packets |
| A | 0 | 14350 | 0 |
| B | 0 | 17916 | 0 |
| C | 0 | 15183 | 0 |
| D | 0 | 23342 | 0 |
| Mode M9 | |||
|---|---|---|---|
| Quadrant | BADHDUFLAG | Total packets | Discarded packets |
| A | 0 | 17 | 0 |
| B | 0 | 17 | 0 |
| C | 0 | 17 | 0 |
| D | 0 | 17 | 0 |
| Quadrant | Total seconds | Saturated seconds | Saturation percentage |
|---|---|---|---|
| A | 6970 | 60 | 0.860832% |
| B | 6970 | 487 | 6.987088% |
| C | 6970 | 195 | 2.797704% |
| D | 6970 | 690 | 9.899570% |
Noise dominated data is calculated using 1-second bins in cleaned event files. If a bin has >2000 counts, and if more than 50% of those come from <1% of pixels, then it is considered to be noise-dominated and hence unusable.
| Quadrant | # 1 sec bins | Bins with >0 counts | Bins with >2000 counts | High rate bins dominated by noise | Noise dominated (total time) | Noise dominated (detector-on time) | Marked lightcurve |
|---|---|---|---|---|---|---|---|
| A | 8605 | 6972 | 0 | 0 | 0.00% | 0.00% |  |
| B | 8605 | 6970 | 242 | 242 | 2.81% | 3.47% |  |
| C | 8605 | 6970 | 18 | 18 | 0.21% | 0.26% |  |
| D | 8605 | 6970 | 560 | 560 | 6.51% | 8.03% |  |
Top three noisy pixels from each quadrant. If the there are fewer than three noisy pixels in the level2.evt file, extra rows are filled as -1
| Pixel properties | Quadrant properties | ||||||
|---|---|---|---|---|---|---|---|
| Quadrant | DetID | PixID | Counts | Sigma | Mean | Median | Sigma |
| A | 13 | 254 | 11870 | 64.14 | 845 | 827 | 172.2 |
| A | 0 | 13 | 8485 | 44.48 | 845 | 827 | 172.2 |
| A | 3 | 137 | 8474 | 44.42 | 845 | 827 | 172.2 |
| B | 10 | 245 | 818845 | 5207.67 | 816 | 792 | 157.1 |
| B | 10 | 246 | 355894 | 2260.55 | 816 | 792 | 157.1 |
| B | 0 | 230 | 24830 | 153.02 | 816 | 792 | 157.1 |
| C | 14 | 238 | 131006 | 687.38 | 807 | 809 | 189.4 |
| C | 15 | 208 | 121739 | 638.45 | 807 | 809 | 189.4 |
| C | 3 | 233 | 103602 | 542.7 | 807 | 809 | 189.4 |
| D | 1 | 52 | 1457279 | 7813.78 | 784 | 762 | 186.4 |
| D | 13 | 104 | 1091064 | 5849.15 | 784 | 762 | 186.4 |
| D | 2 | 250 | 358681 | 1920.13 | 784 | 762 | 186.4 |
Histogram calculated using DETX and DETY for each event in the final _common_clean file
| Quadrant A |  |
 |
Quadrant B |
|---|---|---|---|
| Quadrant D |  |
 |
Quadrant C |
| Plot type | Count rate plots | Images |
|---|---|---|
| Comparison with Poisson distribution Blue bars denote a histogram of data divided into 1 sec bins. Red curve is a Poisson curve with rate = median count rate of data. |
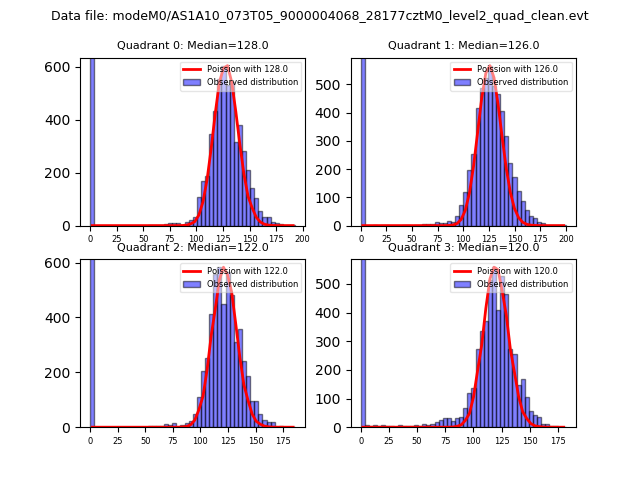 |
 |
| Quadrant-wise count rates Data is divided into 100 sec bins |
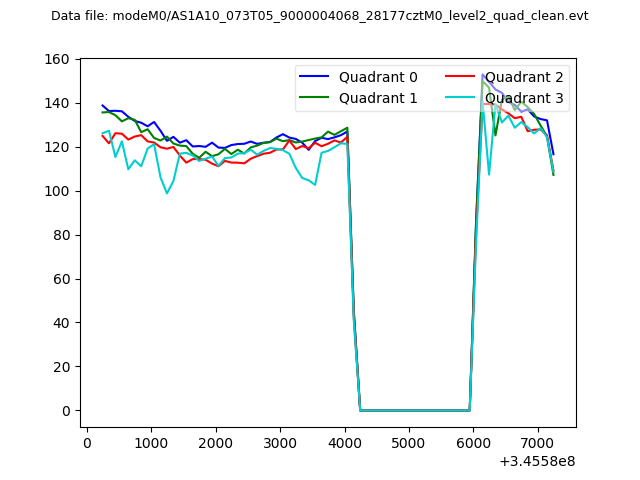 |
|
| Module-wise count rates for Quadrant A Data is divided into 100 sec bins |
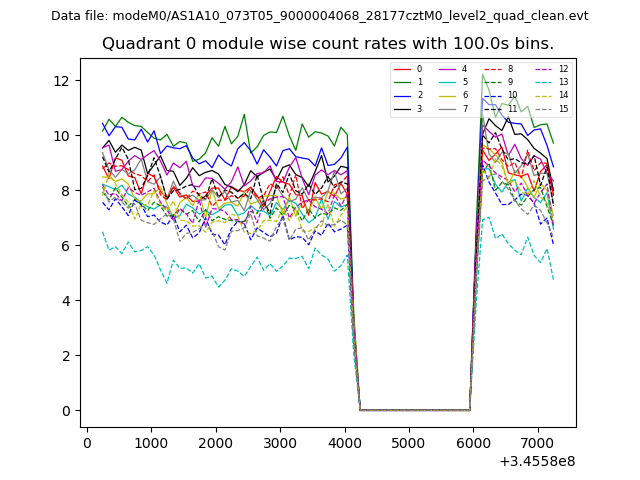 |
 |
| Module-wise count rates for Quadrant B Data is divided into 100 sec bins |
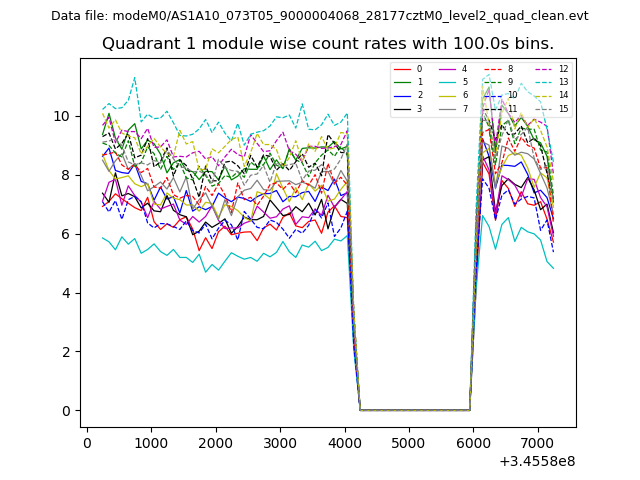 |
 |
| Module-wise count rates for Quadrant C Data is divided into 100 sec bins |
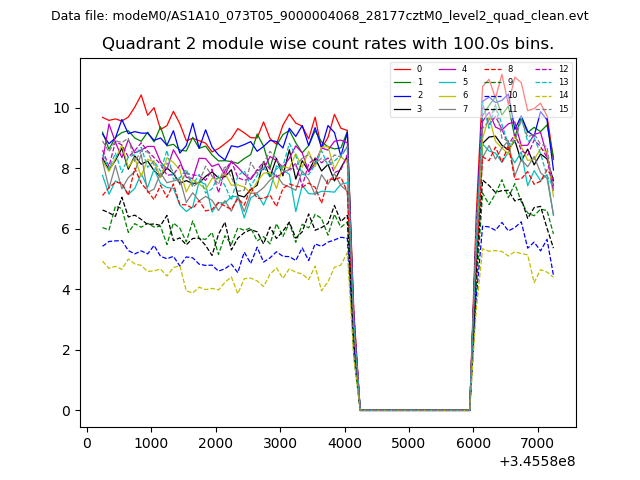 |
 |
| Module-wise count rates for Quadrant D Data is divided into 100 sec bins |
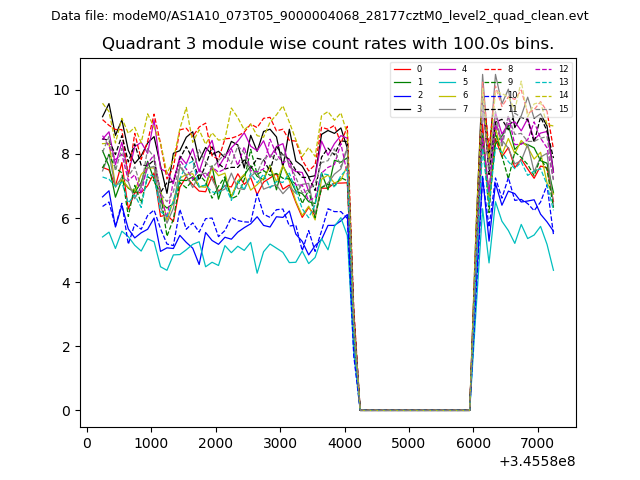 |
 |
| Parameter | Plot |
|---|---|
| CZT HV Monitor | 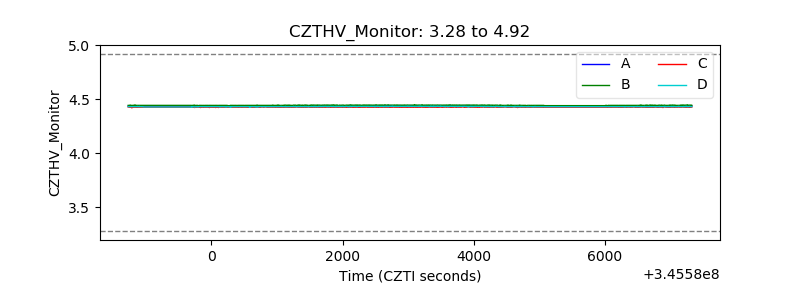 |
| D_VDD |  |
| Temperature 1 |  |
| Veto HV Monitor |  |
| Veto LLD |  |
| Alpha Counter | 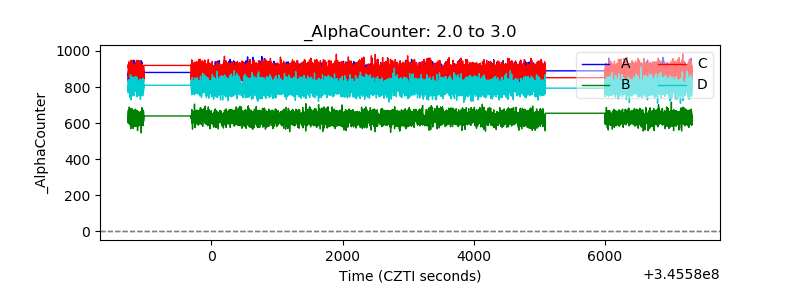 |
| _CPM_Rate | 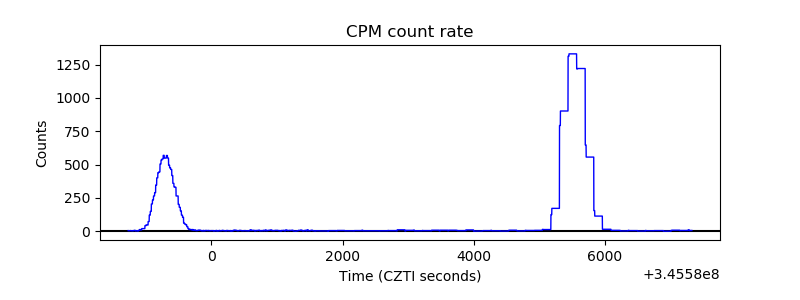 |
| CZT Counter |  |
| +2.5 Volts monitor |  |
| +5 Volts monitor |  |
| _ROLL_ROT | 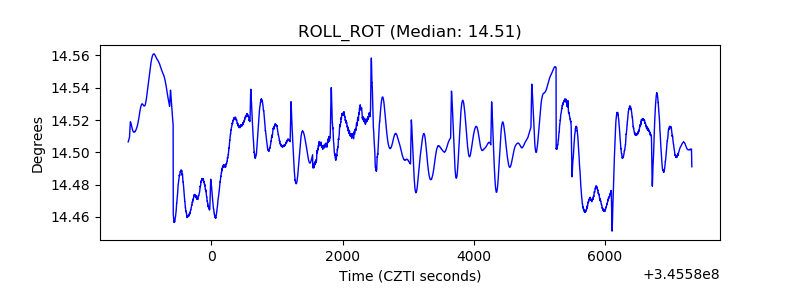 |
| _Roll_DEC | 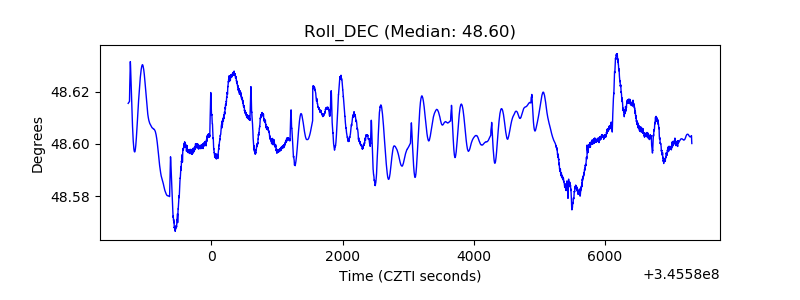 |
| _Roll_RA |  |
| Veto Counter | 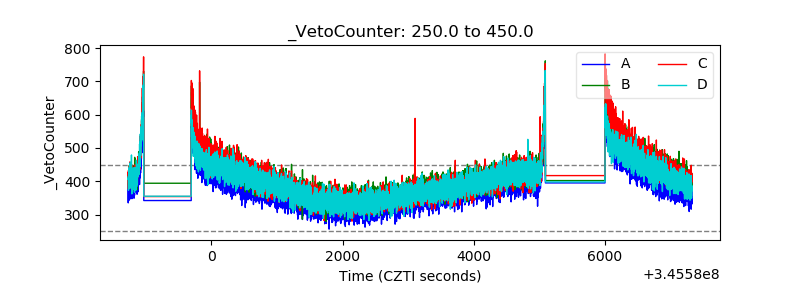 |