| Param | Original file | Final file |
|---|---|---|
| Filename | modeM0/AS1A10_073T05_9000004068_28178cztM0_level2.evt | modeM0/AS1A10_073T05_9000004068_28178cztM0_level2_quad_clean.evt |
| Size (bytes) | 568,742,400 | 104,230,080 |
| Size | 542.4 MB | 99.4 MB |
| Events in quadrant A | 3,100,963 | 707,298 |
| Events in quadrant B | 4,063,398 | 699,615 |
| Events in quadrant C | 3,271,884 | 677,678 |
| Events in quadrant D | 6,342,780 | 613,529 |
| Mode M0 | |||
|---|---|---|---|
| Quadrant | BADHDUFLAG | Total packets | Discarded packets |
| A | 0 | 13649 | 0 |
| B | 0 | 16430 | 0 |
| C | 0 | 14108 | 0 |
| D | 0 | 23390 | 0 |
| Mode M9 | |||
|---|---|---|---|
| Quadrant | BADHDUFLAG | Total packets | Discarded packets |
| A | 0 | 13 | 0 |
| B | 0 | 14 | 0 |
| C | 0 | 14 | 0 |
| D | 0 | 14 | 0 |
| Quadrant | Total seconds | Saturated seconds | Saturation percentage |
|---|---|---|---|
| A | 6573 | 24 | 0.365130% |
| B | 6573 | 270 | 4.107713% |
| C | 6573 | 121 | 1.840864% |
| D | 6573 | 891 | 13.555454% |
Noise dominated data is calculated using 1-second bins in cleaned event files. If a bin has >2000 counts, and if more than 50% of those come from <1% of pixels, then it is considered to be noise-dominated and hence unusable.
| Quadrant | # 1 sec bins | Bins with >0 counts | Bins with >2000 counts | High rate bins dominated by noise | Noise dominated (total time) | Noise dominated (detector-on time) | Marked lightcurve |
|---|---|---|---|---|---|---|---|
| A | 7618 | 6574 | 1 | 1 | 0.01% | 0.02% | 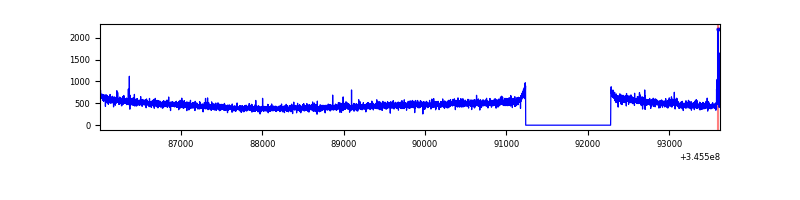 |
| B | 7618 | 6573 | 175 | 175 | 2.30% | 2.66% | 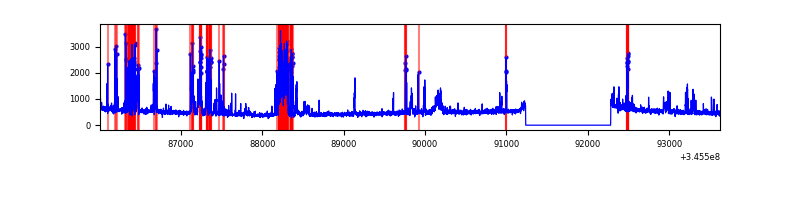 |
| C | 7618 | 6573 | 26 | 26 | 0.34% | 0.40% | 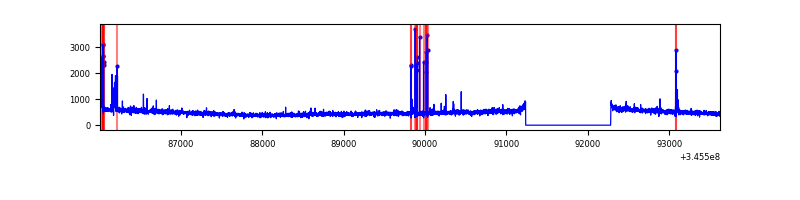 |
| D | 7618 | 6574 | 764 | 764 | 10.03% | 11.62% | 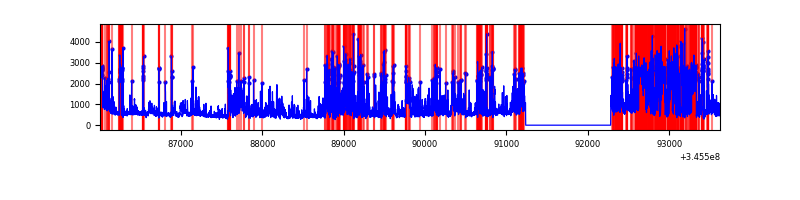 |
Top three noisy pixels from each quadrant. If the there are fewer than three noisy pixels in the level2.evt file, extra rows are filled as -1
| Pixel properties | Quadrant properties | ||||||
|---|---|---|---|---|---|---|---|
| Quadrant | DetID | PixID | Counts | Sigma | Mean | Median | Sigma |
| A | 15 | 174 | 27995 | 170.89 | 795 | 777 | 159.3 |
| A | 13 | 254 | 10657 | 62.03 | 795 | 777 | 159.3 |
| A | 3 | 137 | 7771 | 43.91 | 795 | 777 | 159.3 |
| B | 10 | 245 | 949560 | 6390.21 | 783 | 763 | 148.5 |
| B | 12 | 111 | 18238 | 117.7 | 783 | 763 | 148.5 |
| B | 11 | 111 | 16587 | 106.58 | 783 | 763 | 148.5 |
| C | 15 | 208 | 149291 | 828.75 | 763 | 766 | 179.2 |
| C | 14 | 238 | 124439 | 690.08 | 763 | 766 | 179.2 |
| C | 3 | 233 | 25428 | 137.61 | 763 | 766 | 179.2 |
| D | 1 | 52 | 3250273 | 19053.3 | 714 | 695 | 170.6 |
| D | 2 | 250 | 151862 | 886.34 | 714 | 695 | 170.6 |
| D | 8 | 195 | 118301 | 689.56 | 714 | 695 | 170.6 |
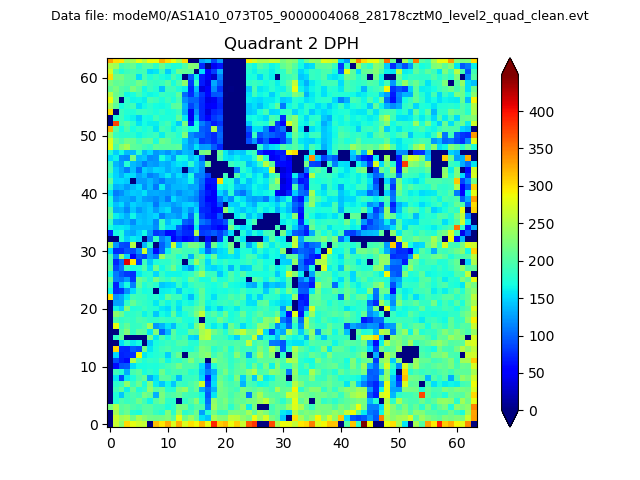
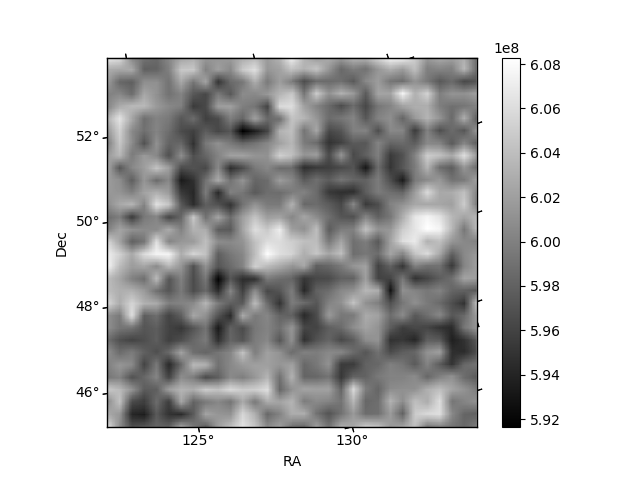
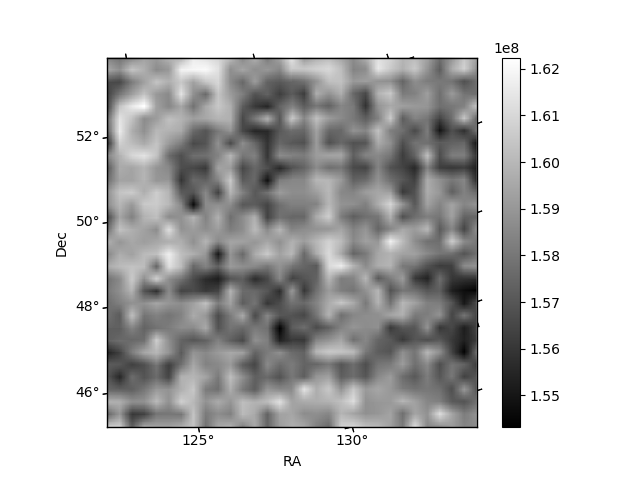
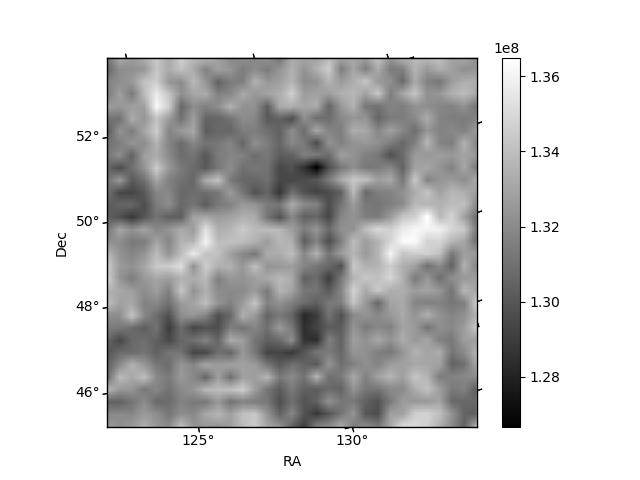
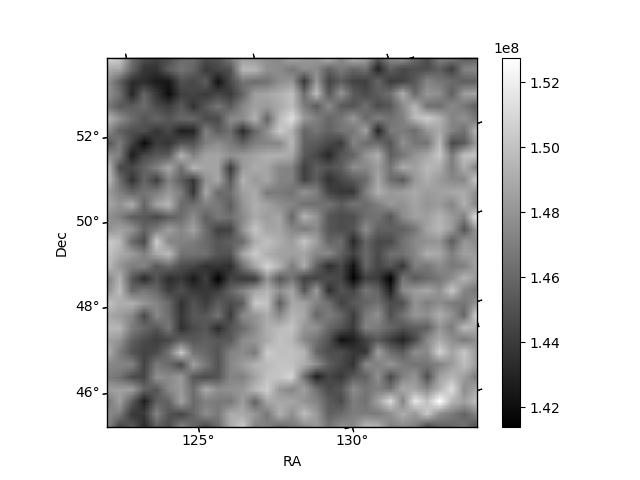
Histogram calculated using DETX and DETY for each event in the final _common_clean file
| Quadrant A | 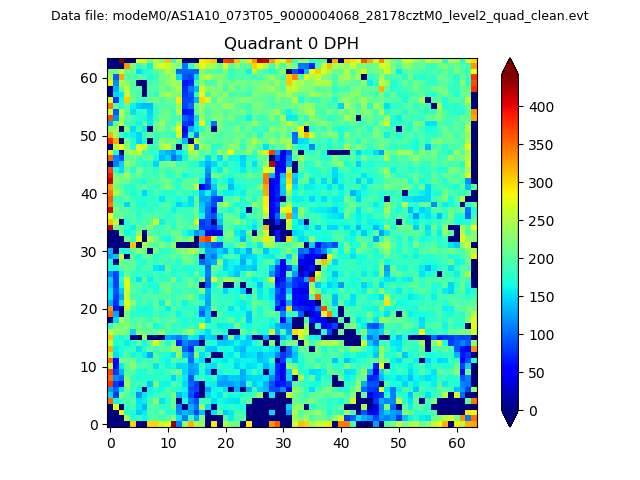 |
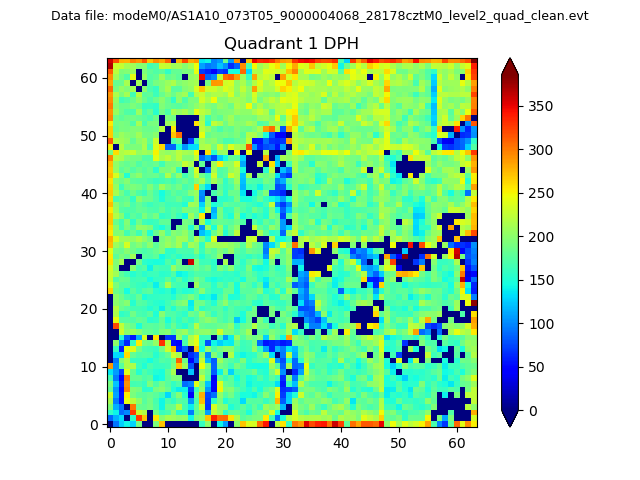 |
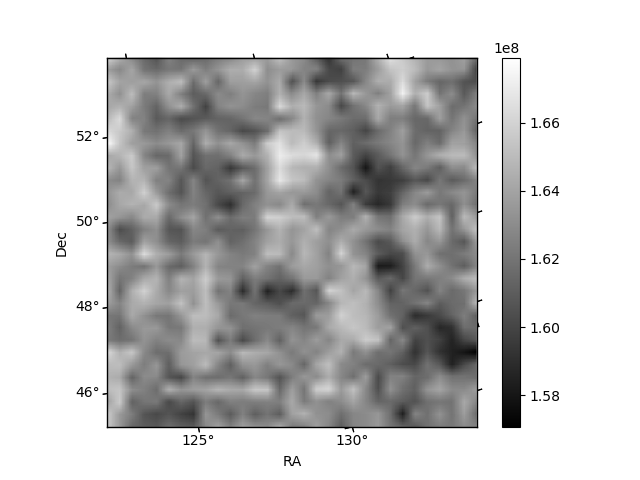
Quadrant B |
|---|---|---|---|
| Quadrant D | 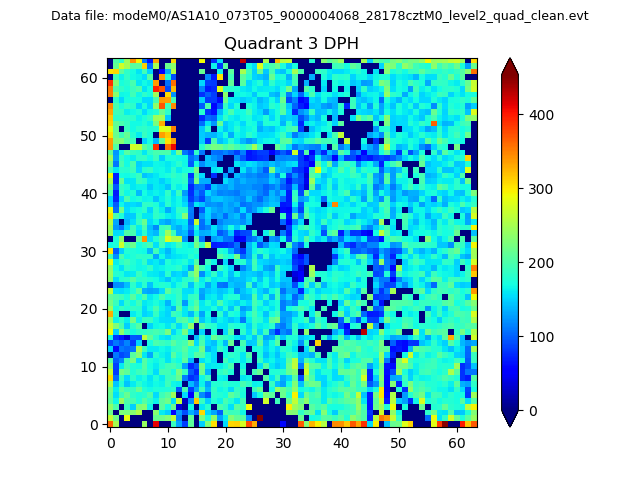 |
 |
Quadrant C |
| Plot type | Count rate plots | Images |
|---|---|---|
| Comparison with Poisson distribution Blue bars denote a histogram of data divided into 1 sec bins. Red curve is a Poisson curve with rate = median count rate of data. |
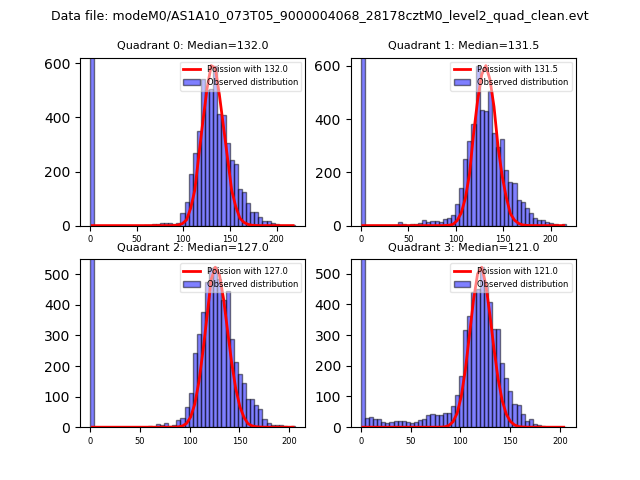 |
 |
| Quadrant-wise count rates Data is divided into 100 sec bins |
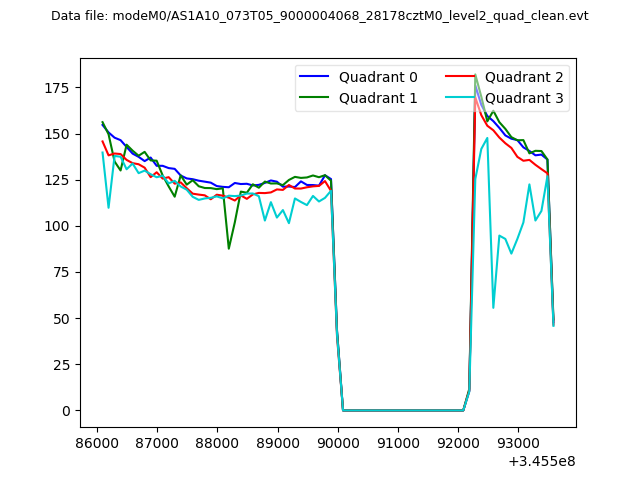 |
|
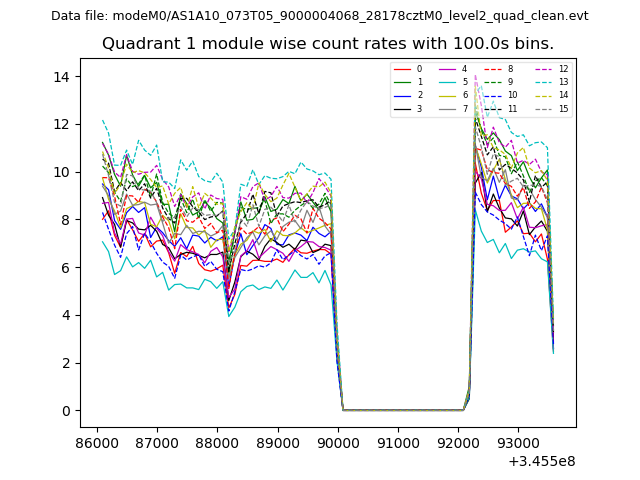
| Module-wise count rates for Quadrant A Data is divided into 100 sec bins |
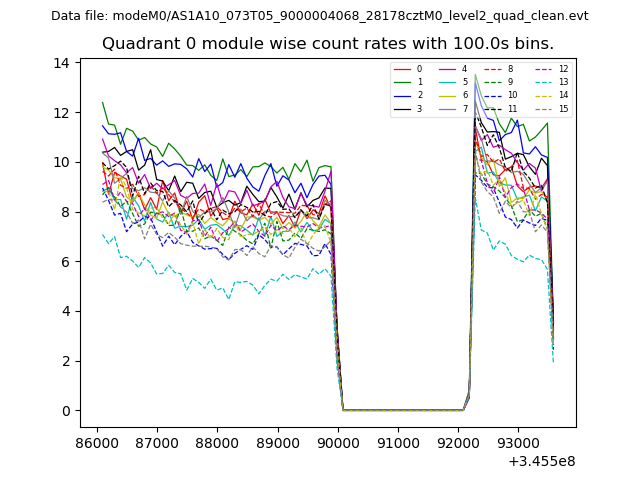 |
 |
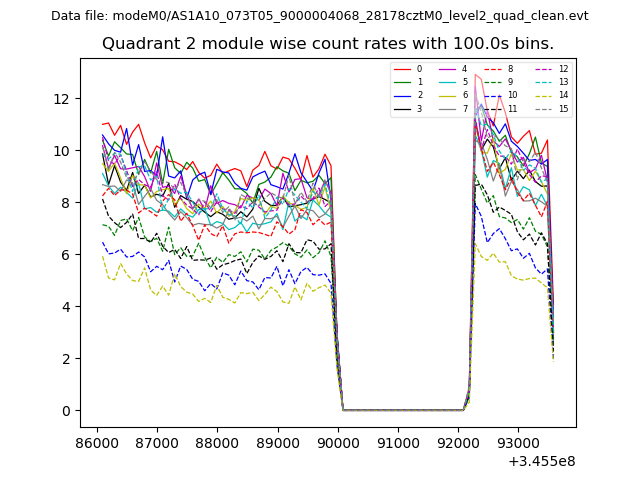
| Module-wise count rates for Quadrant B Data is divided into 100 sec bins |
 |
 |
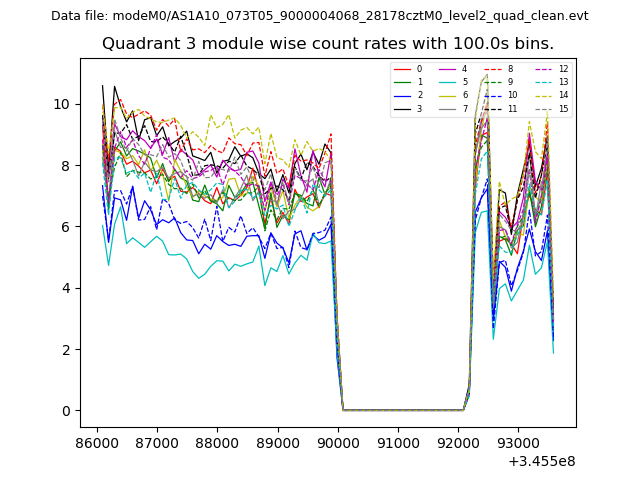
| Module-wise count rates for Quadrant C Data is divided into 100 sec bins |
 |
 |
| Module-wise count rates for Quadrant D Data is divided into 100 sec bins |
 |
 |
| Parameter | Plot |
|---|---|
| CZT HV Monitor | 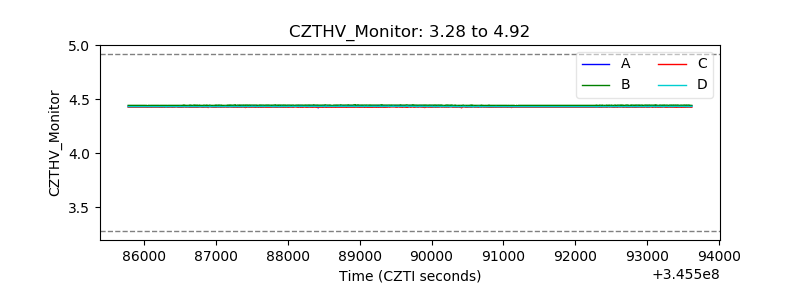 |
| D_VDD | 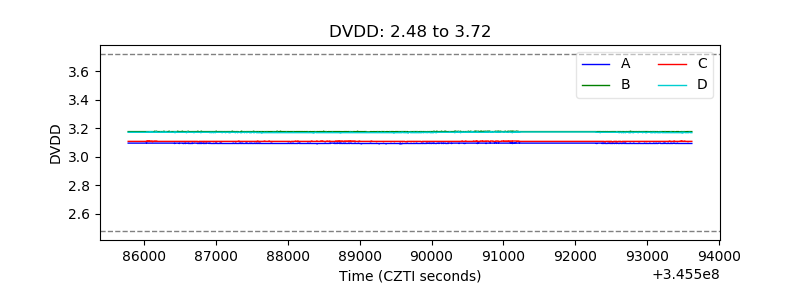 |
| Temperature 1 | 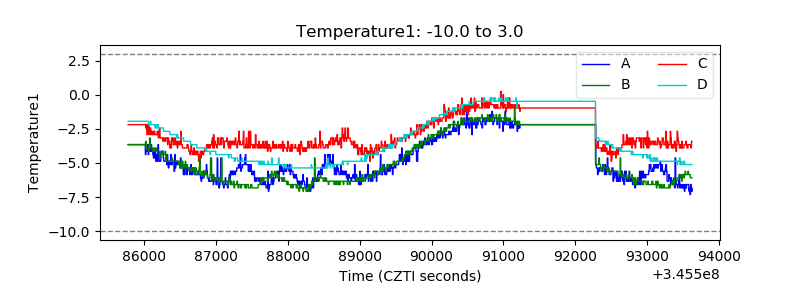 |
| Veto HV Monitor |  |
| Veto LLD | 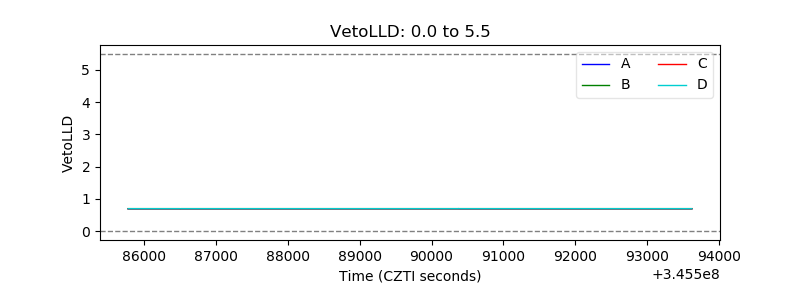 |
| Alpha Counter | 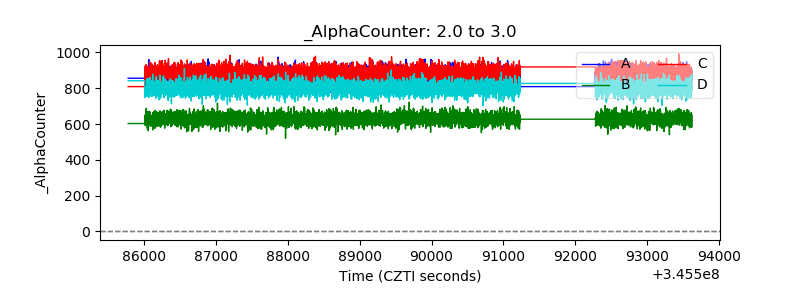 |
| _CPM_Rate | 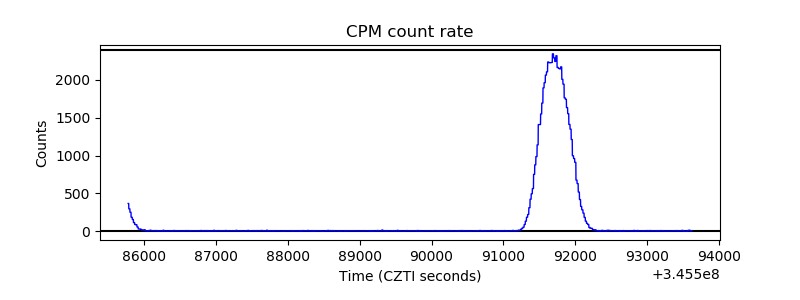 |
| CZT Counter | 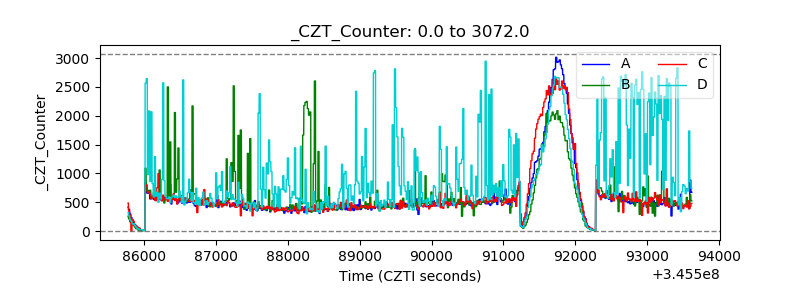 |
| +2.5 Volts monitor |  |
| +5 Volts monitor |  |
| _ROLL_ROT | 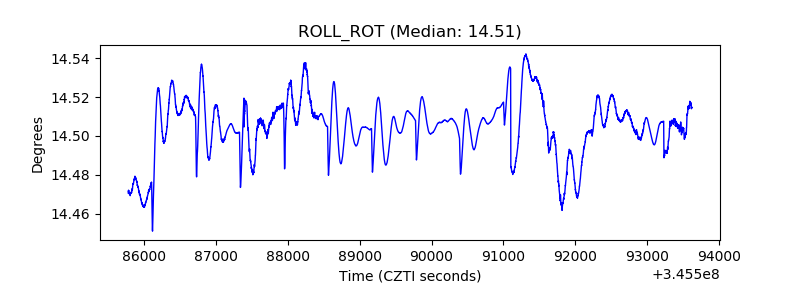 |
| _Roll_DEC | 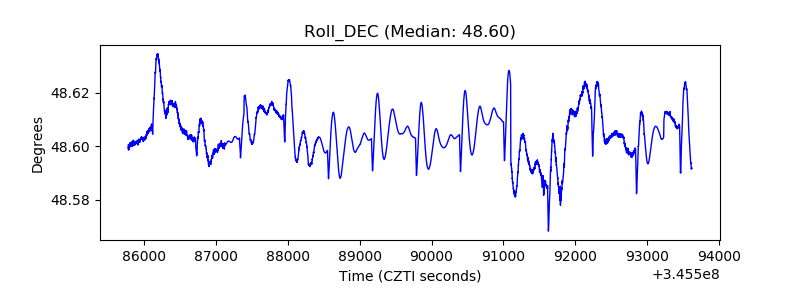 |
| _Roll_RA | 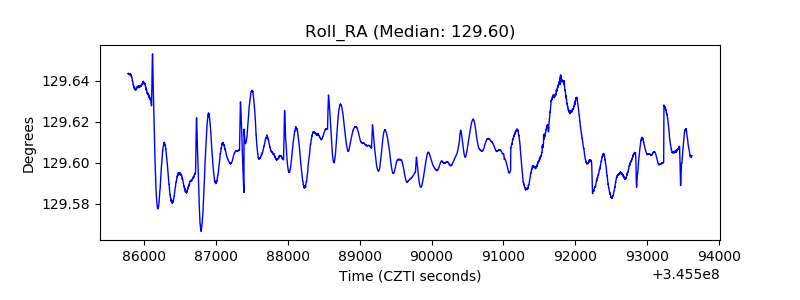 |
| Veto Counter | 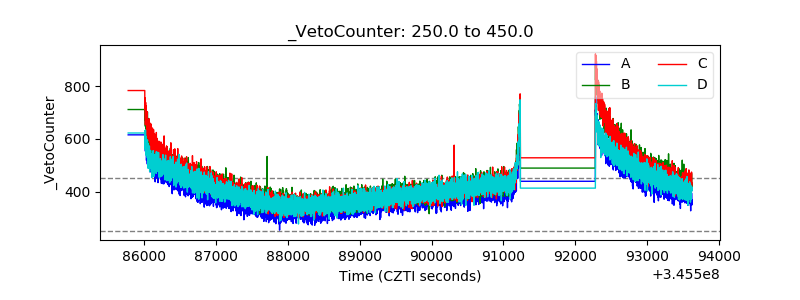 |