| Param | Original file | Final file |
|---|---|---|
| Filename | modeM0/AS1A10_073T05_9000004068_28182cztM0_level2.evt | modeM0/AS1A10_073T05_9000004068_28182cztM0_level2_quad_clean.evt |
| Size (bytes) | 1,356,494,400 | 226,488,960 |
| Size | 1.3 GB | 216.0 MB |
| Events in quadrant A | 7,548,610 | 1,501,716 |
| Events in quadrant B | 7,833,510 | 1,516,836 |
| Events in quadrant C | 9,245,861 | 1,423,341 |
| Events in quadrant D | 15,406,602 | 1,347,088 |
| Mode M0 | |||
|---|---|---|---|
| Quadrant | BADHDUFLAG | Total packets | Discarded packets |
| A | 0 | 32264 | 0 |
| B | 0 | 33074 | 0 |
| C | 0 | 37709 | 0 |
| D | 0 | 56386 | 0 |
| Mode M9 | |||
|---|---|---|---|
| Quadrant | BADHDUFLAG | Total packets | Discarded packets |
| A | 0 | 37 | 0 |
| B | 0 | 37 | 0 |
| C | 0 | 37 | 0 |
| D | 0 | 37 | 0 |
| Quadrant | Total seconds | Saturated seconds | Saturation percentage |
|---|---|---|---|
| A | 15515 | 39 | 0.251370% |
| B | 15515 | 103 | 0.663874% |
| C | 15515 | 707 | 4.556880% |
| D | 15515 | 2203 | 14.199162% |
Noise dominated data is calculated using 1-second bins in cleaned event files. If a bin has >2000 counts, and if more than 50% of those come from <1% of pixels, then it is considered to be noise-dominated and hence unusable.
| Quadrant | # 1 sec bins | Bins with >0 counts | Bins with >2000 counts | High rate bins dominated by noise | Noise dominated (total time) | Noise dominated (detector-on time) | Marked lightcurve |
|---|---|---|---|---|---|---|---|
| A | 19261 | 15518 | 1 | 1 | 0.01% | 0.01% | 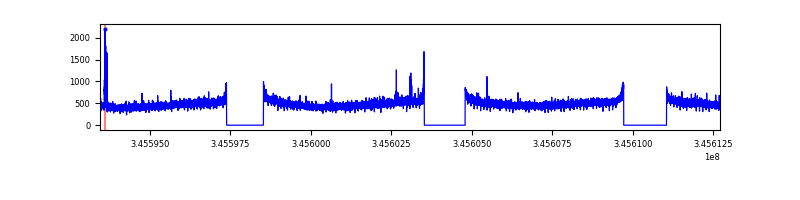 |
| B | 19261 | 15518 | 21 | 21 | 0.11% | 0.14% | 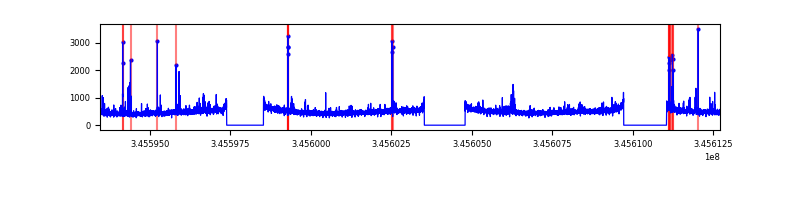 |
| C | 19261 | 15518 | 419 | 419 | 2.18% | 2.70% | 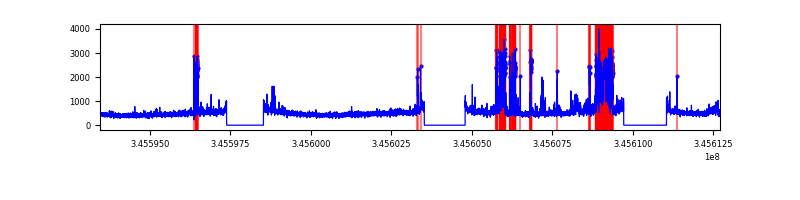 |
| D | 19261 | 15518 | 1996 | 1996 | 10.36% | 12.86% | 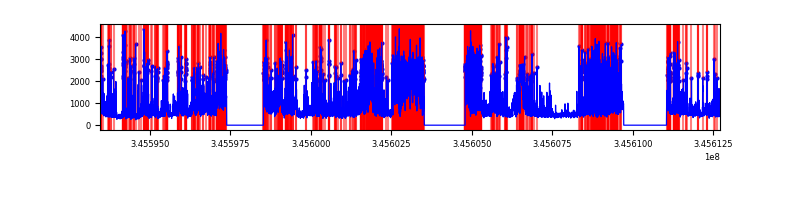 |
Top three noisy pixels from each quadrant. If the there are fewer than three noisy pixels in the level2.evt file, extra rows are filled as -1
| Pixel properties | Quadrant properties | ||||||
|---|---|---|---|---|---|---|---|
| Quadrant | DetID | PixID | Counts | Sigma | Mean | Median | Sigma |
| A | 15 | 174 | 53374 | 135.11 | 1936 | 1903 | 381.0 |
| A | 5 | 98 | 27844 | 68.09 | 1936 | 1903 | 381.0 |
| A | 13 | 254 | 23305 | 56.18 | 1936 | 1903 | 381.0 |
| B | 10 | 245 | 172715 | 483.94 | 1915 | 1870 | 353.0 |
| B | 10 | 246 | 68747 | 189.44 | 1915 | 1870 | 353.0 |
| B | 12 | 111 | 43178 | 117.01 | 1915 | 1870 | 353.0 |
| C | 3 | 233 | 1862861 | 4529.53 | 1798 | 1811 | 410.9 |
| C | 14 | 238 | 296259 | 716.64 | 1798 | 1811 | 410.9 |
| C | 15 | 208 | 42486 | 99.0 | 1798 | 1811 | 410.9 |
| D | 1 | 52 | 6329647 | 15717.35 | 1728 | 1687 | 402.6 |
| D | 7 | 80 | 857817 | 2126.45 | 1728 | 1687 | 402.6 |
| D | 8 | 195 | 659887 | 1634.83 | 1728 | 1687 | 402.6 |
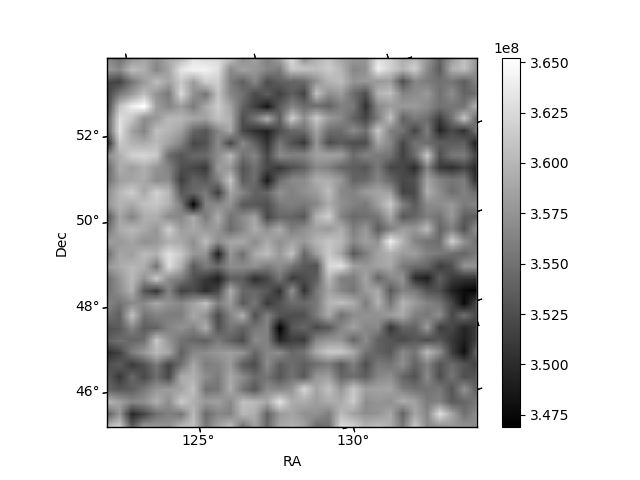
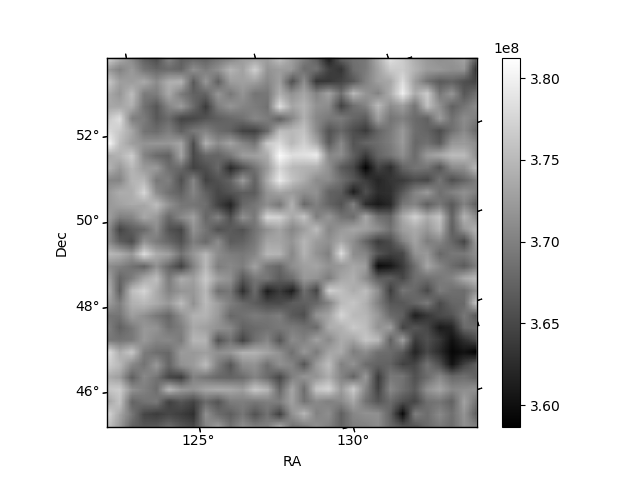
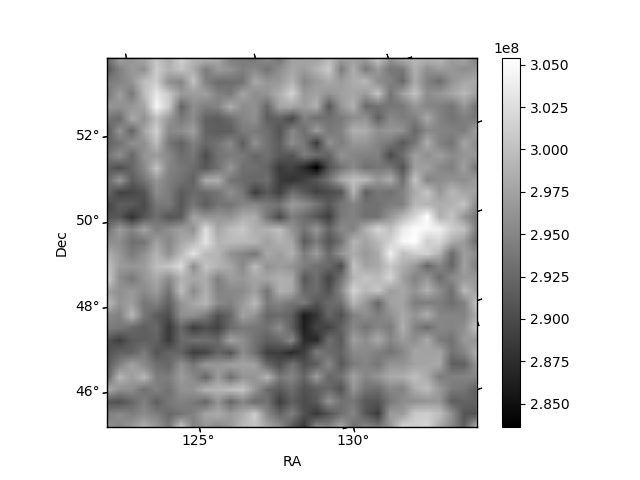
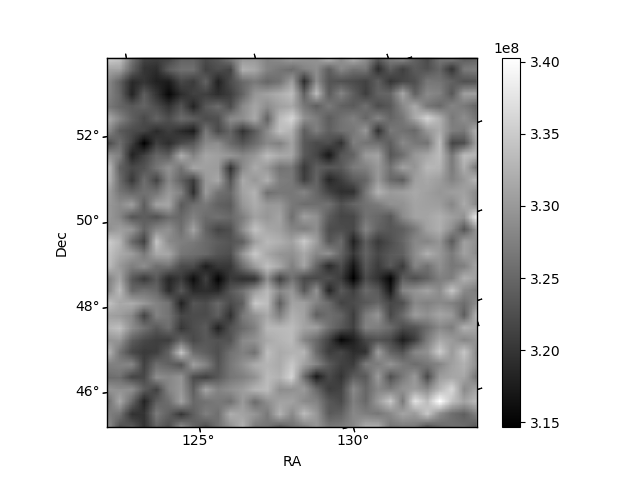
Histogram calculated using DETX and DETY for each event in the final _common_clean file
| Quadrant A | 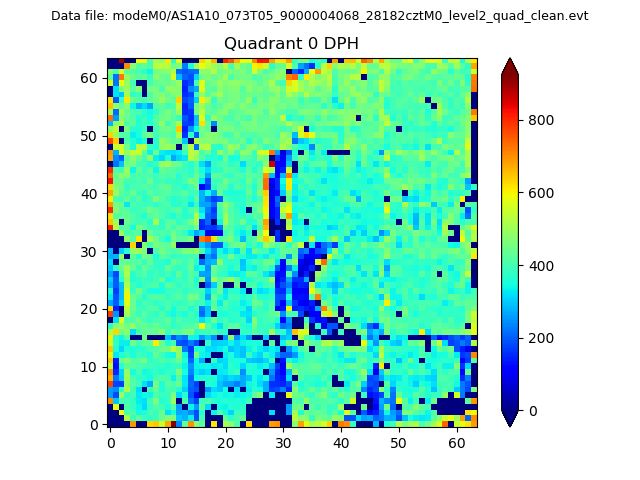 |
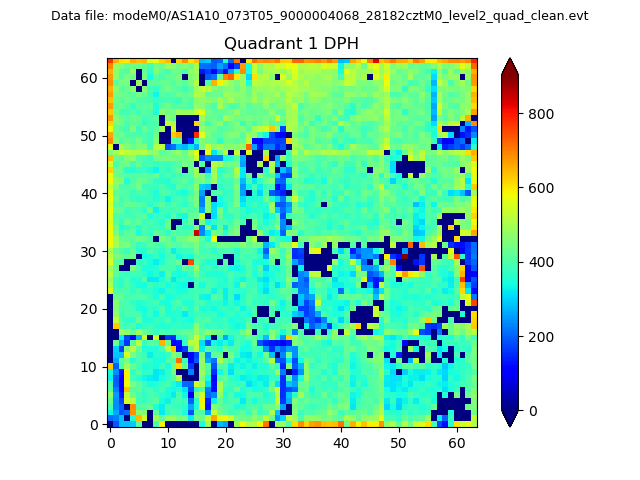 |
Quadrant B |
|---|---|---|---|
| Quadrant D | 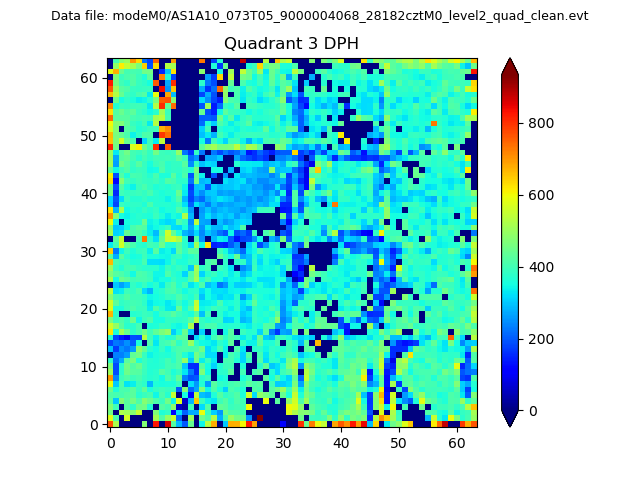 |
 |
Quadrant C |
| Plot type | Count rate plots | Images |
|---|---|---|
| Comparison with Poisson distribution Blue bars denote a histogram of data divided into 1 sec bins. Red curve is a Poisson curve with rate = median count rate of data. |
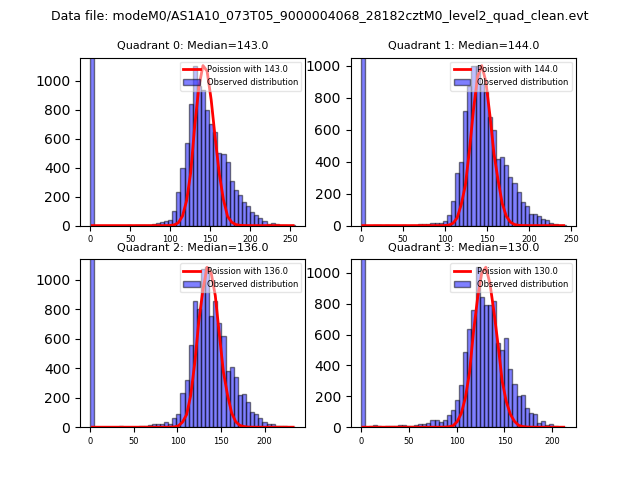 |
 |
| Quadrant-wise count rates Data is divided into 100 sec bins |
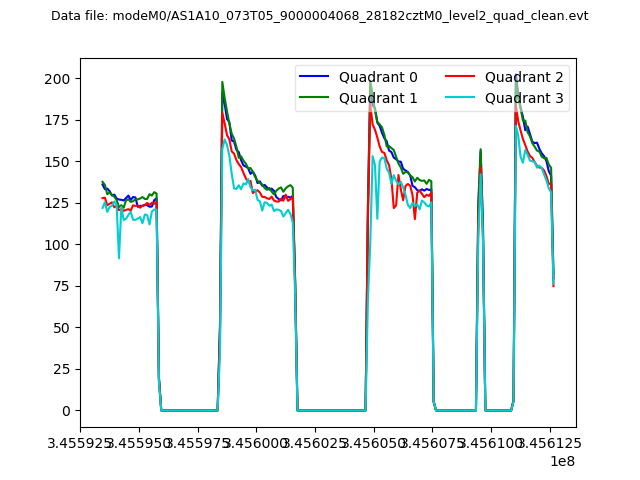 |
|
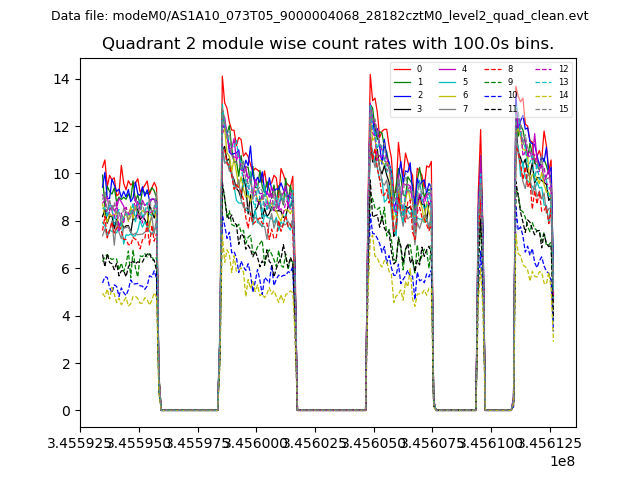
| Module-wise count rates for Quadrant A Data is divided into 100 sec bins |
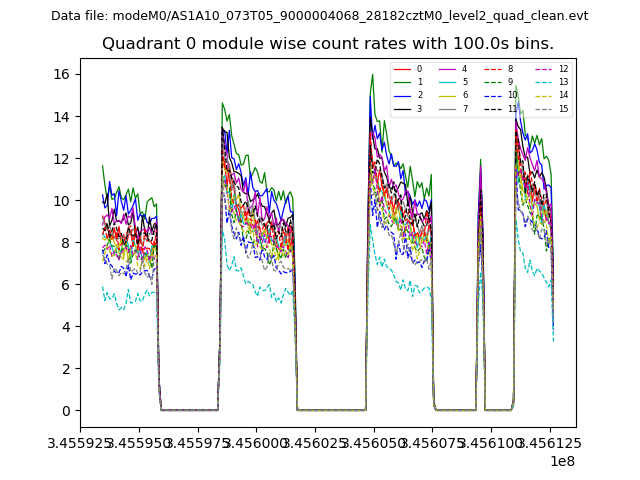 |
 |
| Module-wise count rates for Quadrant B Data is divided into 100 sec bins |
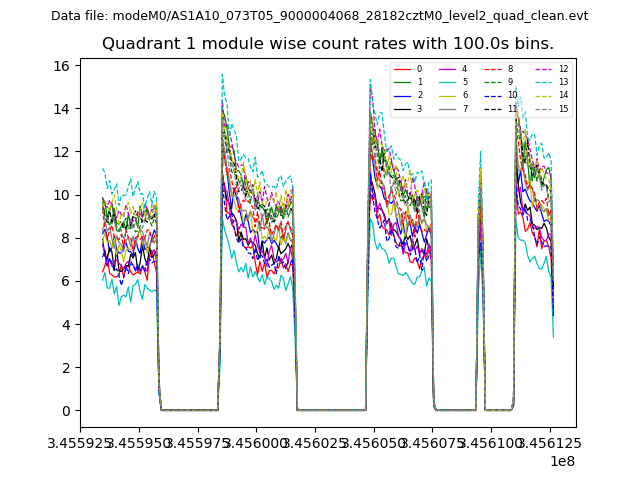 |
 |
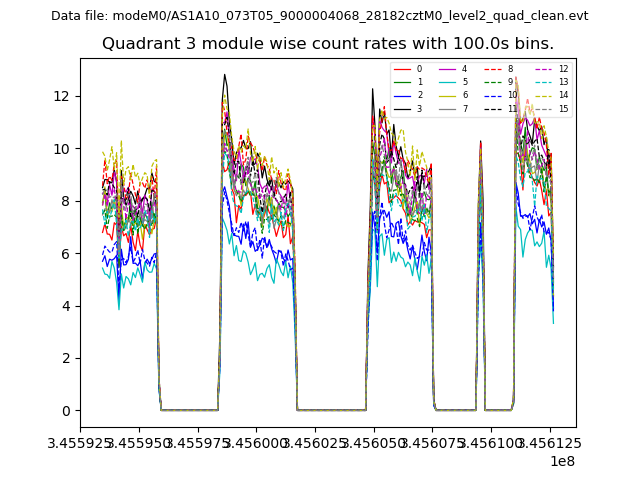
| Module-wise count rates for Quadrant C Data is divided into 100 sec bins |
 |
 |
| Module-wise count rates for Quadrant D Data is divided into 100 sec bins |
 |
 |
| Parameter | Plot |
|---|---|
| CZT HV Monitor | 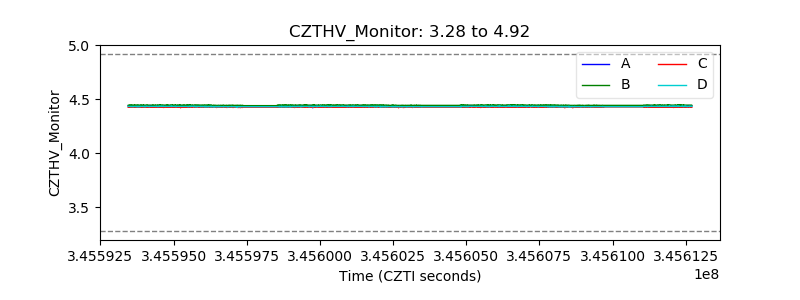 |
| D_VDD | 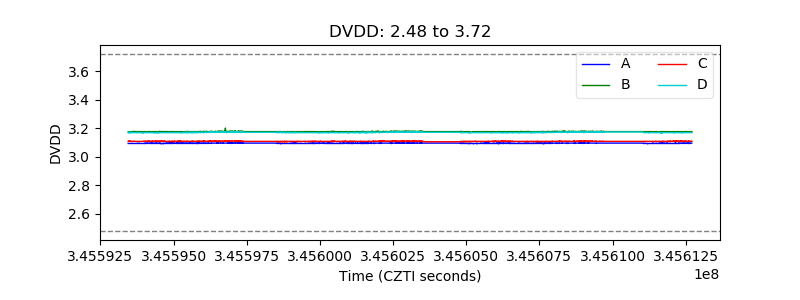 |
| Temperature 1 | 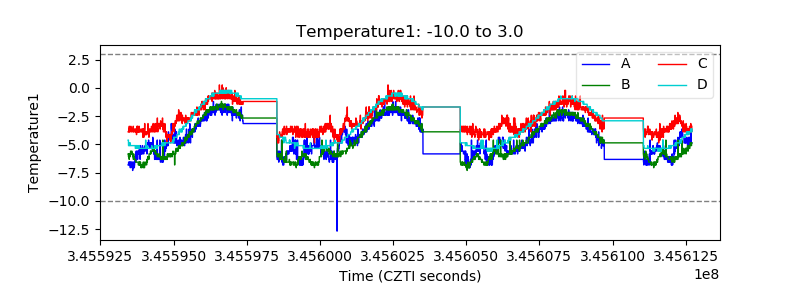 |
| Veto HV Monitor | 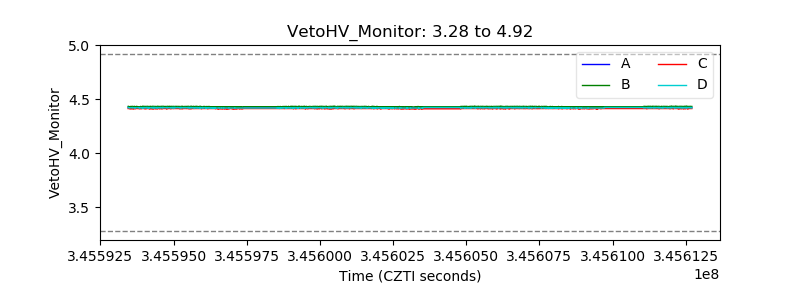 |
| Veto LLD | 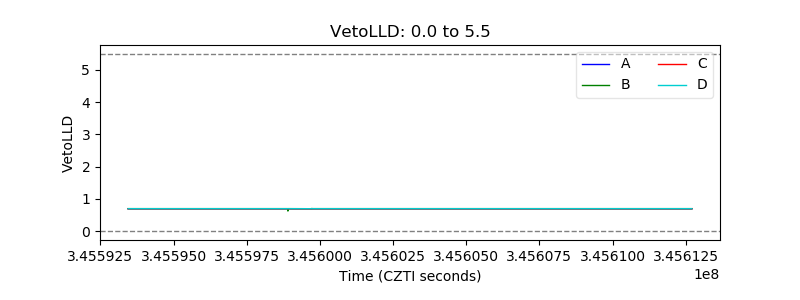 |
| Alpha Counter | 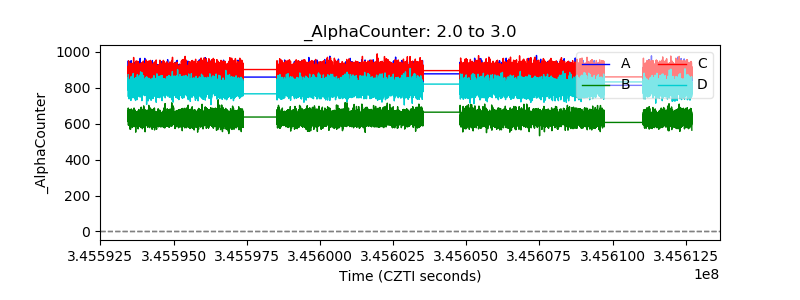 |
| _CPM_Rate | 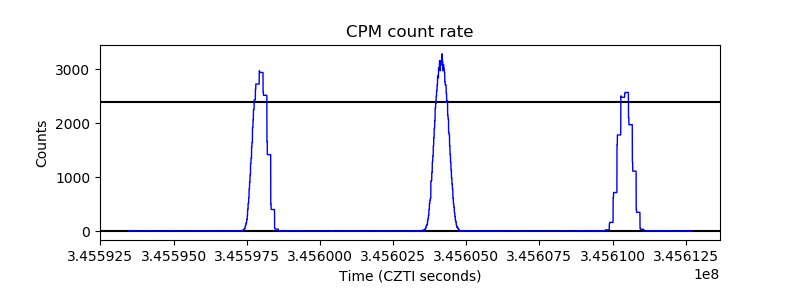 |
| CZT Counter |  |
| +2.5 Volts monitor |  |
| +5 Volts monitor |  |
| _ROLL_ROT | 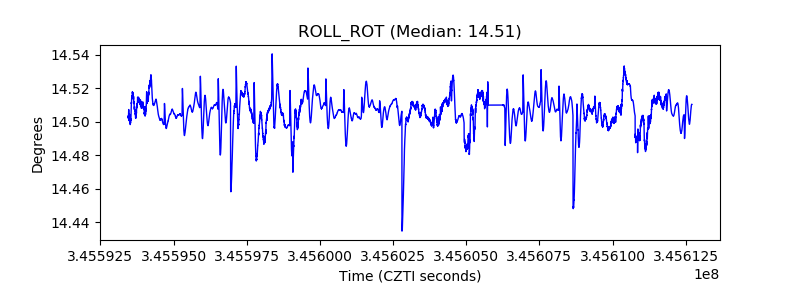 |
| _Roll_DEC | 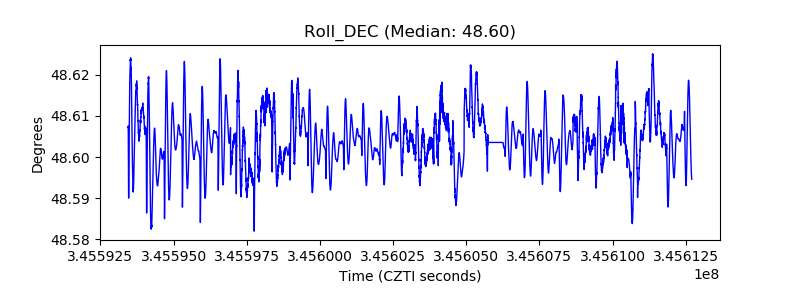 |
| _Roll_RA | 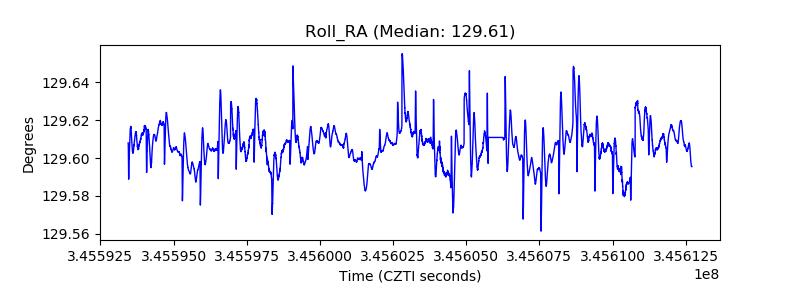 |
| Veto Counter | 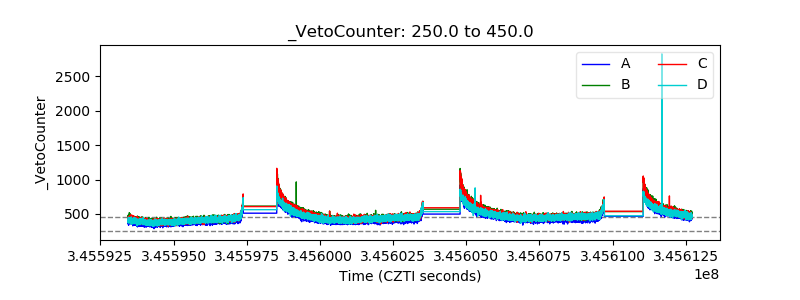 |