| Param | Original file | Final file |
|---|---|---|
| Filename | modeM0/AS1A10_073T05_9000004068_28183cztM0_level2.evt | modeM0/AS1A10_073T05_9000004068_28183cztM0_level2_quad_clean.evt |
| Size (bytes) | 531,141,120 | 106,220,160 |
| Size | 506.5 MB | 101.3 MB |
| Events in quadrant A | 3,289,338 | 722,211 |
| Events in quadrant B | 3,605,408 | 720,750 |
| Events in quadrant C | 3,490,818 | 674,861 |
| Events in quadrant D | 5,257,886 | 644,215 |
| Mode M0 | |||
|---|---|---|---|
| Quadrant | BADHDUFLAG | Total packets | Discarded packets |
| A | 0 | 13540 | 0 |
| B | 0 | 14604 | 0 |
| C | 0 | 14376 | 0 |
| D | 0 | 19879 | 0 |
| Mode M9 | |||
|---|---|---|---|
| Quadrant | BADHDUFLAG | Total packets | Discarded packets |
| A | 0 | 13 | 0 |
| B | 0 | 14 | 0 |
| C | 0 | 14 | 0 |
| D | 0 | 14 | 0 |
| Quadrant | Total seconds | Saturated seconds | Saturation percentage |
|---|---|---|---|
| A | 6516 | 53 | 0.813382% |
| B | 6516 | 125 | 1.918355% |
| C | 6516 | 97 | 1.488643% |
| D | 6516 | 494 | 7.581338% |
Noise dominated data is calculated using 1-second bins in cleaned event files. If a bin has >2000 counts, and if more than 50% of those come from <1% of pixels, then it is considered to be noise-dominated and hence unusable.
| Quadrant | # 1 sec bins | Bins with >0 counts | Bins with >2000 counts | High rate bins dominated by noise | Noise dominated (total time) | Noise dominated (detector-on time) | Marked lightcurve |
|---|---|---|---|---|---|---|---|
| A | 7786 | 6517 | 0 | 0 | 0.00% | 0.00% | 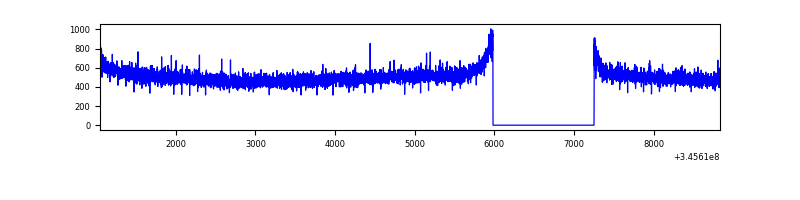 |
| B | 7786 | 6517 | 32 | 32 | 0.41% | 0.49% | 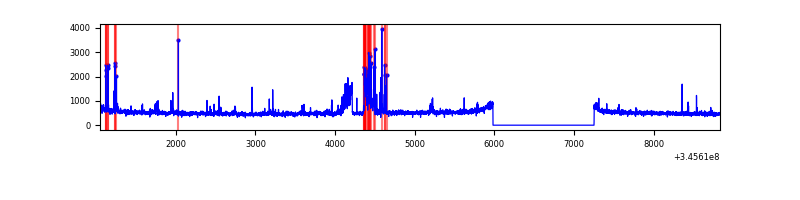 |
| C | 7786 | 6517 | 4 | 4 | 0.05% | 0.06% | 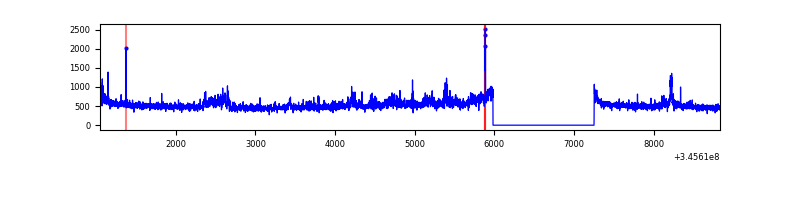 |
| D | 7786 | 6517 | 422 | 422 | 5.42% | 6.48% | 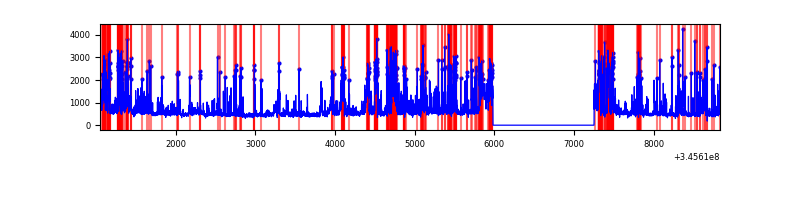 |
Top three noisy pixels from each quadrant. If the there are fewer than three noisy pixels in the level2.evt file, extra rows are filled as -1
| Pixel properties | Quadrant properties | ||||||
|---|---|---|---|---|---|---|---|
| Quadrant | DetID | PixID | Counts | Sigma | Mean | Median | Sigma |
| A | 13 | 254 | 9838 | 53.37 | 852 | 838 | 168.6 |
| A | 3 | 137 | 7581 | 39.99 | 852 | 838 | 168.6 |
| A | 0 | 226 | 7557 | 39.84 | 852 | 838 | 168.6 |
| B | 15 | 32 | 175281 | 1123.79 | 834 | 815 | 155.2 |
| B | 10 | 246 | 116230 | 743.42 | 834 | 815 | 155.2 |
| B | 12 | 111 | 18307 | 112.67 | 834 | 815 | 155.2 |
| C | 3 | 233 | 257057 | 1413.88 | 793 | 799 | 181.2 |
| C | 14 | 238 | 131661 | 722.02 | 793 | 799 | 181.2 |
| C | 2 | 16 | 7072 | 34.61 | 793 | 799 | 181.2 |
| D | 1 | 52 | 1403048 | 7663.67 | 784 | 766 | 183.0 |
| D | 5 | 222 | 259665 | 1414.92 | 784 | 766 | 183.0 |
| D | 2 | 250 | 245020 | 1334.88 | 784 | 766 | 183.0 |
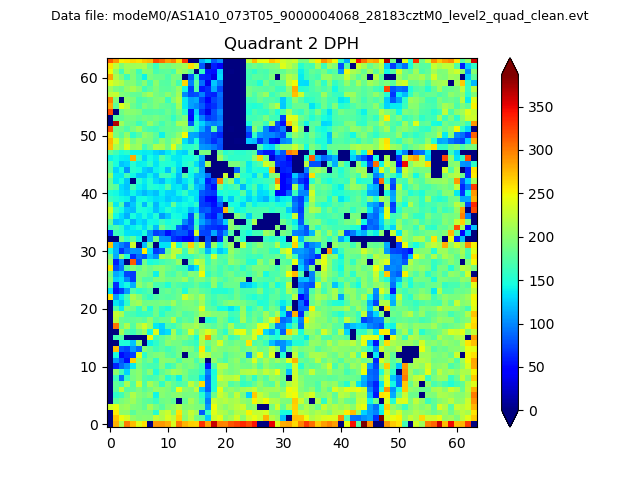
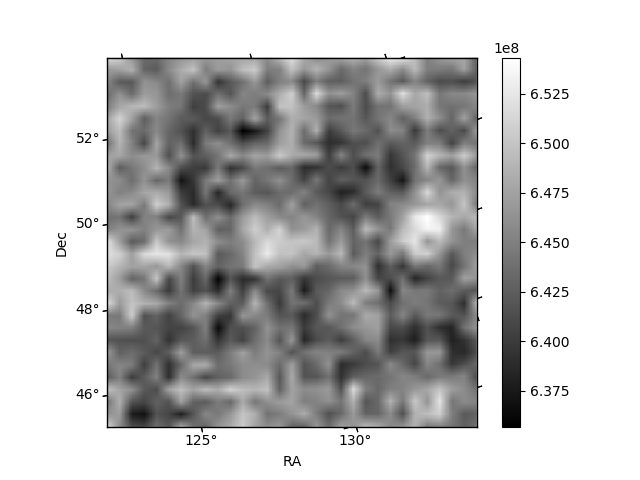
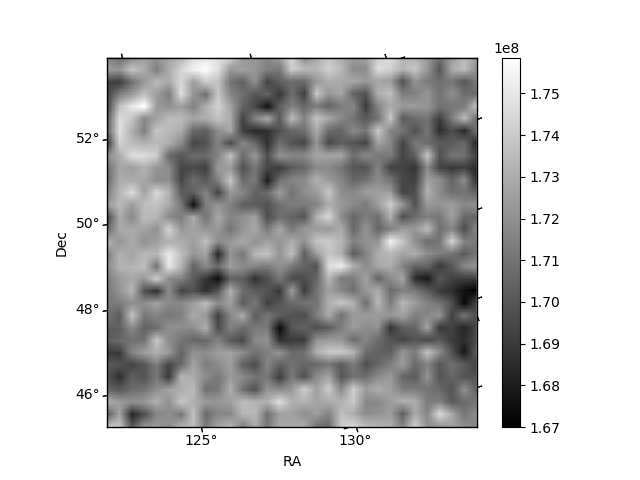
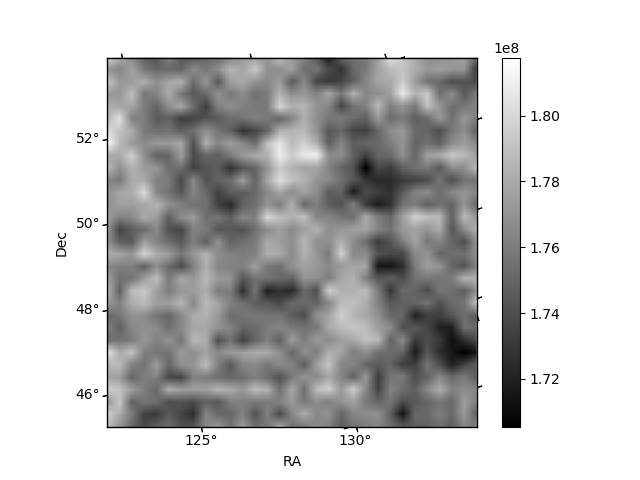
Histogram calculated using DETX and DETY for each event in the final _common_clean file
| Quadrant A | 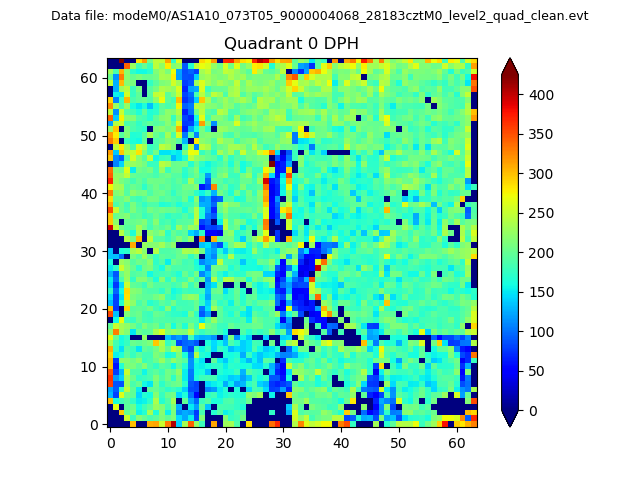 |
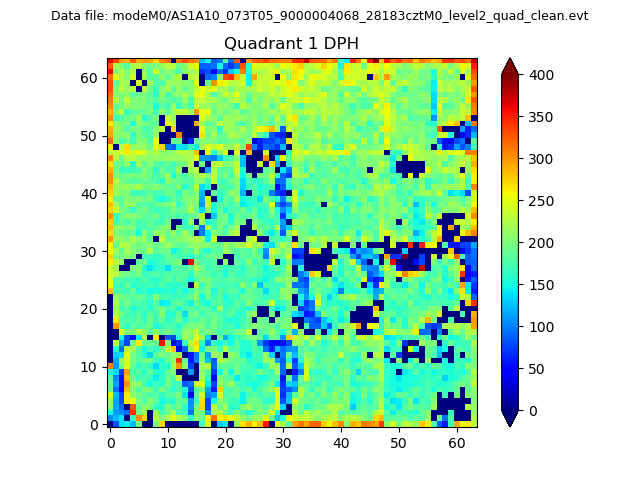 |
Quadrant B |
|---|---|---|---|
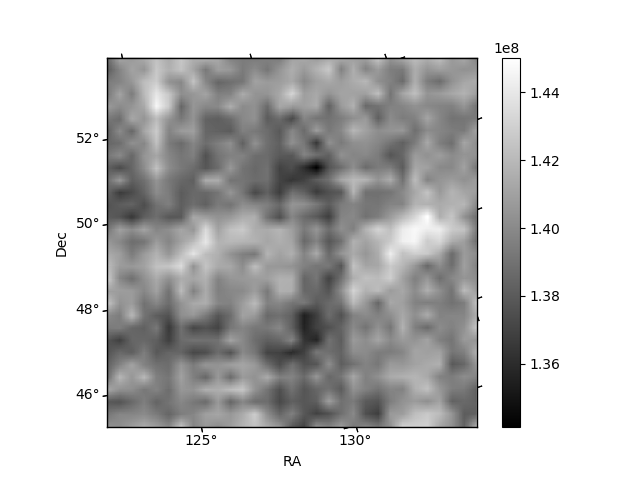
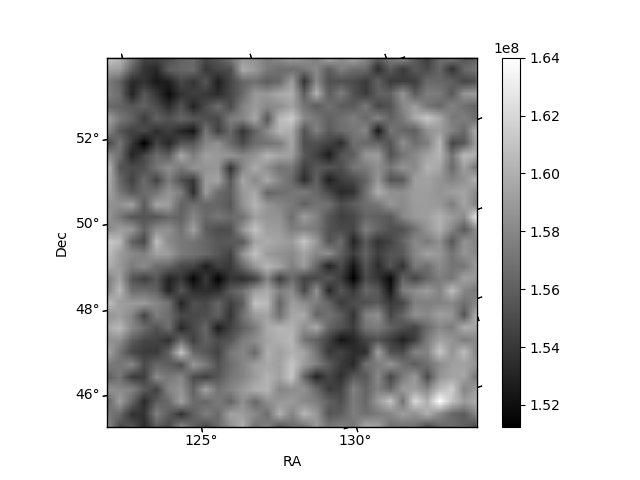
| Quadrant D | 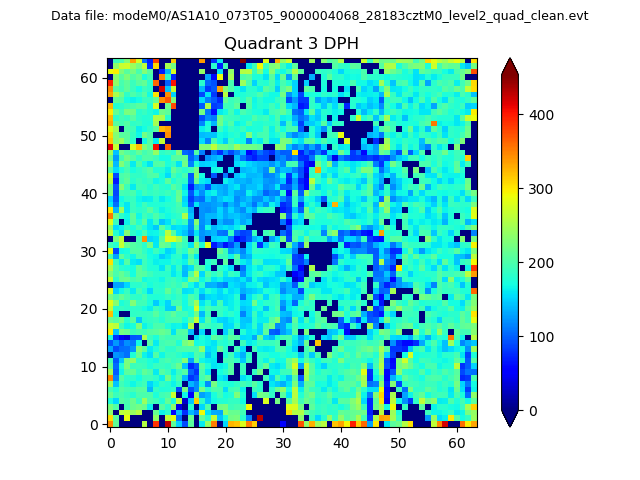 |
 |
Quadrant C |
| Plot type | Count rate plots | Images |
|---|---|---|
| Comparison with Poisson distribution Blue bars denote a histogram of data divided into 1 sec bins. Red curve is a Poisson curve with rate = median count rate of data. |
 |
 |
| Quadrant-wise count rates Data is divided into 100 sec bins |
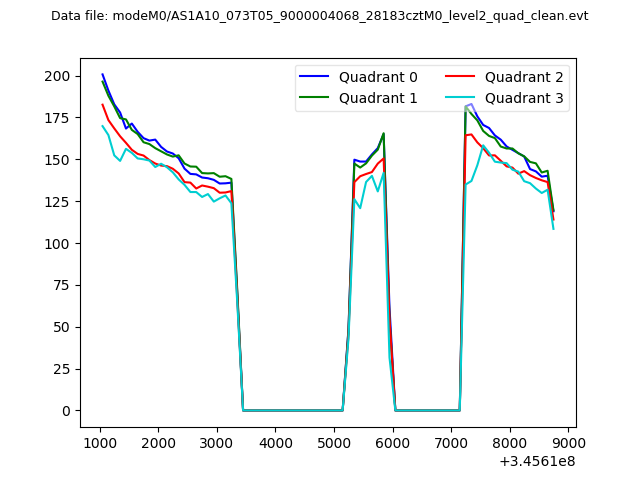 |
|
| Module-wise count rates for Quadrant A Data is divided into 100 sec bins |
 |
 |
| Module-wise count rates for Quadrant B Data is divided into 100 sec bins |
 |
 |
| Module-wise count rates for Quadrant C Data is divided into 100 sec bins |
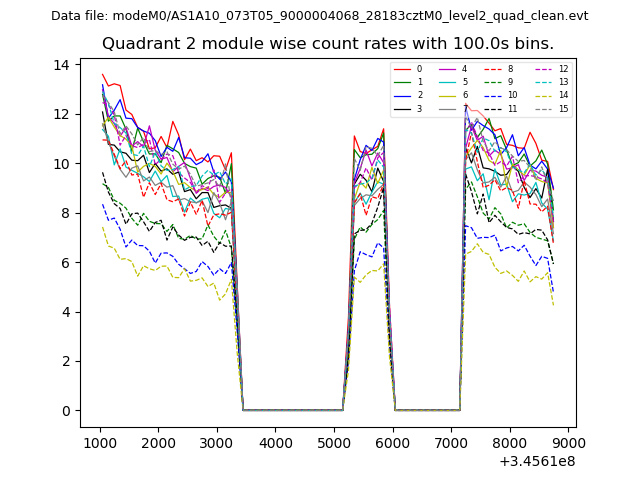 |
 |
| Module-wise count rates for Quadrant D Data is divided into 100 sec bins |
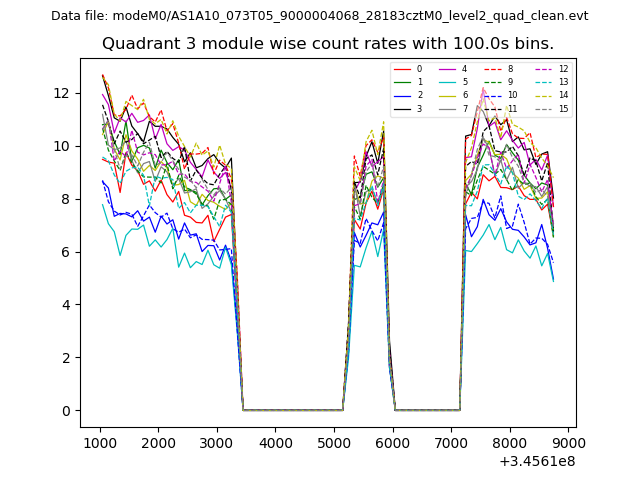 |
 |
| Parameter | Plot |
|---|---|
| CZT HV Monitor | 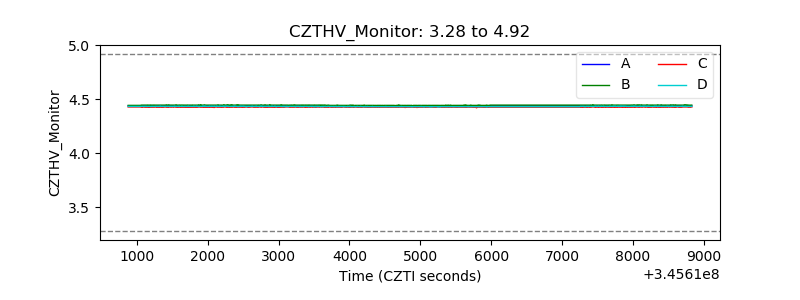 |
| D_VDD | 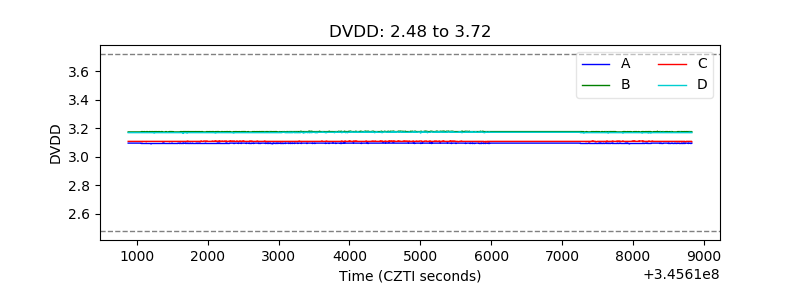 |
| Temperature 1 |  |
| Veto HV Monitor | 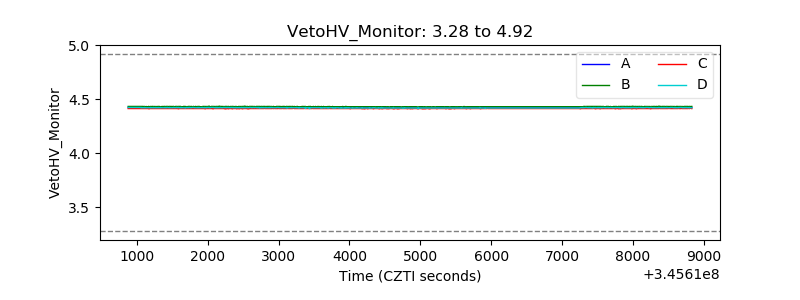 |
| Veto LLD | 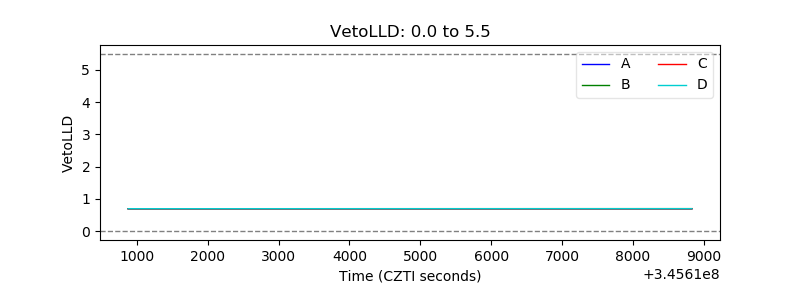 |
| Alpha Counter | 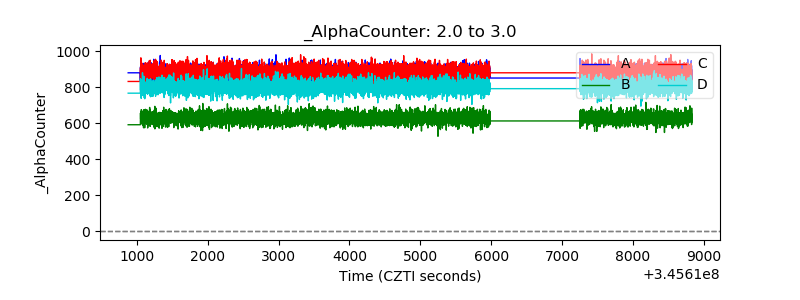 |
| _CPM_Rate | 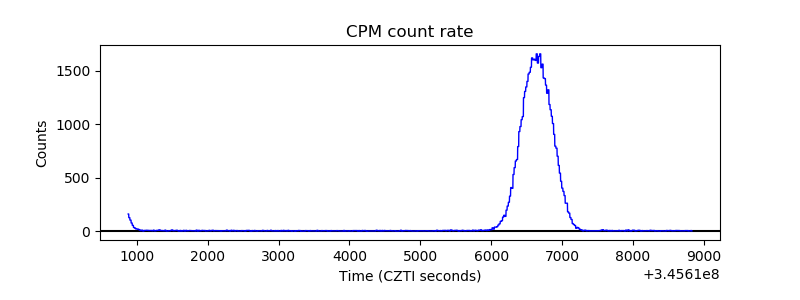 |
| CZT Counter | 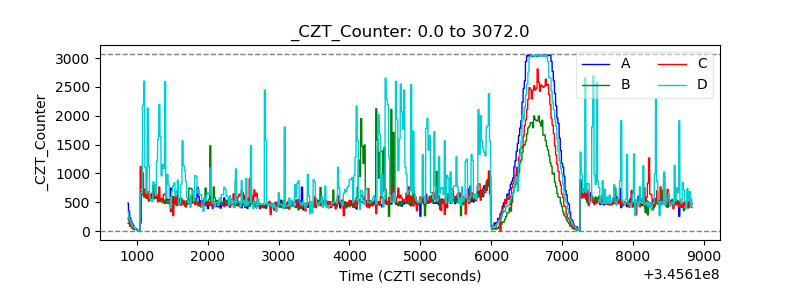 |
| +2.5 Volts monitor |  |
| +5 Volts monitor |  |
| _ROLL_ROT |  |
| _Roll_DEC | 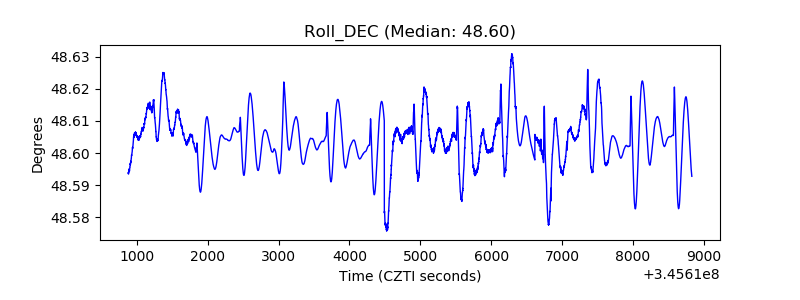 |
| _Roll_RA | 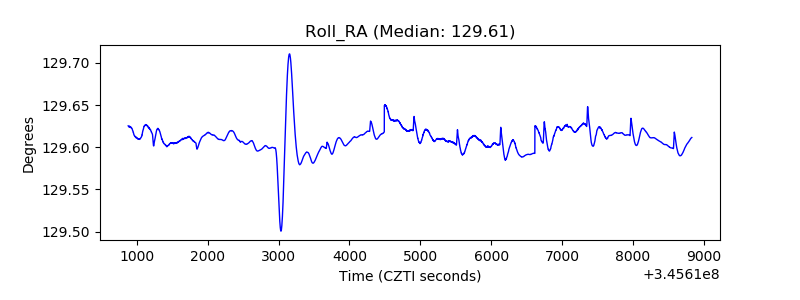 |
| Veto Counter | 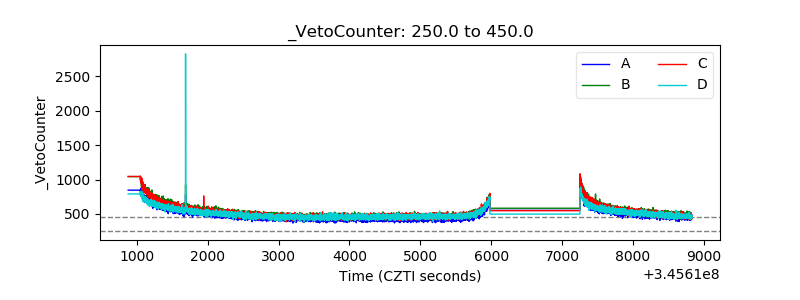 |