| Param | Original file | Final file |
|---|---|---|
| Filename | modeM0/AS1A10_073T05_9000004068_28184cztM0_level2.evt | modeM0/AS1A10_073T05_9000004068_28184cztM0_level2_quad_clean.evt |
| Size (bytes) | 468,313,920 | 97,240,320 |
| Size | 446.6 MB | 92.7 MB |
| Events in quadrant A | 3,105,613 | 646,458 |
| Events in quadrant B | 3,328,571 | 646,751 |
| Events in quadrant C | 3,130,765 | 609,282 |
| Events in quadrant D | 4,191,015 | 603,603 |
| Mode M0 | |||
|---|---|---|---|
| Quadrant | BADHDUFLAG | Total packets | Discarded packets |
| A | 0 | 12906 | 0 |
| B | 0 | 13659 | 0 |
| C | 0 | 13125 | 0 |
| D | 0 | 16498 | 0 |
| Mode M9 | |||
|---|---|---|---|
| Quadrant | BADHDUFLAG | Total packets | Discarded packets |
| A | 0 | 12 | 0 |
| B | 0 | 12 | 0 |
| C | 0 | 12 | 0 |
| D | 0 | 12 | 0 |
| Quadrant | Total seconds | Saturated seconds | Saturation percentage |
|---|---|---|---|
| A | 6294 | 53 | 0.842072% |
| B | 6294 | 82 | 1.302828% |
| C | 6294 | 77 | 1.223387% |
| D | 6294 | 188 | 2.986972% |
Noise dominated data is calculated using 1-second bins in cleaned event files. If a bin has >2000 counts, and if more than 50% of those come from <1% of pixels, then it is considered to be noise-dominated and hence unusable.
| Quadrant | # 1 sec bins | Bins with >0 counts | Bins with >2000 counts | High rate bins dominated by noise | Noise dominated (total time) | Noise dominated (detector-on time) | Marked lightcurve |
|---|---|---|---|---|---|---|---|
| A | 7479 | 6294 | 0 | 0 | 0.00% | 0.00% | 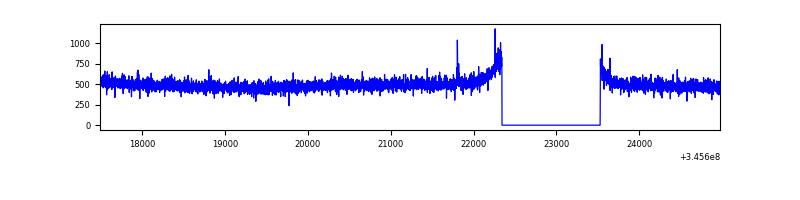 |
| B | 7479 | 6295 | 6 | 6 | 0.08% | 0.10% | 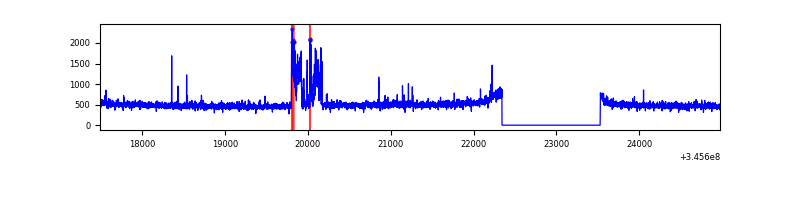 |
| C | 7479 | 6295 | 4 | 4 | 0.05% | 0.06% | 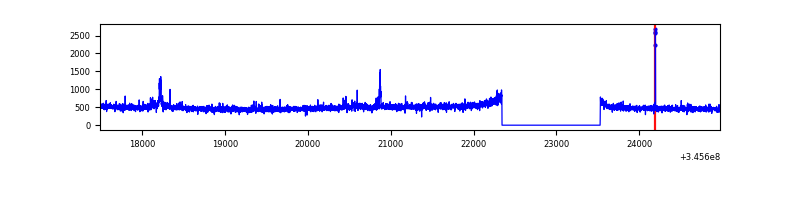 |
| D | 7479 | 6295 | 175 | 175 | 2.34% | 2.78% | 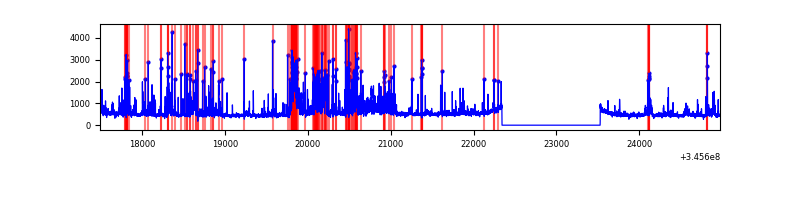 |
Top three noisy pixels from each quadrant. If the there are fewer than three noisy pixels in the level2.evt file, extra rows are filled as -1
| Pixel properties | Quadrant properties | ||||||
|---|---|---|---|---|---|---|---|
| Quadrant | DetID | PixID | Counts | Sigma | Mean | Median | Sigma |
| A | 13 | 254 | 10160 | 58.48 | 802 | 787 | 160.3 |
| A | 3 | 137 | 7233 | 40.22 | 802 | 787 | 160.3 |
| A | 0 | 226 | 6952 | 38.47 | 802 | 787 | 160.3 |
| B | 15 | 32 | 222899 | 1503.42 | 785 | 768 | 147.8 |
| B | 12 | 111 | 17774 | 115.1 | 785 | 768 | 147.8 |
| B | 11 | 111 | 16290 | 105.06 | 785 | 768 | 147.8 |
| C | 14 | 238 | 123900 | 721.85 | 746 | 752 | 170.6 |
| C | 3 | 233 | 80519 | 467.57 | 746 | 752 | 170.6 |
| C | 15 | 208 | 16598 | 92.88 | 746 | 752 | 170.6 |
| D | 1 | 52 | 698279 | 3854.17 | 760 | 740 | 181.0 |
| D | 2 | 250 | 260692 | 1436.33 | 760 | 740 | 181.0 |
| D | 5 | 222 | 196317 | 1080.64 | 760 | 740 | 181.0 |
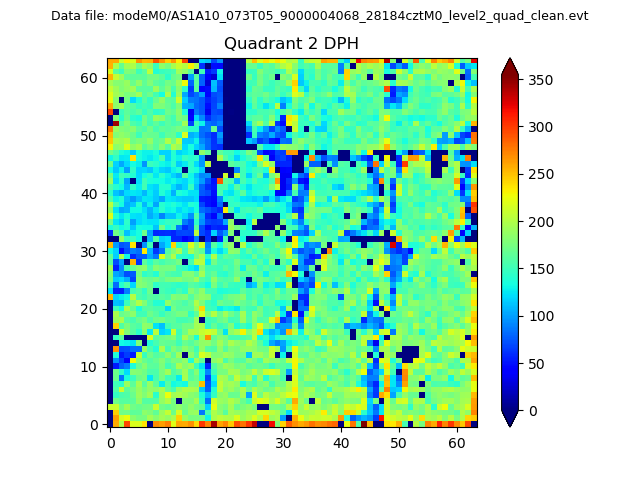
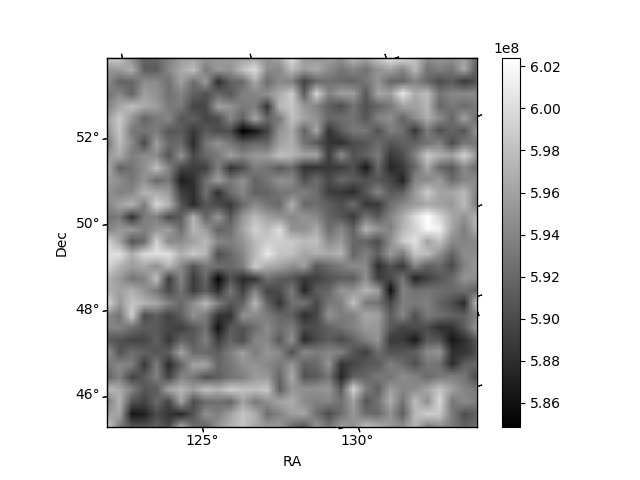
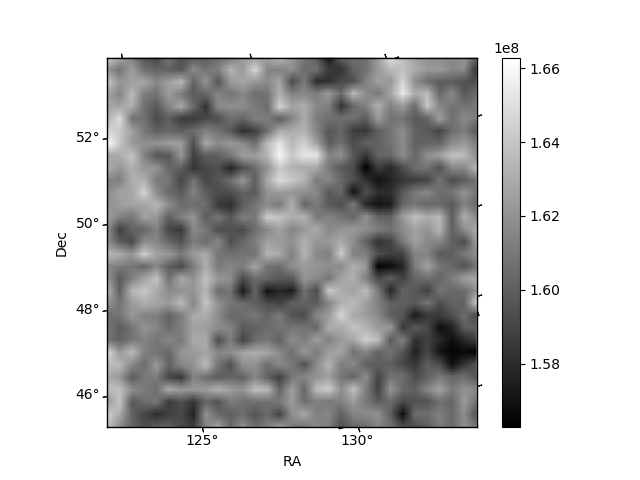
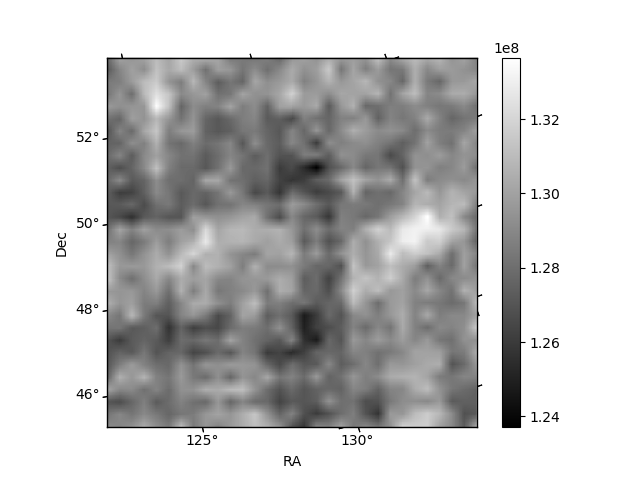
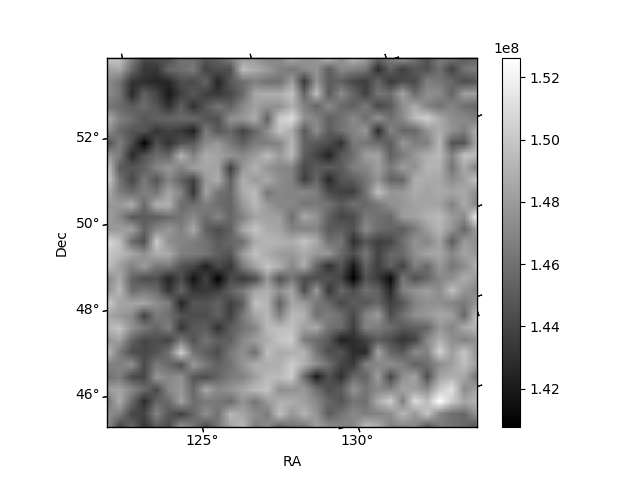
Histogram calculated using DETX and DETY for each event in the final _common_clean file
| Quadrant A | 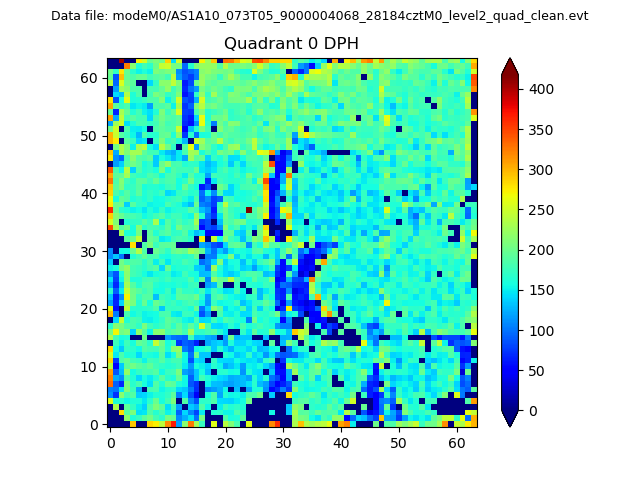 |
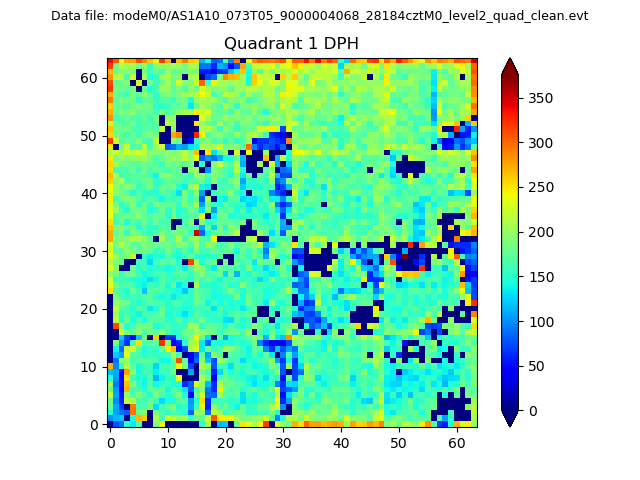 |
Quadrant B |
|---|---|---|---|
| Quadrant D | 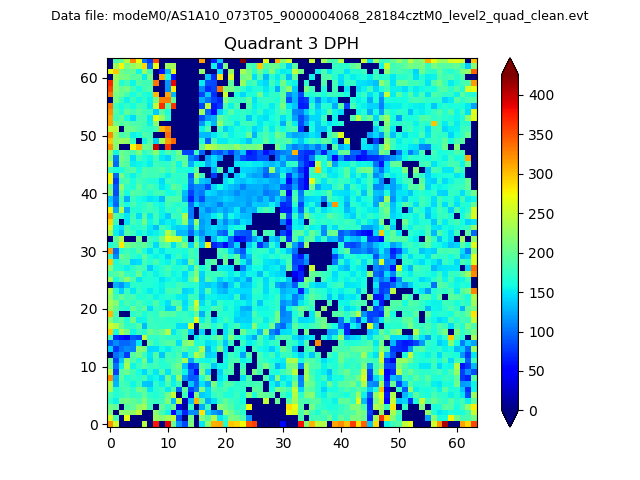 |
 |
Quadrant C |
| Plot type | Count rate plots | Images |
|---|---|---|
| Comparison with Poisson distribution Blue bars denote a histogram of data divided into 1 sec bins. Red curve is a Poisson curve with rate = median count rate of data. |
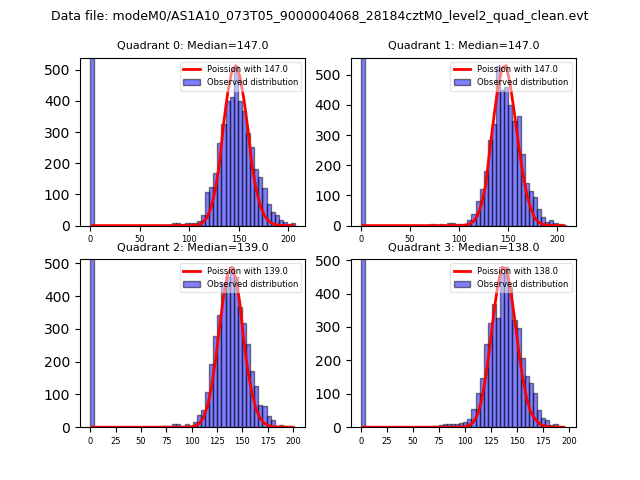 |
 |
| Quadrant-wise count rates Data is divided into 100 sec bins |
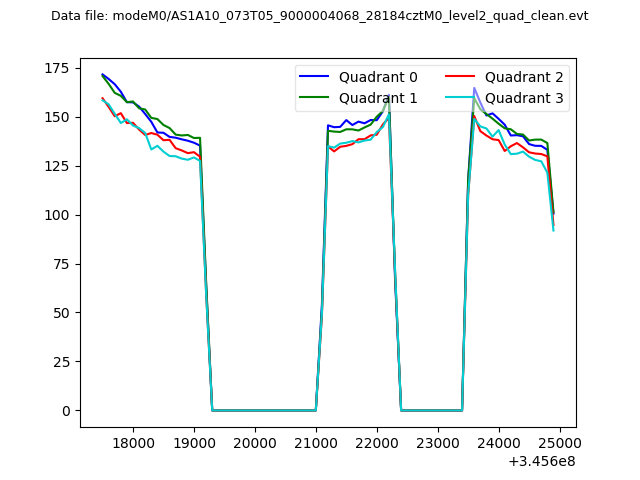 |
|
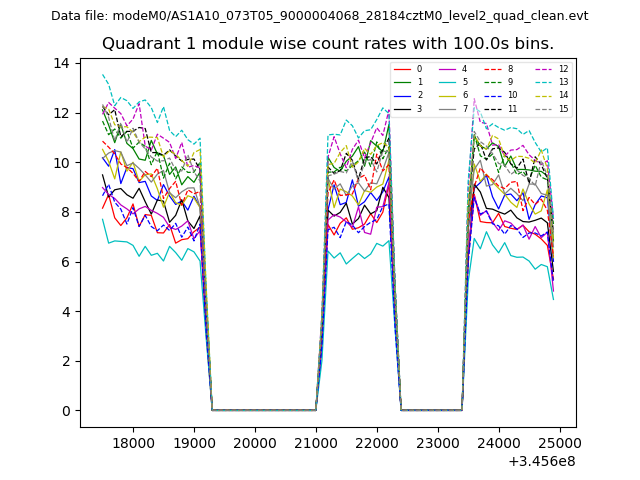
| Module-wise count rates for Quadrant A Data is divided into 100 sec bins |
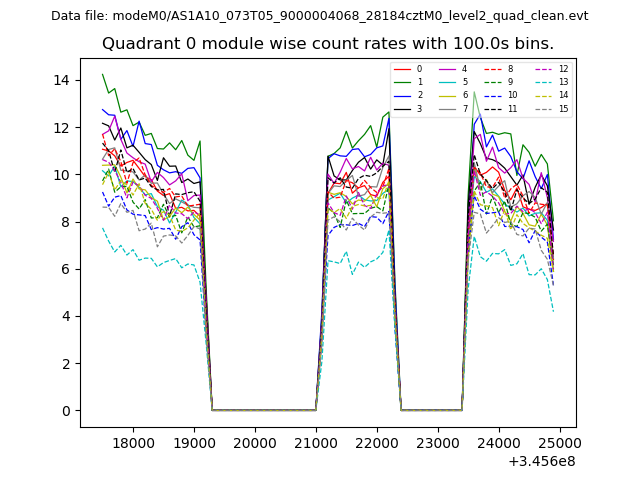 |
 |
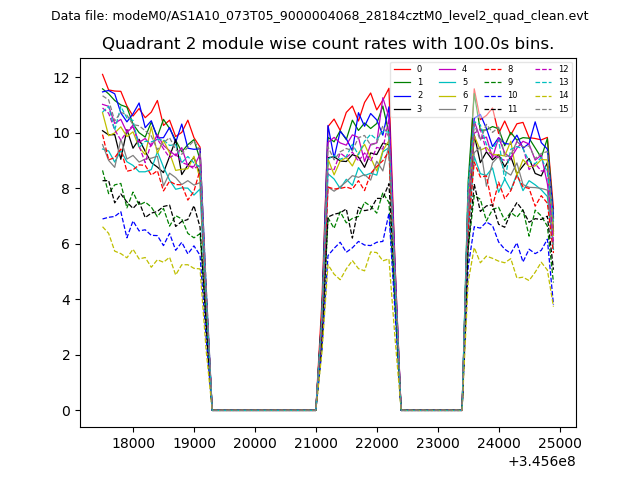
| Module-wise count rates for Quadrant B Data is divided into 100 sec bins |
 |
 |
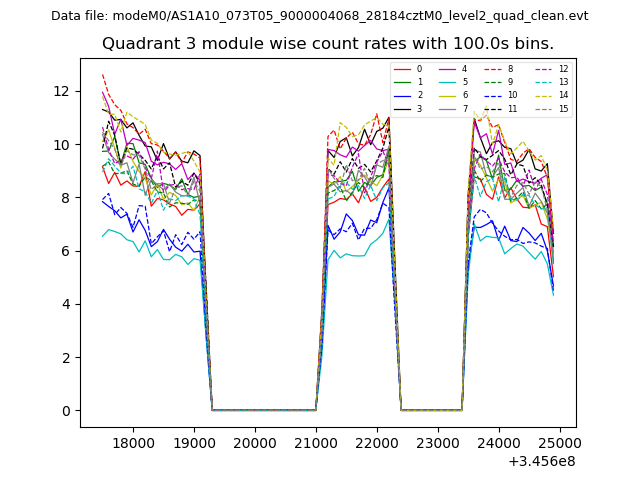
| Module-wise count rates for Quadrant C Data is divided into 100 sec bins |
 |
 |
| Module-wise count rates for Quadrant D Data is divided into 100 sec bins |
 |
 |
| Parameter | Plot |
|---|---|
| CZT HV Monitor | 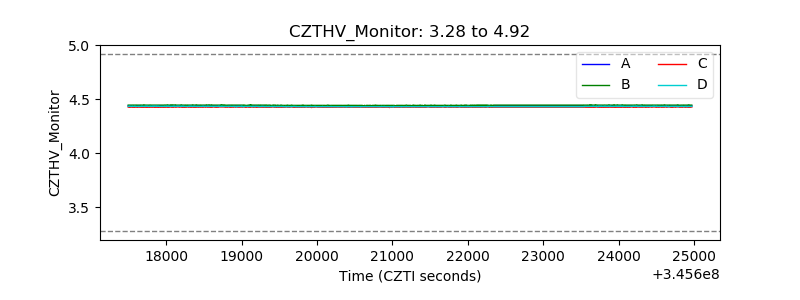 |
| D_VDD |  |
| Temperature 1 |  |
| Veto HV Monitor | 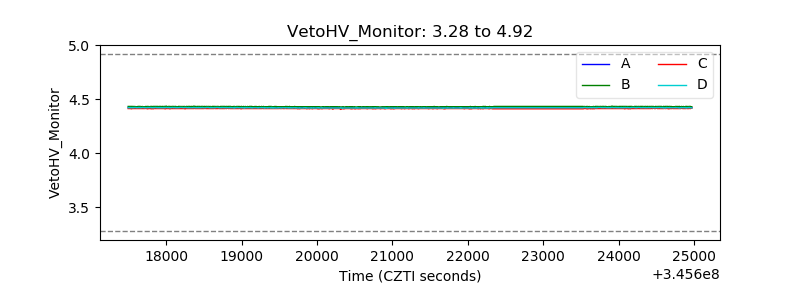 |
| Veto LLD | 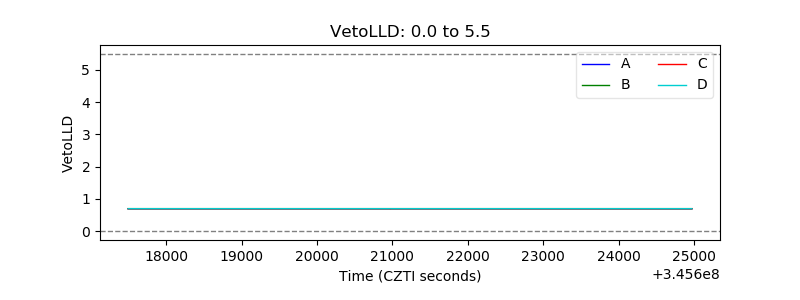 |
| Alpha Counter | 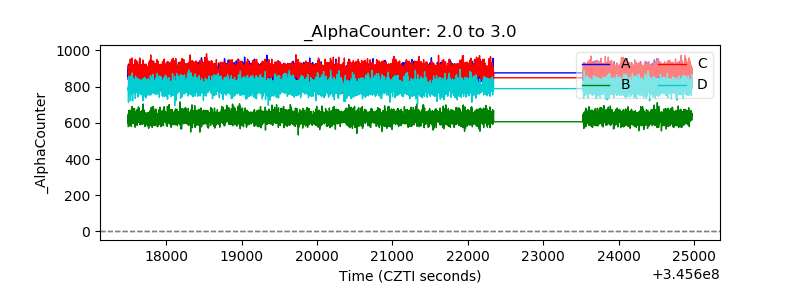 |
| _CPM_Rate | 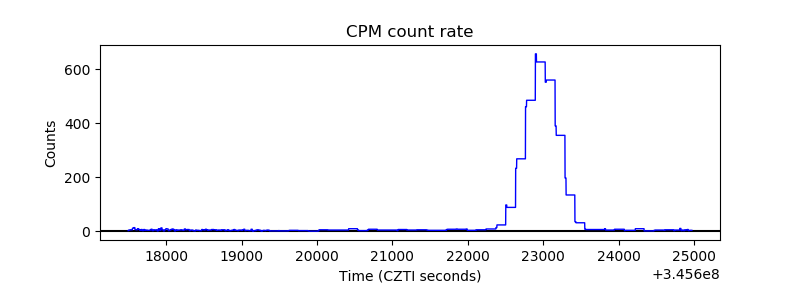 |
| CZT Counter | 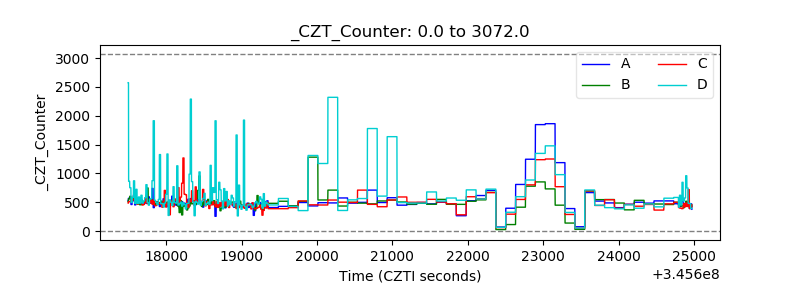 |
| +2.5 Volts monitor |  |
| +5 Volts monitor | 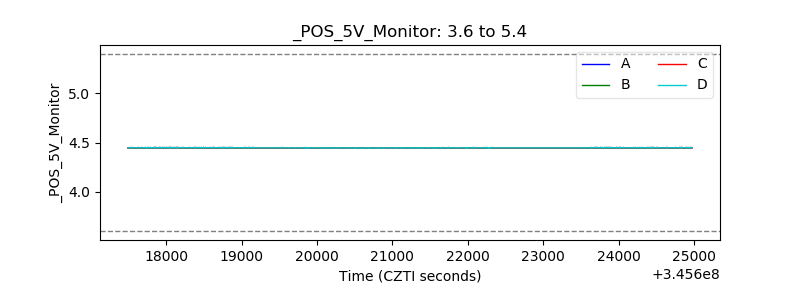 |
| _ROLL_ROT | 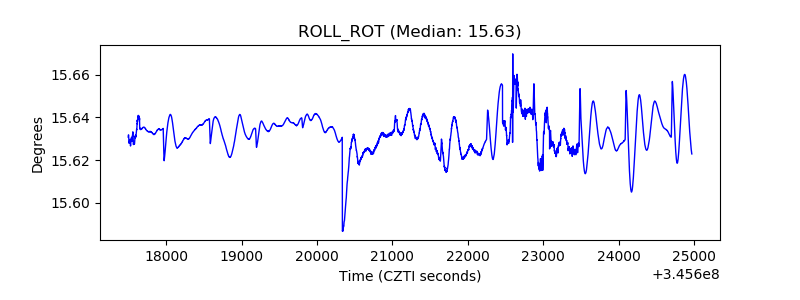 |
| _Roll_DEC | 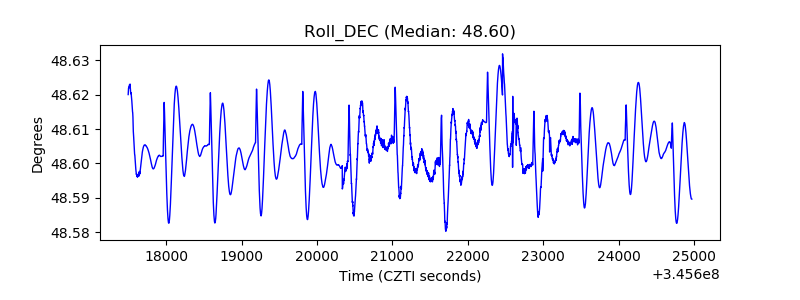 |
| _Roll_RA | 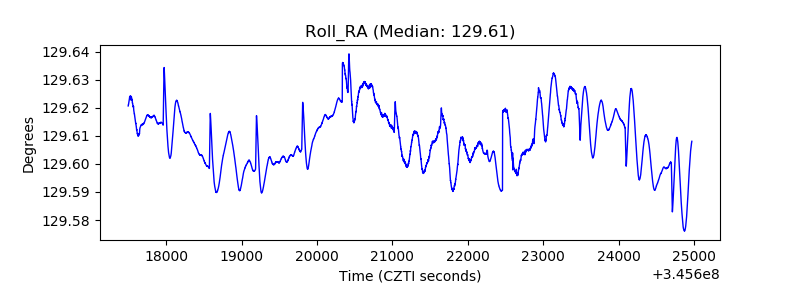 |
| Veto Counter | 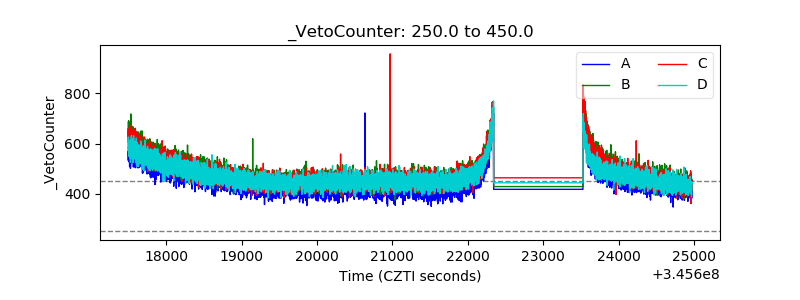 |