| Param | Original file | Final file |
|---|---|---|
| Filename | modeM0/AS1A10_090T16_9000004070cztM0_level2.fits | modeM0/AS1A10_090T16_9000004070cztM0_level2_quad_clean.evt |
| Size (bytes) | 391,069,440 | 408,640,320 |
| Size | 373.0 MB | 389.7 MB |
| Events in quadrant A | 2,431,558 | 2,578,089 |
| Events in quadrant B | 2,336,698 | 2,575,143 |
| Events in quadrant C | 2,351,460 | 2,435,403 |
| Events in quadrant D | 1,844,244 | 1,910,857 |
| Mode SS | |||
|---|---|---|---|
| Quadrant | BADHDUFLAG | Total packets | Discarded packets |
| A | 0 | 858 | 0 |
| B | 0 | 858 | 0 |
| C | 0 | 858 | 0 |
| D | 0 | 858 | 0 |
| Mode M0 | |||
|---|---|---|---|
| Quadrant | BADHDUFLAG | Total packets | Discarded packets |
| A | 0 | 86958 | 0 |
| B | 0 | 88227 | 0 |
| C | 0 | 88996 | 0 |
| D | 0 | 160129 | 0 |
| Mode M9 | |||
|---|---|---|---|
| Quadrant | BADHDUFLAG | Total packets | Discarded packets |
| A | 0 | 55 | 0 |
| B | 0 | 55 | 0 |
| C | 0 | 55 | 0 |
| D | 0 | 55 | 0 |
| Quadrant | Total seconds | Saturated seconds | Saturation percentage |
|---|---|---|---|
| A | 41871 | 468 | 1.117719% |
| B | 41876 | 614 | 1.466234% |
| C | 41872 | 853 | 2.037161% |
| D | 41865 | 7558 | 18.053266% |
Noise dominated data is calculated using 1-second bins in cleaned event files. If a bin has >2000 counts, and if more than 50% of those come from <1% of pixels, then it is considered to be noise-dominated and hence unusable.
| Quadrant | # 1 sec bins | Bins with >0 counts | Bins with >2000 counts | High rate bins dominated by noise | Noise dominated (total time) | Noise dominated (detector-on time) | Marked lightcurve |
|---|---|---|---|---|---|---|---|
| A | 47732 | 41885 | 0 | 0 | 0.00% | 0.00% |  |
| B | 47732 | 41892 | 0 | 0 | 0.00% | 0.00% | 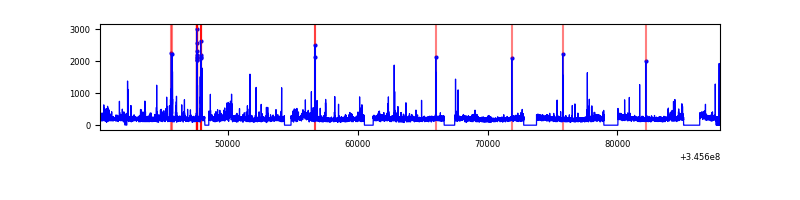 |
| C | 47732 | 41884 | 0 | 0 | 0.00% | 0.00% | 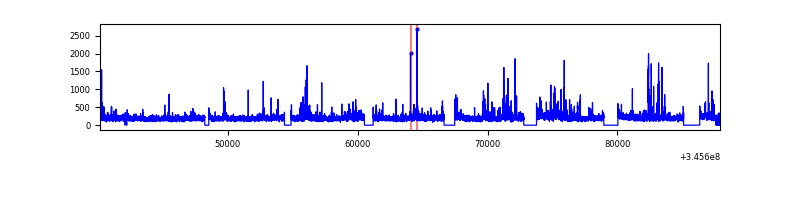 |
| D | 47731 | 41292 | 0 | 0 | 0.00% | 0.00% | 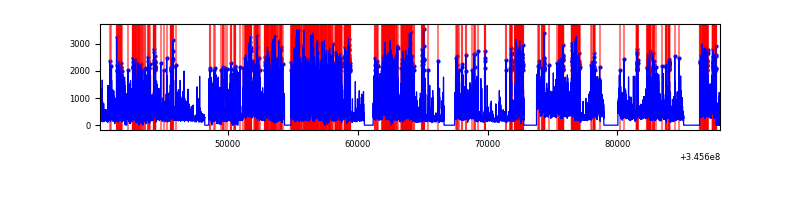 |
Top three noisy pixels from each quadrant. If the there are fewer than three noisy pixels in the level2.evt file, extra rows are filled as -1
| Pixel properties | Quadrant properties | ||||||
|---|---|---|---|---|---|---|---|
| Quadrant | DetID | PixID | Counts | Sigma | Mean | Median | Sigma |
| A | 0 | 29 | 2064 | 9.31 | 633 | 592 | 158.1 |
| A | 7 | 110 | 1899 | 8.27 | 633 | 592 | 158.1 |
| A | 9 | 19 | 1830 | 7.83 | 633 | 592 | 158.1 |
| B | 2 | 9 | 1868 | 10.55 | 616 | 588 | 121.3 |
| B | 2 | 8 | 1577 | 8.15 | 616 | 588 | 121.3 |
| B | 14 | 254 | 1558 | 8.0 | 616 | 588 | 121.3 |
| C | 12 | 241 | 1662 | 6.8 | 622 | 581 | 158.9 |
| C | 9 | 209 | 1618 | 6.52 | 622 | 581 | 158.9 |
| C | 7 | 111 | 1595 | 6.38 | 622 | 581 | 158.9 |
| D | 4 | 246 | 1410 | 6.58 | 525 | 478 | 141.5 |
| D | 6 | 67 | 1303 | 5.83 | 525 | 478 | 141.5 |
| D | 10 | 189 | 1296 | 5.78 | 525 | 478 | 141.5 |
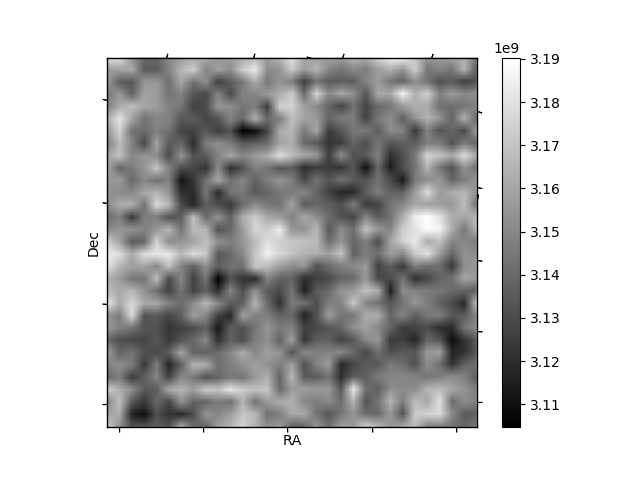
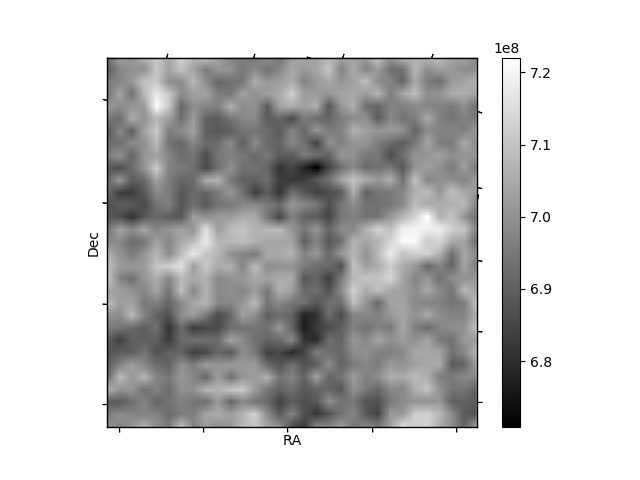
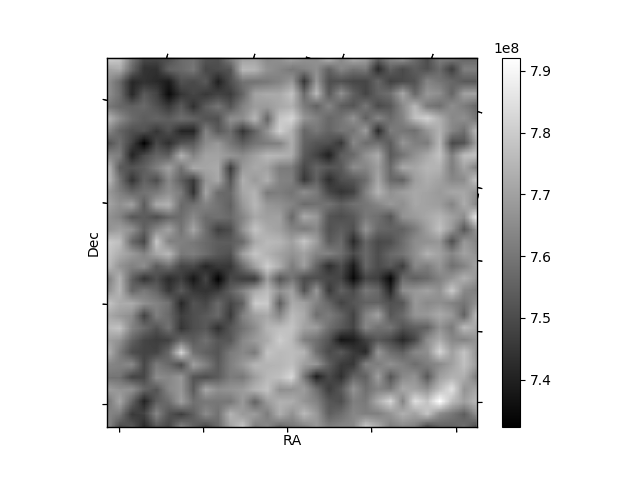
Histogram calculated using DETX and DETY for each event in the final _common_clean file
| Quadrant A |  |
 |
Quadrant B |
|---|---|---|---|
| Quadrant D | 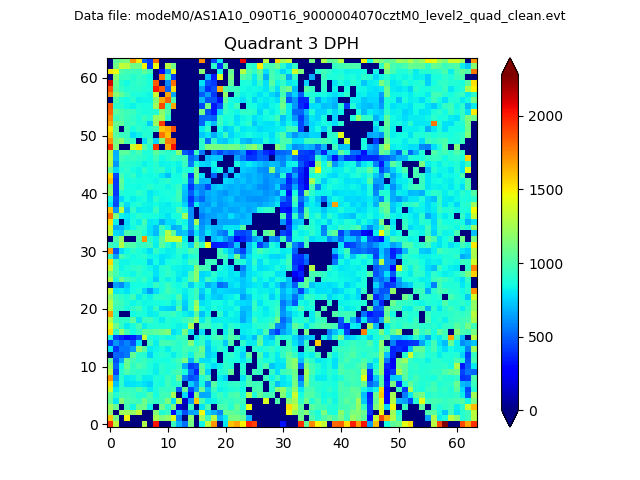 |
 |
Quadrant C |
| Plot type | Count rate plots | Images |
|---|---|---|
| Comparison with Poisson distribution Blue bars denote a histogram of data divided into 1 sec bins. Red curve is a Poisson curve with rate = median count rate of data. |
 |
 |
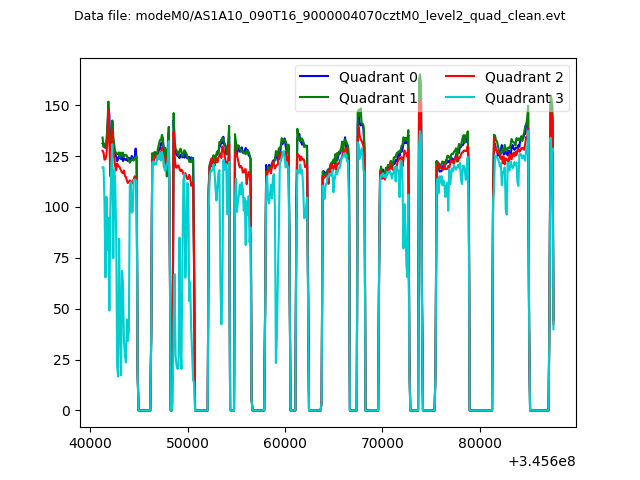
| Quadrant-wise count rates Data is divided into 100 sec bins |
 |
|
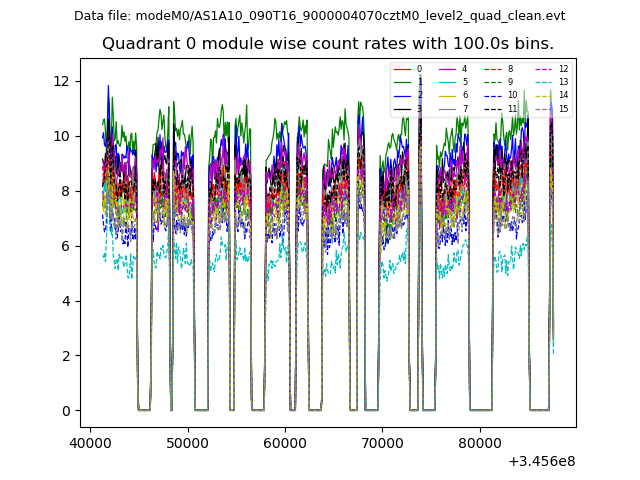
| Module-wise count rates for Quadrant A Data is divided into 100 sec bins |
 |
 |
| Module-wise count rates for Quadrant B Data is divided into 100 sec bins |
 |
 |
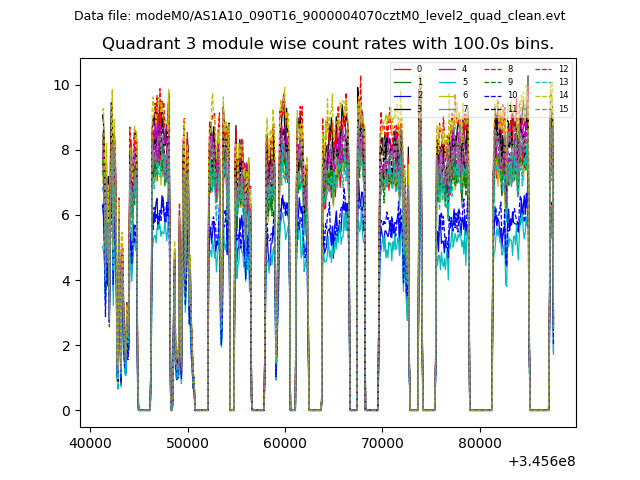
| Module-wise count rates for Quadrant C Data is divided into 100 sec bins |
 |
 |
| Module-wise count rates for Quadrant D Data is divided into 100 sec bins |
 |
 |
| Parameter | Plot |
|---|---|
| CZT HV Monitor |  |
| D_VDD | 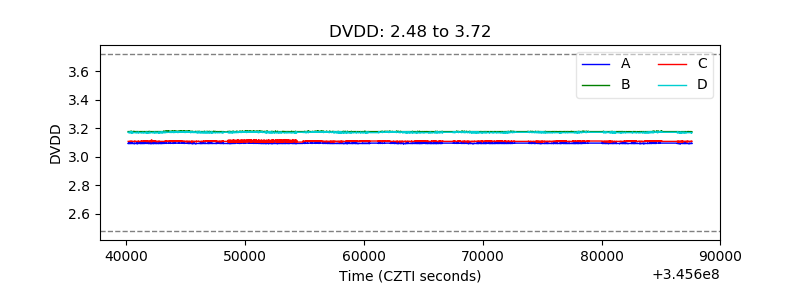 |
| Temperature 1 |  |
| Veto HV Monitor |  |
| Veto LLD | 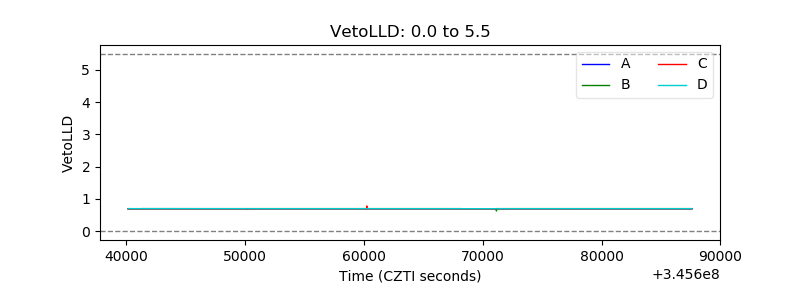 |
| Alpha Counter |  |
| _CPM_Rate |  |
| CZT Counter | 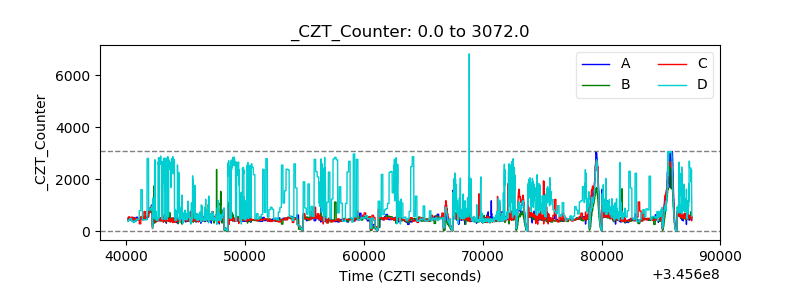 |
| +2.5 Volts monitor |  |
| +5 Volts monitor | 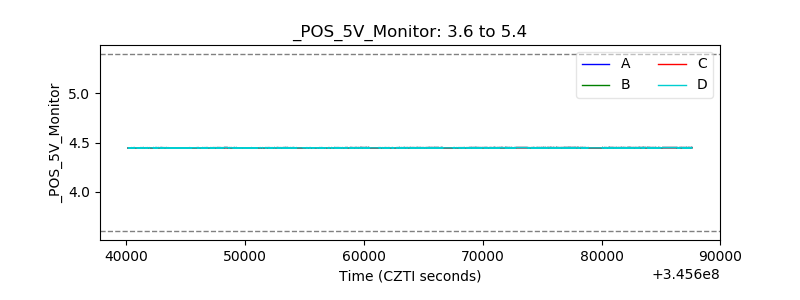 |
| _ROLL_ROT |  |
| _Roll_DEC |  |
| _Roll_RA |  |
| Veto Counter |  |