| Param | Original file | Final file |
|---|---|---|
| Filename | modeM0/AS1A10_090T16_9000004070_28187cztM0_level2.evt | modeM0/AS1A10_090T16_9000004070_28187cztM0_level2_quad_clean.evt |
| Size (bytes) | 339,917,760 | 59,515,200 |
| Size | 324.2 MB | 56.8 MB |
| Events in quadrant A | 1,815,124 | 424,482 |
| Events in quadrant B | 1,855,913 | 429,088 |
| Events in quadrant C | 1,843,098 | 407,952 |
| Events in quadrant D | 4,534,529 | 285,389 |
| Mode M0 | |||
|---|---|---|---|
| Quadrant | BADHDUFLAG | Total packets | Discarded packets |
| A | 0 | 7704 | 0 |
| B | 0 | 7786 | 0 |
| C | 0 | 7767 | 0 |
| D | 0 | 15862 | 0 |
| Quadrant | Total seconds | Saturated seconds | Saturation percentage |
|---|---|---|---|
| A | 3585 | 233 | 6.499303% |
| B | 3585 | 270 | 7.531381% |
| C | 3585 | 260 | 7.252441% |
| D | 3584 | 1314 | 36.662946% |
Noise dominated data is calculated using 1-second bins in cleaned event files. If a bin has >2000 counts, and if more than 50% of those come from <1% of pixels, then it is considered to be noise-dominated and hence unusable.
| Quadrant | # 1 sec bins | Bins with >0 counts | Bins with >2000 counts | High rate bins dominated by noise | Noise dominated (total time) | Noise dominated (detector-on time) | Marked lightcurve |
|---|---|---|---|---|---|---|---|
| A | 3615 | 3587 | 0 | 0 | 0.00% | 0.00% |  |
| B | 3615 | 3587 | 1 | 1 | 0.03% | 0.03% |  |
| C | 3615 | 3587 | 1 | 1 | 0.03% | 0.03% |  |
| D | 3613 | 3585 | 1164 | 1164 | 32.22% | 32.47% | 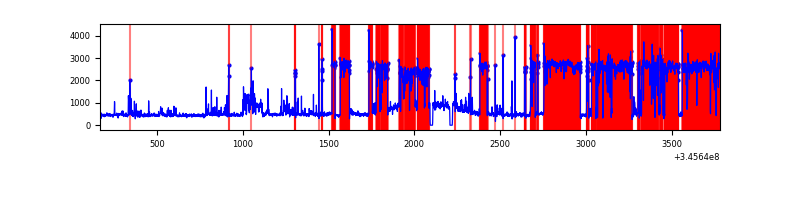 |
Top three noisy pixels from each quadrant. If the there are fewer than three noisy pixels in the level2.evt file, extra rows are filled as -1
| Pixel properties | Quadrant properties | ||||||
|---|---|---|---|---|---|---|---|
| Quadrant | DetID | PixID | Counts | Sigma | Mean | Median | Sigma |
| A | 5 | 98 | 5731 | 54.52 | 468 | 456 | 96.8 |
| A | 13 | 254 | 5495 | 52.08 | 468 | 456 | 96.8 |
| A | 3 | 137 | 4928 | 46.22 | 468 | 456 | 96.8 |
| B | 10 | 246 | 28509 | 308.61 | 459 | 446 | 90.9 |
| B | 12 | 111 | 11780 | 124.64 | 459 | 446 | 90.9 |
| B | 11 | 111 | 10858 | 114.5 | 459 | 446 | 90.9 |
| C | 14 | 238 | 69380 | 644.37 | 444 | 443 | 107.0 |
| C | 3 | 233 | 29655 | 273.05 | 444 | 443 | 107.0 |
| C | 15 | 208 | 12232 | 110.19 | 444 | 443 | 107.0 |
| D | 1 | 52 | 3179893 | 38876.2 | 340 | 330 | 81.8 |
| D | 8 | 195 | 22241 | 267.9 | 340 | 330 | 81.8 |
| D | 2 | 250 | 13665 | 163.05 | 340 | 330 | 81.8 |
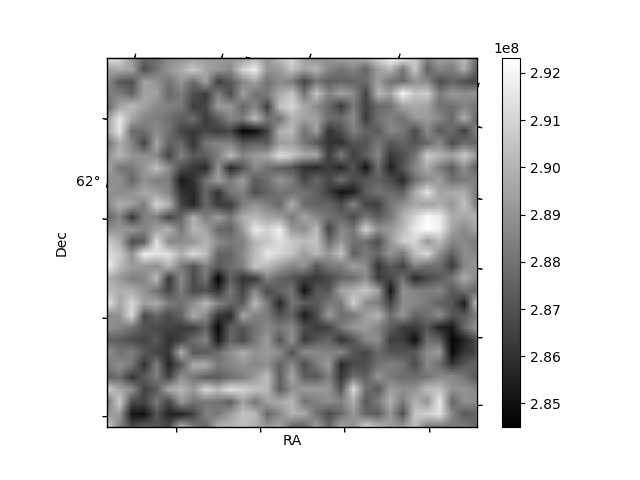
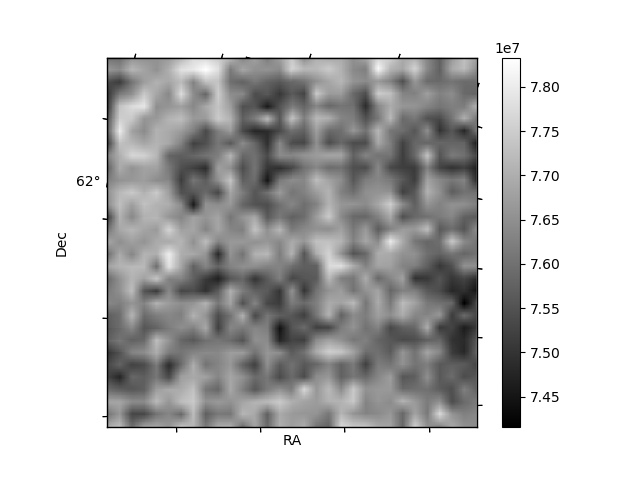
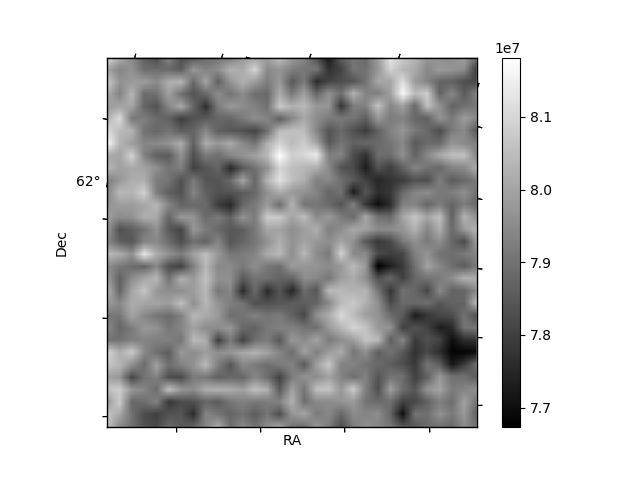
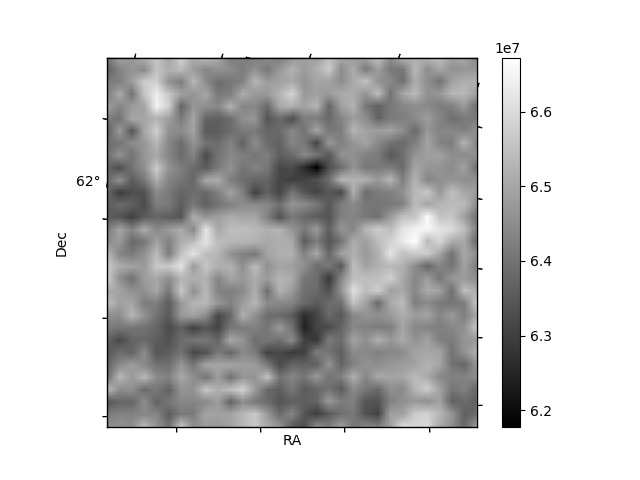
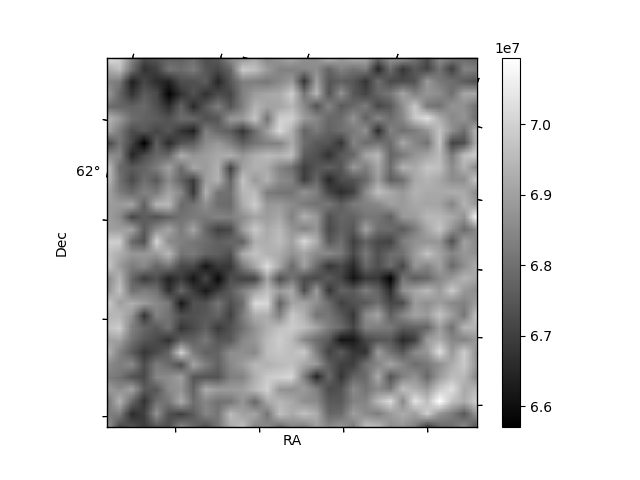
Histogram calculated using DETX and DETY for each event in the final _common_clean file
| Quadrant A | 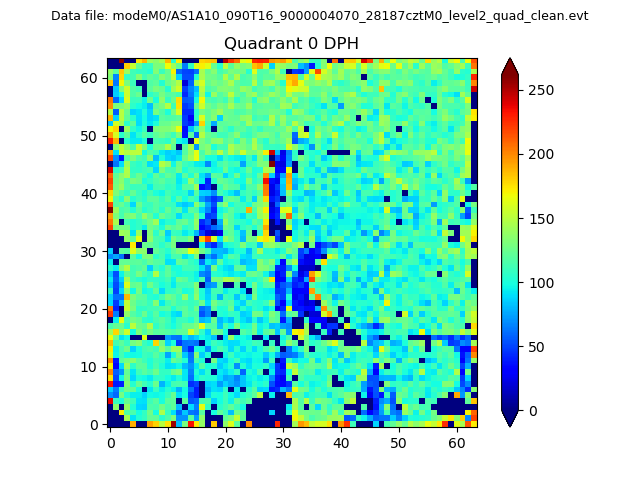 |
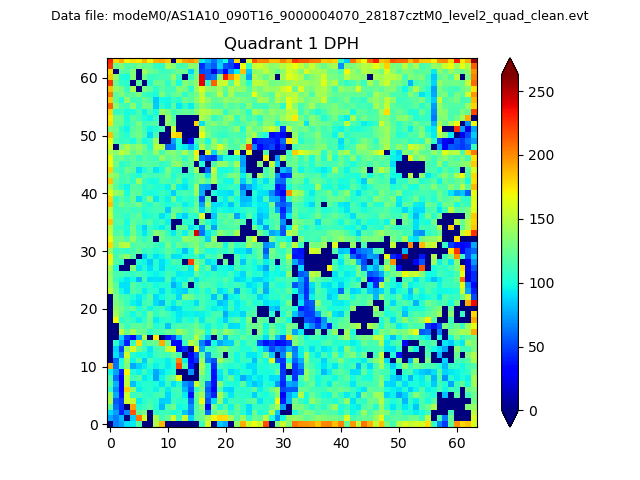 |
Quadrant B |
|---|---|---|---|
| Quadrant D |  |
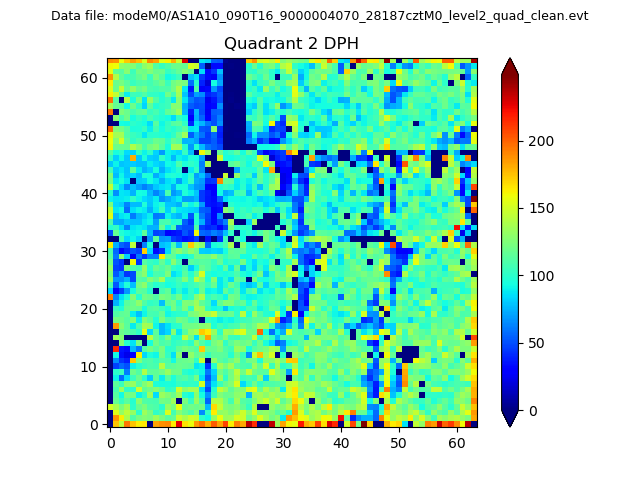 |
Quadrant C |
| Plot type | Count rate plots | Images |
|---|---|---|
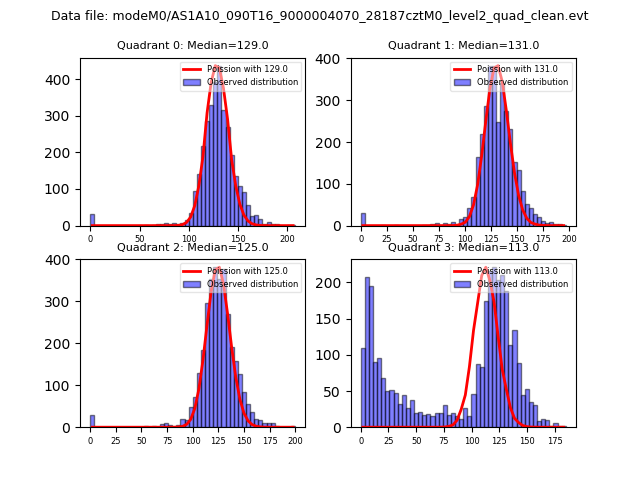
| Comparison with Poisson distribution Blue bars denote a histogram of data divided into 1 sec bins. Red curve is a Poisson curve with rate = median count rate of data. |
 |
 |
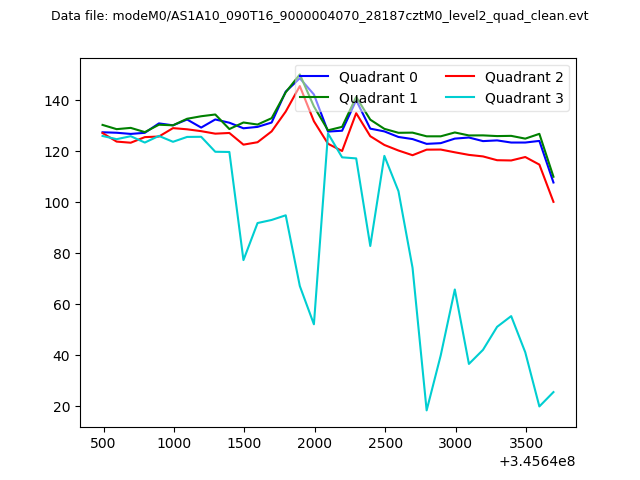
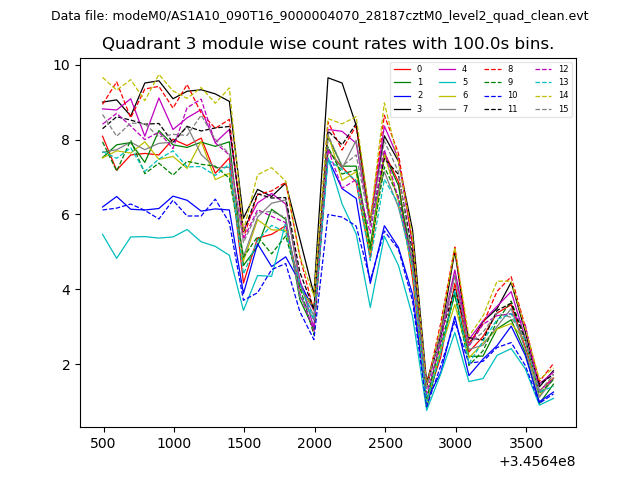
| Quadrant-wise count rates Data is divided into 100 sec bins |
 |
|
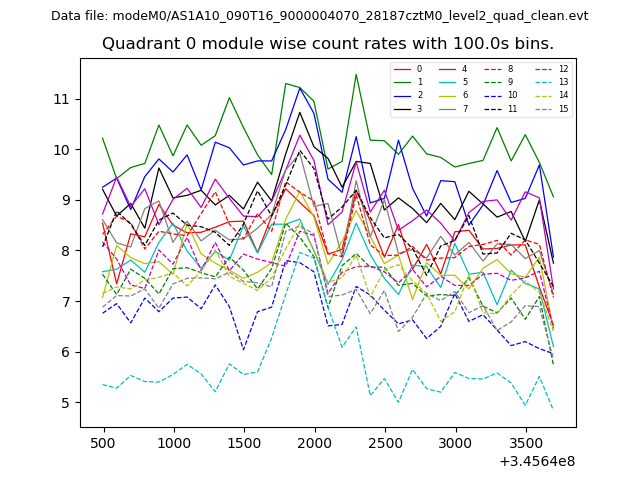
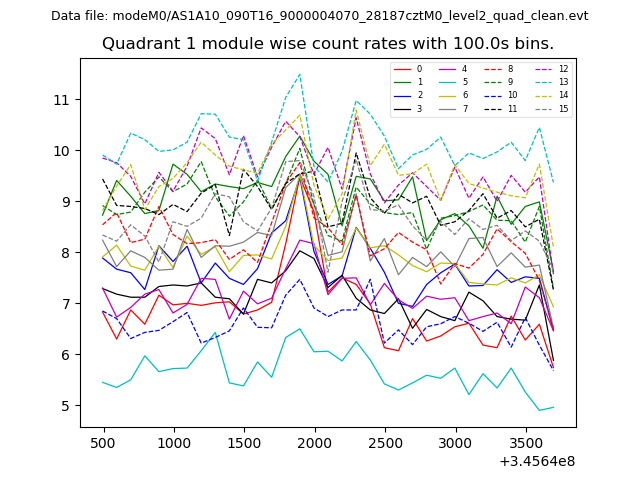
| Module-wise count rates for Quadrant A Data is divided into 100 sec bins |
 |
 |
| Module-wise count rates for Quadrant B Data is divided into 100 sec bins |
 |
 |
| Module-wise count rates for Quadrant C Data is divided into 100 sec bins |
 |
 |
| Module-wise count rates for Quadrant D Data is divided into 100 sec bins |
 |
 |
| Parameter | Plot |
|---|---|
| CZT HV Monitor |  |
| D_VDD | 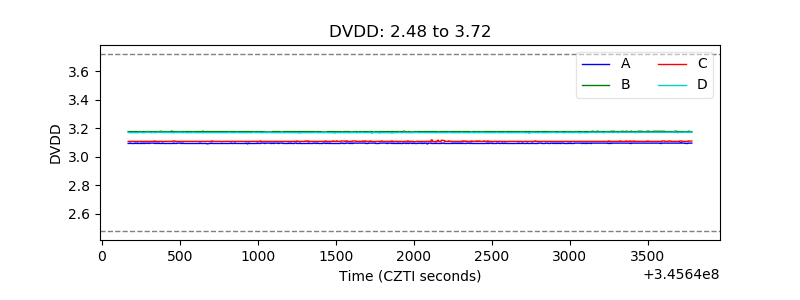 |
| Temperature 1 | 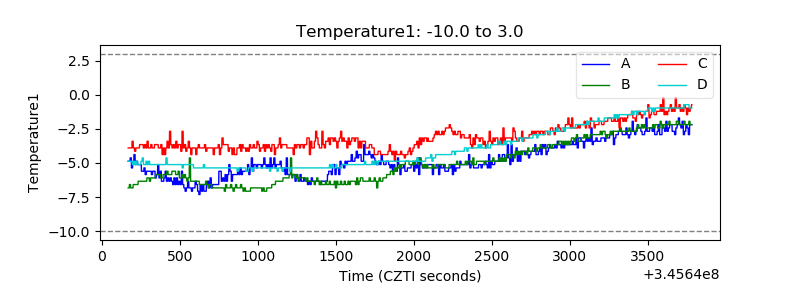 |
| Veto HV Monitor | 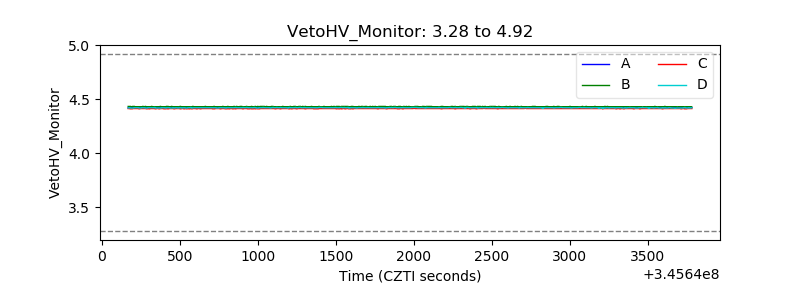 |
| Veto LLD | 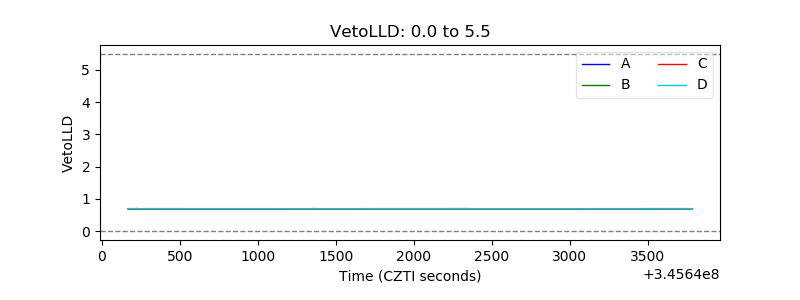 |
| Alpha Counter | 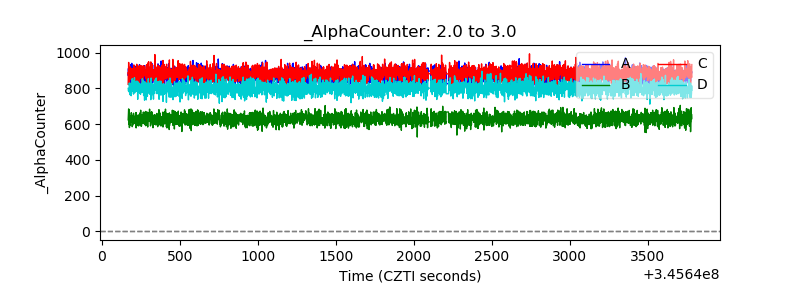 |
| _CPM_Rate | 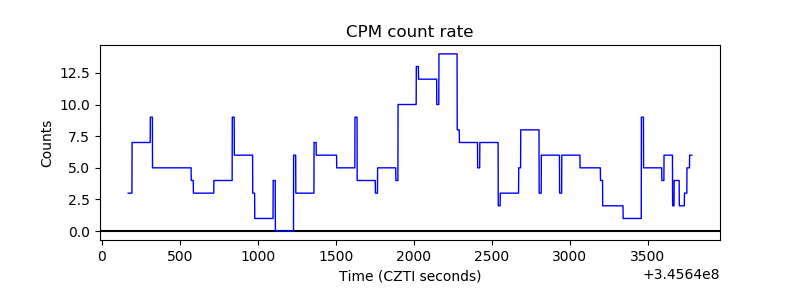 |
| CZT Counter | 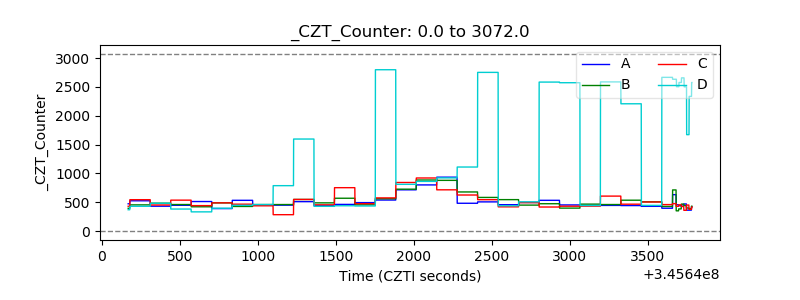 |
| +2.5 Volts monitor |  |
| +5 Volts monitor | 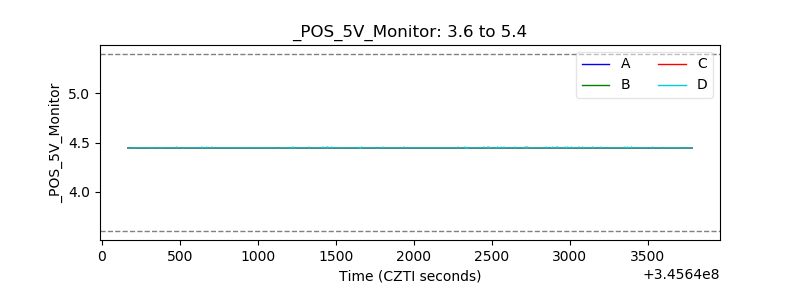 |
| _ROLL_ROT | 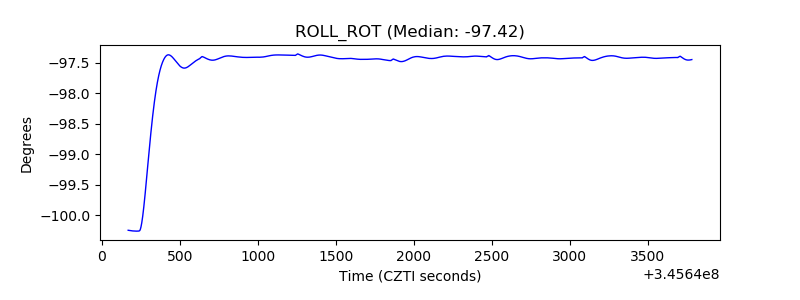 |
| _Roll_DEC | 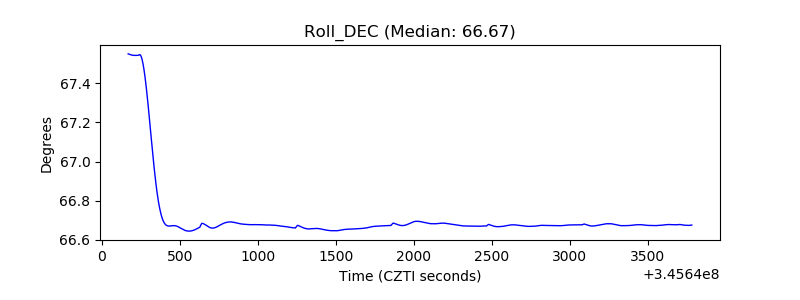 |
| _Roll_RA | 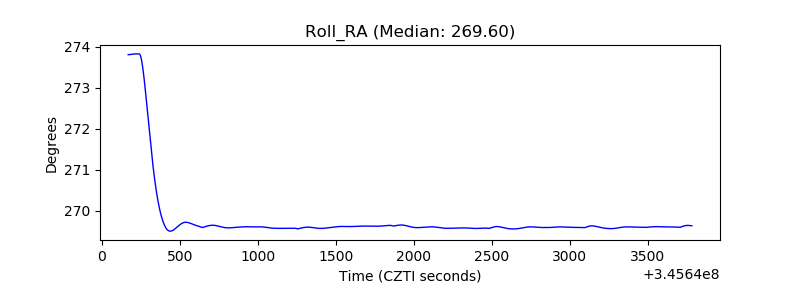 |
| Veto Counter |  |