| Param | Original file | Final file |
|---|---|---|
| Filename | modeM0/AS1A10_090T16_9000004070_28188cztM0_level2.evt | modeM0/AS1A10_090T16_9000004070_28188cztM0_level2_quad_clean.evt |
| Size (bytes) | 628,375,680 | 101,543,040 |
| Size | 599.3 MB | 96.8 MB |
| Events in quadrant A | 3,232,365 | 711,773 |
| Events in quadrant B | 3,528,666 | 719,105 |
| Events in quadrant C | 3,287,711 | 675,458 |
| Events in quadrant D | 8,500,236 | 473,776 |
| Mode M0 | |||
|---|---|---|---|
| Quadrant | BADHDUFLAG | Total packets | Discarded packets |
| A | 0 | 14405 | 0 |
| B | 0 | 15219 | 0 |
| C | 0 | 14500 | 0 |
| D | 0 | 29947 | 0 |
| Mode M9 | |||
|---|---|---|---|
| Quadrant | BADHDUFLAG | Total packets | Discarded packets |
| A | 0 | 3 | 0 |
| B | 0 | 3 | 0 |
| C | 0 | 3 | 0 |
| D | 0 | 3 | 0 |
| Quadrant | Total seconds | Saturated seconds | Saturation percentage |
|---|---|---|---|
| A | 7095 | 34 | 0.479211% |
| B | 7096 | 109 | 1.536077% |
| C | 7096 | 88 | 1.240135% |
| D | 7096 | 2204 | 31.059752% |
Noise dominated data is calculated using 1-second bins in cleaned event files. If a bin has >2000 counts, and if more than 50% of those come from <1% of pixels, then it is considered to be noise-dominated and hence unusable.
| Quadrant | # 1 sec bins | Bins with >0 counts | Bins with >2000 counts | High rate bins dominated by noise | Noise dominated (total time) | Noise dominated (detector-on time) | Marked lightcurve |
|---|---|---|---|---|---|---|---|
| A | 7410 | 7096 | 0 | 0 | 0.00% | 0.00% | 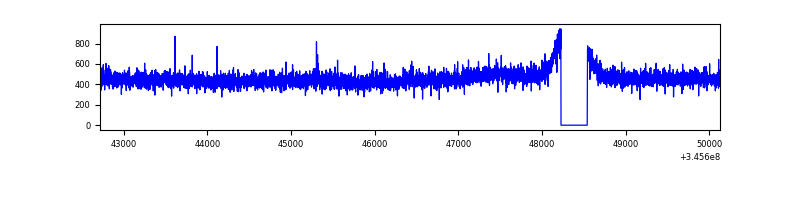 |
| B | 7411 | 7097 | 40 | 40 | 0.54% | 0.56% | 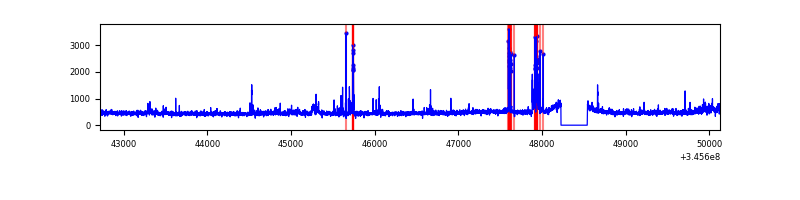 |
| C | 7411 | 7097 | 1 | 1 | 0.01% | 0.01% | 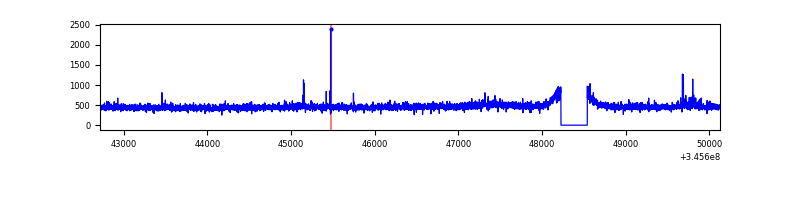 |
| D | 7411 | 7097 | 2059 | 2059 | 27.78% | 29.01% | 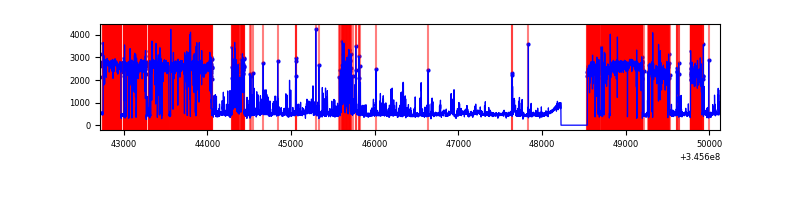 |
Top three noisy pixels from each quadrant. If the there are fewer than three noisy pixels in the level2.evt file, extra rows are filled as -1
| Pixel properties | Quadrant properties | ||||||
|---|---|---|---|---|---|---|---|
| Quadrant | DetID | PixID | Counts | Sigma | Mean | Median | Sigma |
| A | 13 | 254 | 10706 | 59.05 | 834 | 816 | 167.5 |
| A | 3 | 137 | 8427 | 45.44 | 834 | 816 | 167.5 |
| A | 0 | 226 | 7133 | 37.72 | 834 | 816 | 167.5 |
| B | 10 | 246 | 205361 | 1303.51 | 820 | 796 | 156.9 |
| B | 15 | 32 | 43875 | 274.5 | 820 | 796 | 156.9 |
| B | 12 | 111 | 19754 | 120.8 | 820 | 796 | 156.9 |
| C | 14 | 238 | 127514 | 680.6 | 793 | 796 | 186.2 |
| C | 3 | 233 | 51385 | 271.71 | 793 | 796 | 186.2 |
| C | 0 | 79 | 8467 | 41.2 | 793 | 796 | 186.2 |
| D | 1 | 52 | 5527287 | 35977.49 | 635 | 615 | 153.6 |
| D | 2 | 250 | 343331 | 2231.01 | 635 | 615 | 153.6 |
| D | 8 | 195 | 97278 | 629.26 | 635 | 615 | 153.6 |
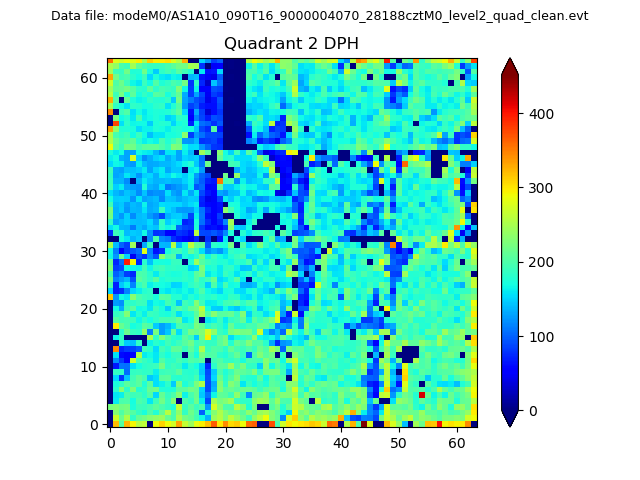
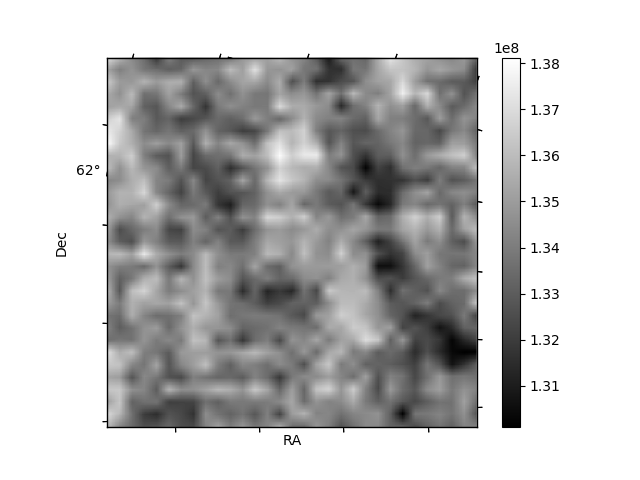
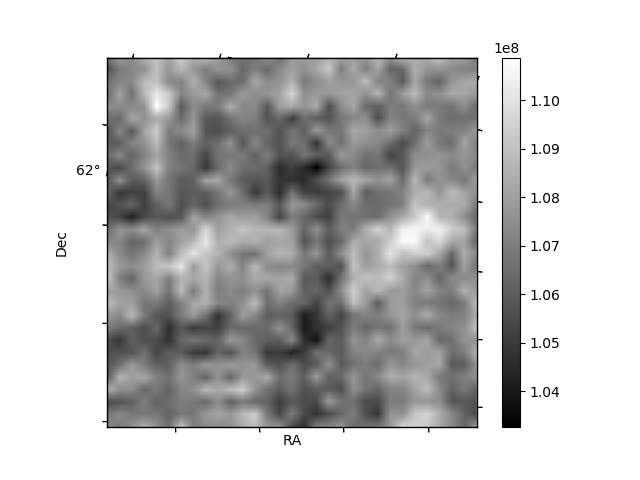
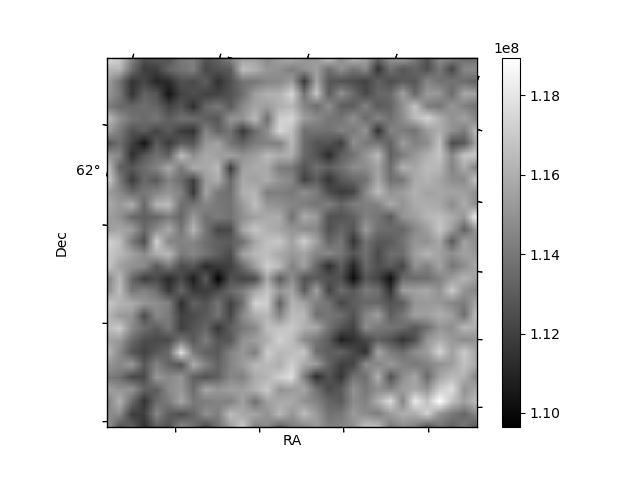
Histogram calculated using DETX and DETY for each event in the final _common_clean file
| Quadrant A | 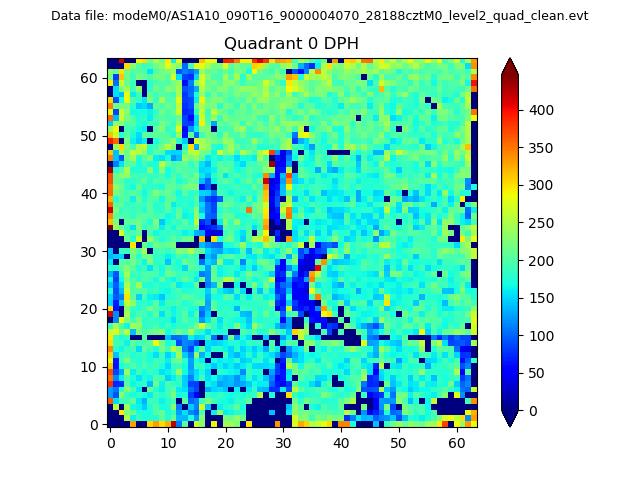 |
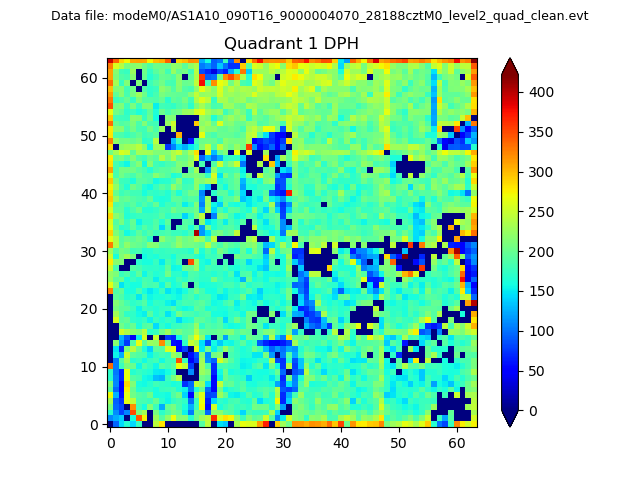 |
Quadrant B |
|---|---|---|---|
| Quadrant D | 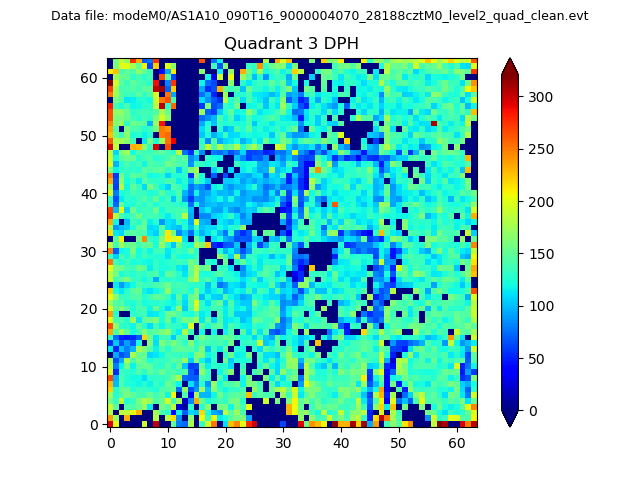 |
 |
Quadrant C |
| Plot type | Count rate plots | Images |
|---|---|---|
| Comparison with Poisson distribution Blue bars denote a histogram of data divided into 1 sec bins. Red curve is a Poisson curve with rate = median count rate of data. |
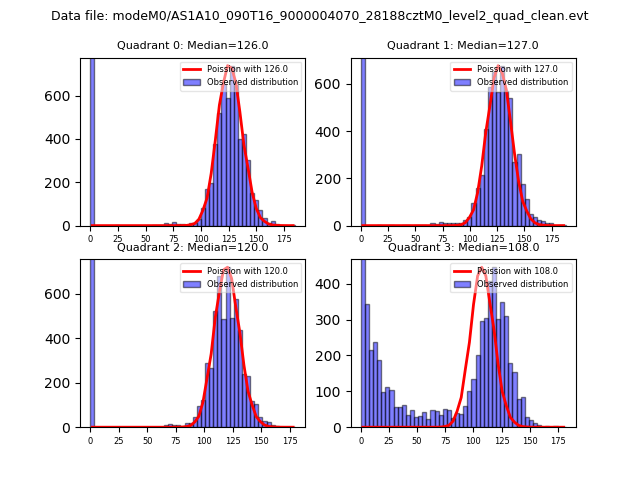 |
 |
| Quadrant-wise count rates Data is divided into 100 sec bins |
 |
|
| Module-wise count rates for Quadrant A Data is divided into 100 sec bins |
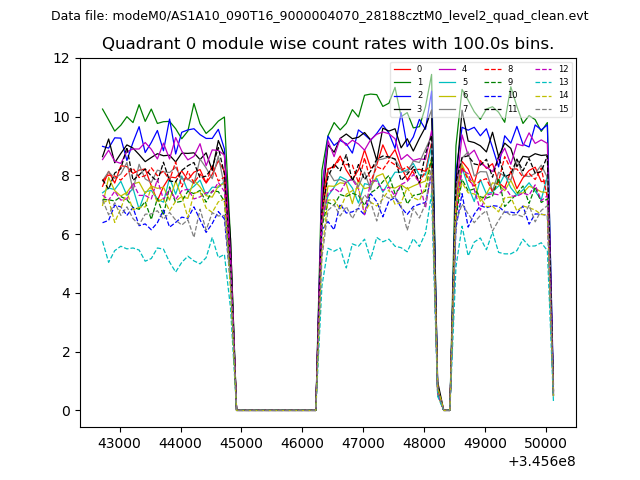 |
 |
| Module-wise count rates for Quadrant B Data is divided into 100 sec bins |
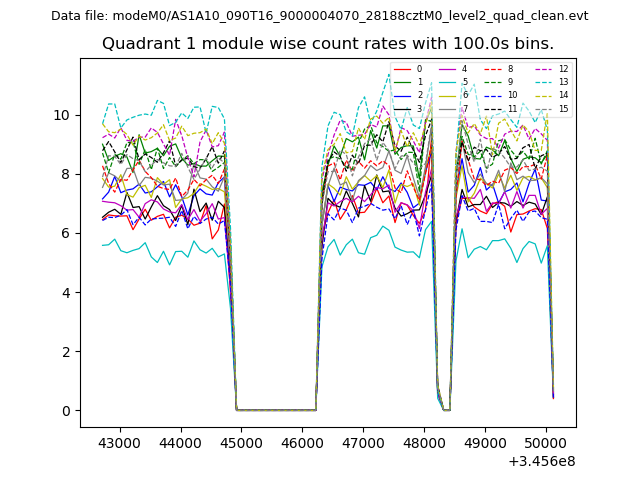 |
 |
| Module-wise count rates for Quadrant C Data is divided into 100 sec bins |
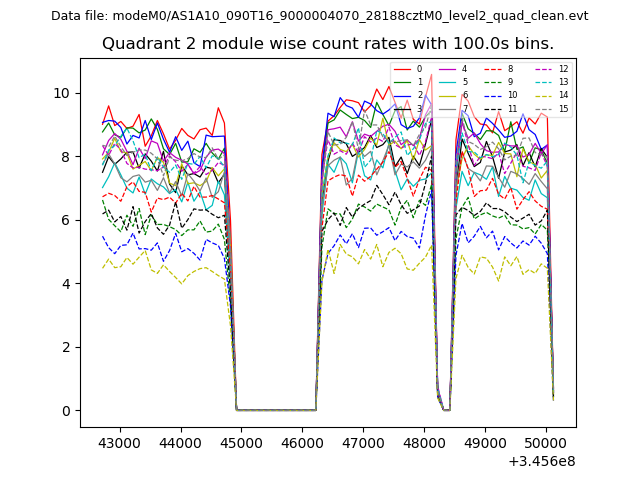 |
 |
| Module-wise count rates for Quadrant D Data is divided into 100 sec bins |
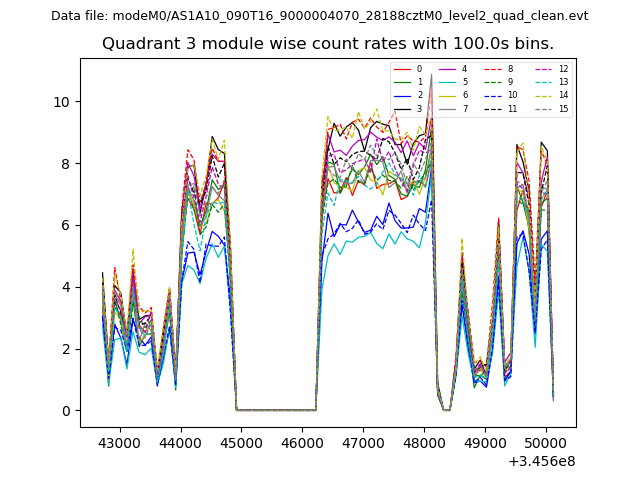 |
 |
| Parameter | Plot |
|---|---|
| CZT HV Monitor | 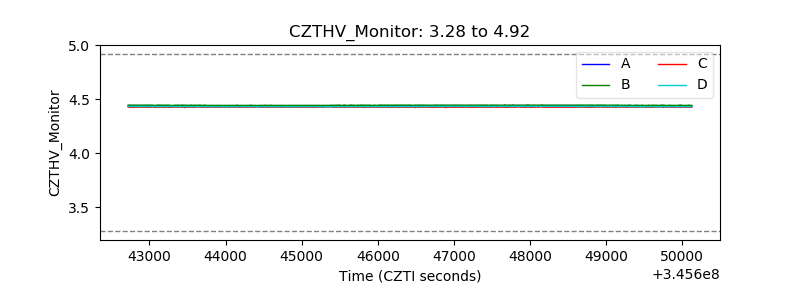 |
| D_VDD | 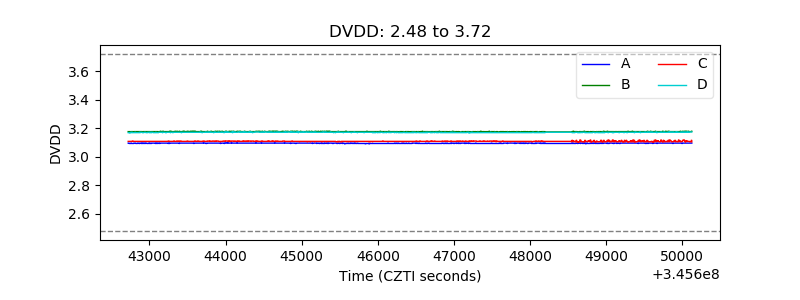 |
| Temperature 1 | 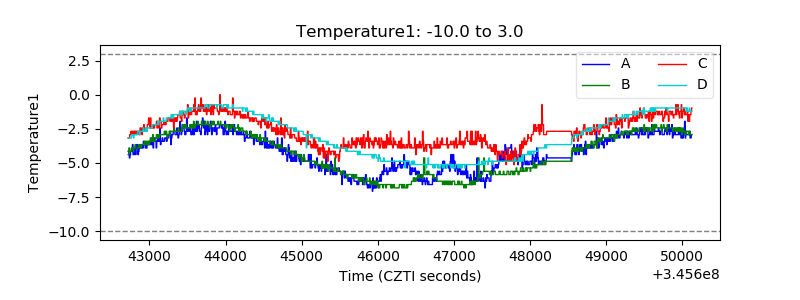 |
| Veto HV Monitor | 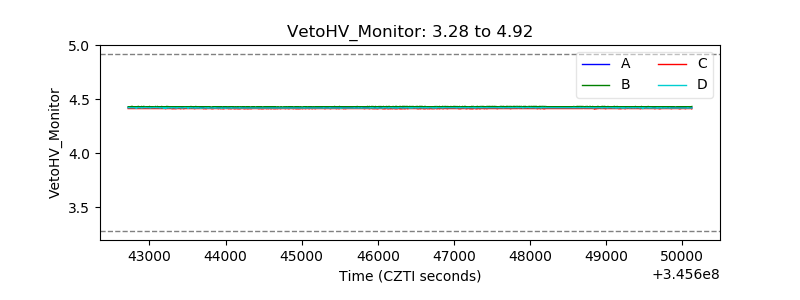 |
| Veto LLD | 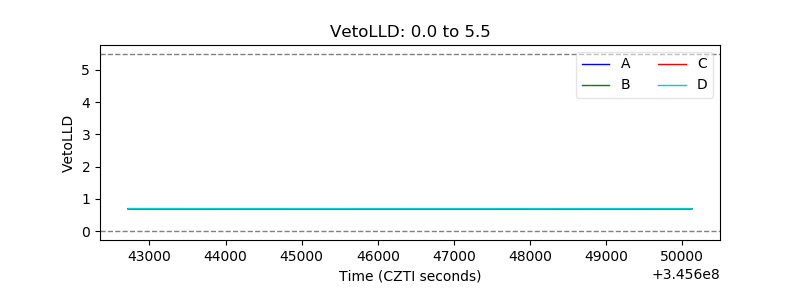 |
| Alpha Counter | 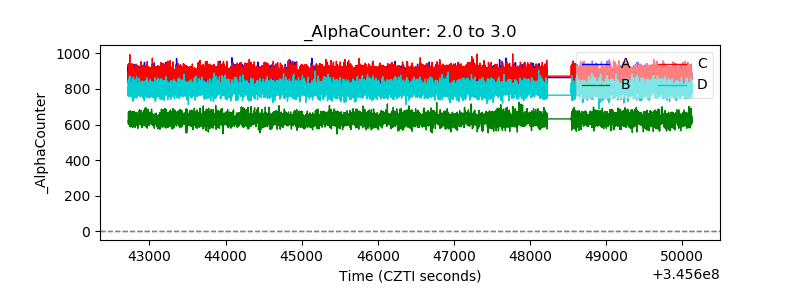 |
| _CPM_Rate | 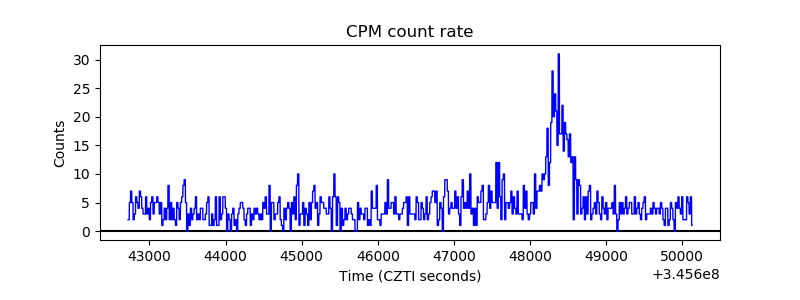 |
| CZT Counter |  |
| +2.5 Volts monitor |  |
| +5 Volts monitor |  |
| _ROLL_ROT | 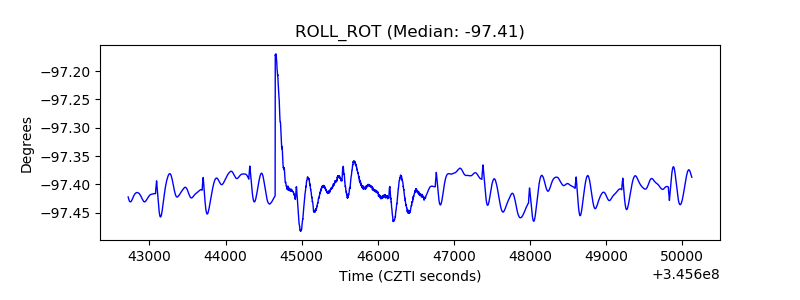 |
| _Roll_DEC | 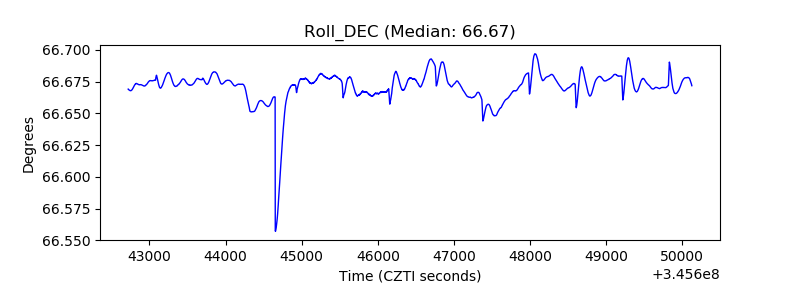 |
| _Roll_RA |  |
| Veto Counter | 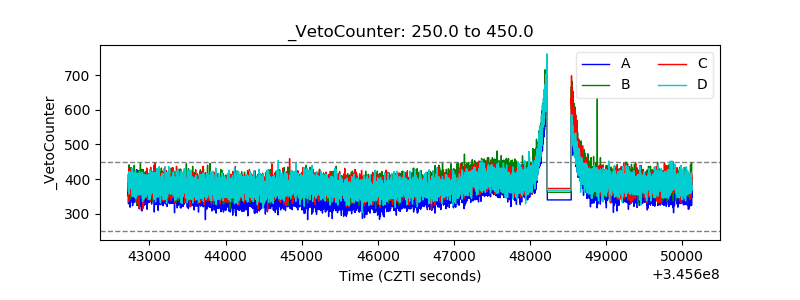 |