| Param | Original file | Final file |
|---|---|---|
| Filename | modeM0/AS1A10_090T16_9000004070_28191cztM0_level2.evt | modeM0/AS1A10_090T16_9000004070_28191cztM0_level2_quad_clean.evt |
| Size (bytes) | 1,583,582,400 | 247,705,920 |
| Size | 1.5 GB | 236.2 MB |
| Events in quadrant A | 8,263,842 | 1,656,299 |
| Events in quadrant B | 8,690,700 | 1,670,021 |
| Events in quadrant C | 8,680,720 | 1,585,451 |
| Events in quadrant D | 21,103,255 | 1,342,953 |
| Mode M0 | |||
|---|---|---|---|
| Quadrant | BADHDUFLAG | Total packets | Discarded packets |
| A | 0 | 36636 | 0 |
| B | 0 | 37642 | 0 |
| C | 0 | 37406 | 0 |
| D | 0 | 75013 | 0 |
| Mode M9 | |||
|---|---|---|---|
| Quadrant | BADHDUFLAG | Total packets | Discarded packets |
| A | 0 | 20 | 0 |
| B | 0 | 20 | 0 |
| C | 0 | 20 | 0 |
| D | 0 | 20 | 0 |
| Quadrant | Total seconds | Saturated seconds | Saturation percentage |
|---|---|---|---|
| A | 18086 | 73 | 0.403627% |
| B | 18087 | 108 | 0.597114% |
| C | 18087 | 234 | 1.293747% |
| D | 18087 | 4130 | 22.834080% |
Noise dominated data is calculated using 1-second bins in cleaned event files. If a bin has >2000 counts, and if more than 50% of those come from <1% of pixels, then it is considered to be noise-dominated and hence unusable.
| Quadrant | # 1 sec bins | Bins with >0 counts | Bins with >2000 counts | High rate bins dominated by noise | Noise dominated (total time) | Noise dominated (detector-on time) | Marked lightcurve |
|---|---|---|---|---|---|---|---|
| A | 20081 | 18089 | 1 | 1 | 0.00% | 0.01% | 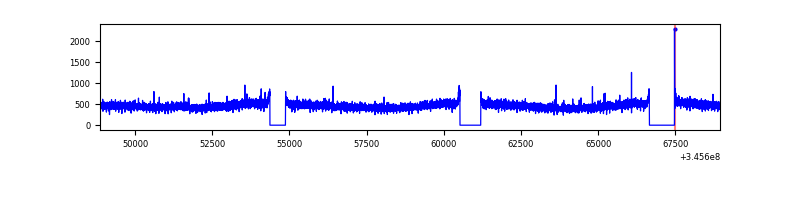 |
| B | 20082 | 18089 | 10 | 10 | 0.05% | 0.06% | 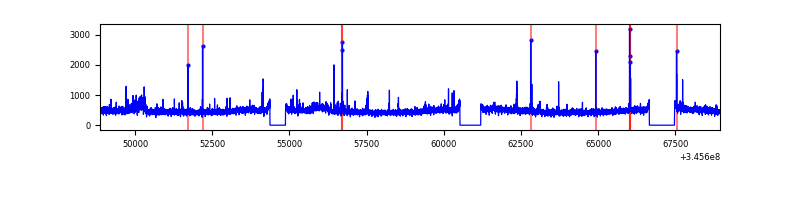 |
| C | 20082 | 18089 | 14 | 14 | 0.07% | 0.08% | 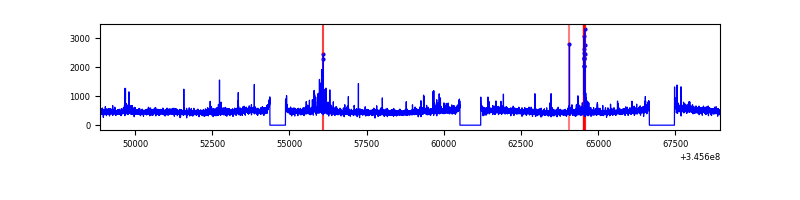 |
| D | 20082 | 18087 | 3683 | 3683 | 18.34% | 20.36% | 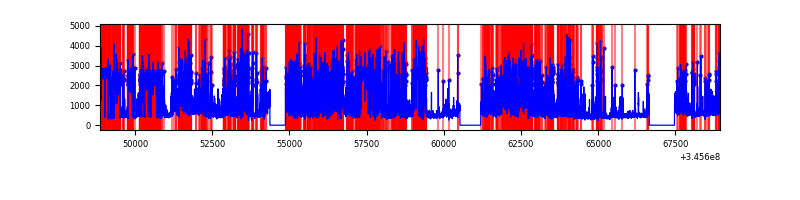 |
Top three noisy pixels from each quadrant. If the there are fewer than three noisy pixels in the level2.evt file, extra rows are filled as -1
| Pixel properties | Quadrant properties | ||||||
|---|---|---|---|---|---|---|---|
| Quadrant | DetID | PixID | Counts | Sigma | Mean | Median | Sigma |
| A | 5 | 98 | 47212 | 106.35 | 2123 | 2075 | 424.4 |
| A | 13 | 254 | 31415 | 69.13 | 2123 | 2075 | 424.4 |
| A | 3 | 137 | 20975 | 44.53 | 2123 | 2075 | 424.4 |
| B | 15 | 32 | 186850 | 463.47 | 2101 | 2042 | 398.7 |
| B | 10 | 245 | 72785 | 177.41 | 2101 | 2042 | 398.7 |
| B | 12 | 111 | 50692 | 122.01 | 2101 | 2042 | 398.7 |
| C | 3 | 233 | 348485 | 732.82 | 2034 | 2042 | 472.8 |
| C | 14 | 238 | 327642 | 688.73 | 2034 | 2042 | 472.8 |
| C | 15 | 208 | 52489 | 106.71 | 2034 | 2042 | 472.8 |
| D | 1 | 52 | 12375734 | 28654.94 | 1807 | 1758 | 431.8 |
| D | 8 | 195 | 637384 | 1471.95 | 1807 | 1758 | 431.8 |
| D | 2 | 153 | 457296 | 1054.91 | 1807 | 1758 | 431.8 |
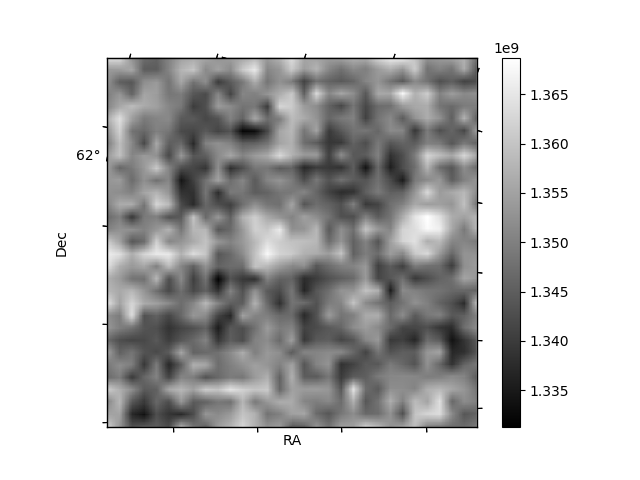
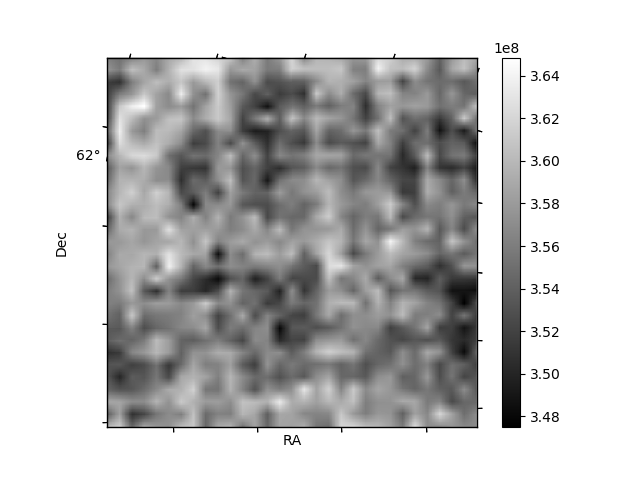
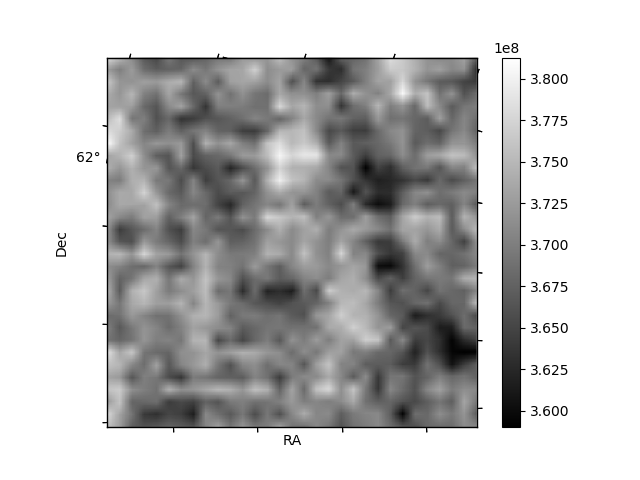
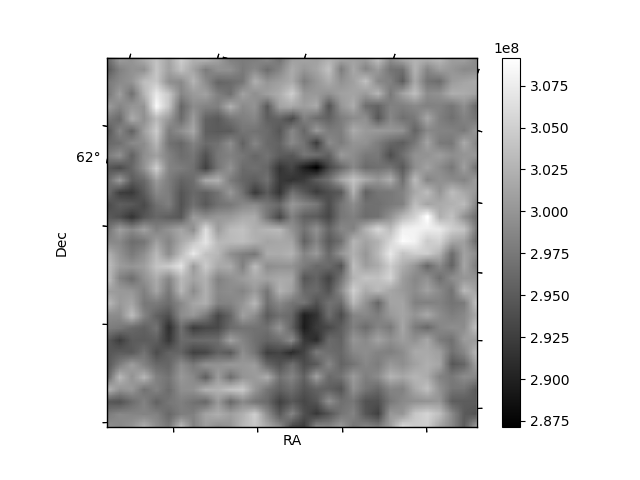
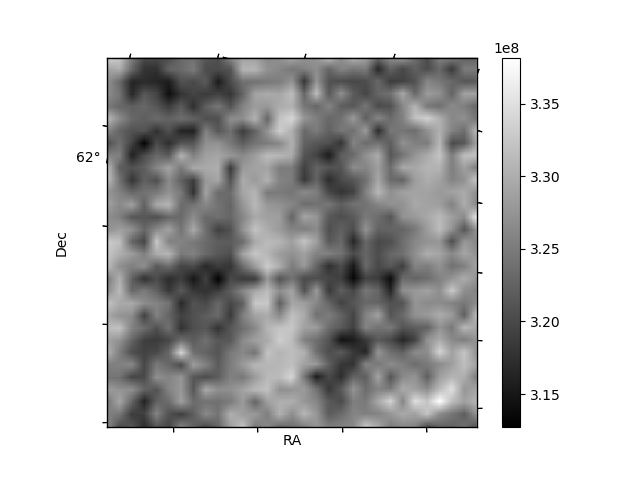
Histogram calculated using DETX and DETY for each event in the final _common_clean file
| Quadrant A | 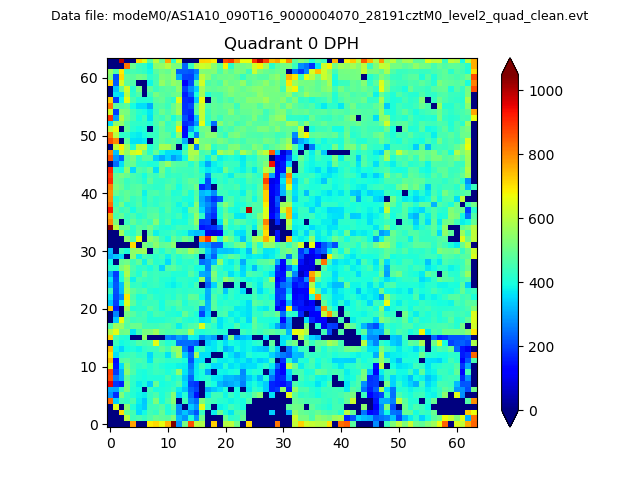 |
 |
Quadrant B |
|---|---|---|---|
| Quadrant D | 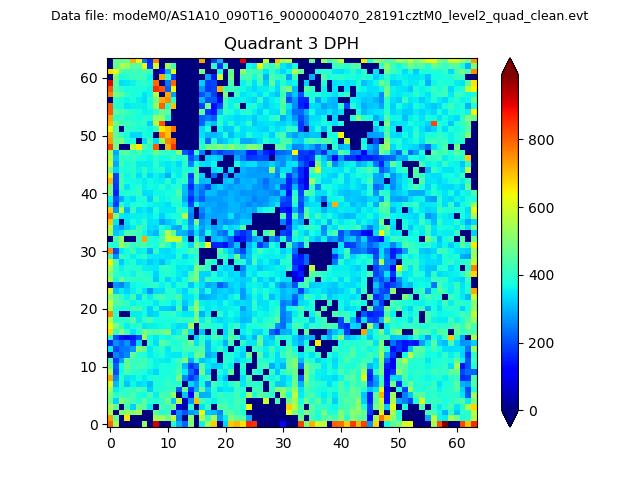 |
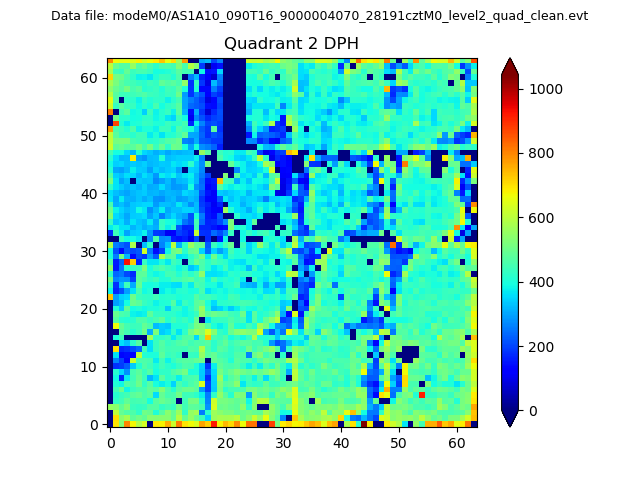 |
Quadrant C |
| Plot type | Count rate plots | Images |
|---|---|---|
| Comparison with Poisson distribution Blue bars denote a histogram of data divided into 1 sec bins. Red curve is a Poisson curve with rate = median count rate of data. |
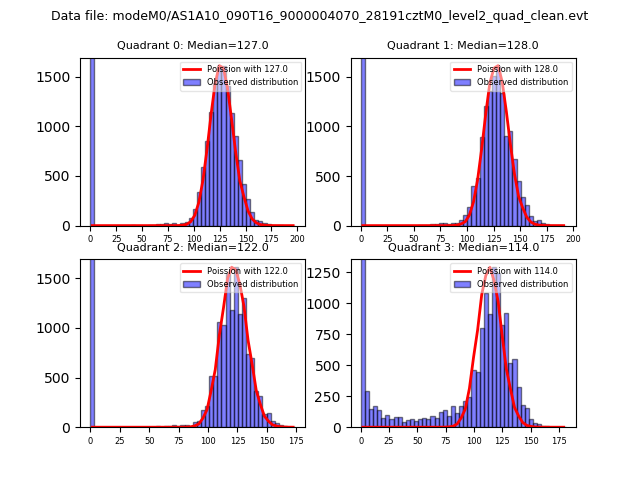 |
 |
| Quadrant-wise count rates Data is divided into 100 sec bins |
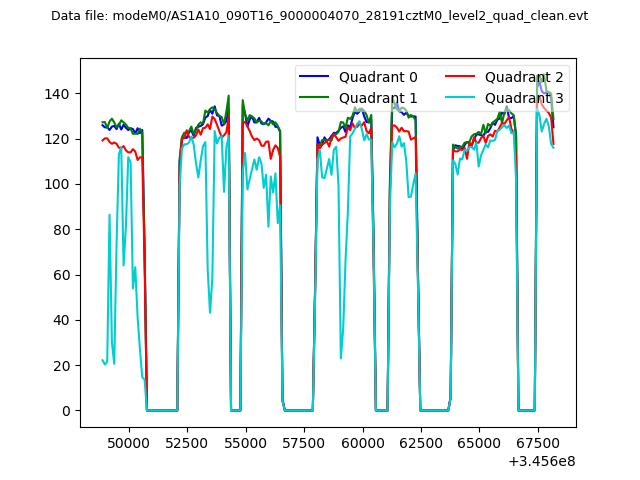 |
|
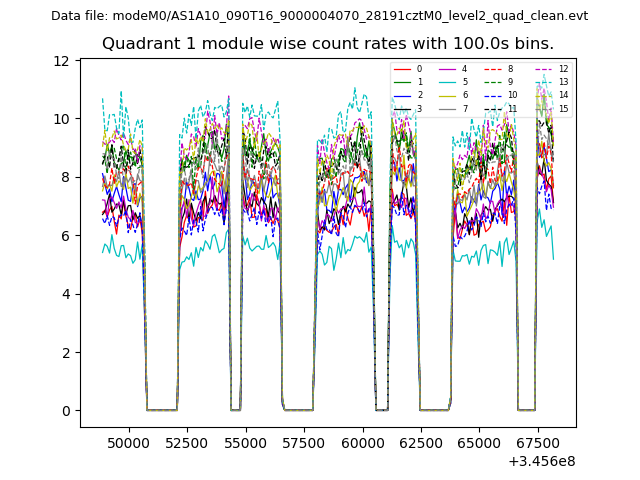
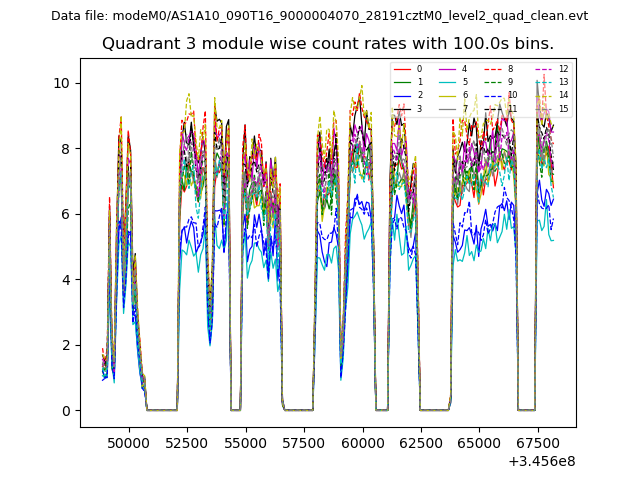
| Module-wise count rates for Quadrant A Data is divided into 100 sec bins |
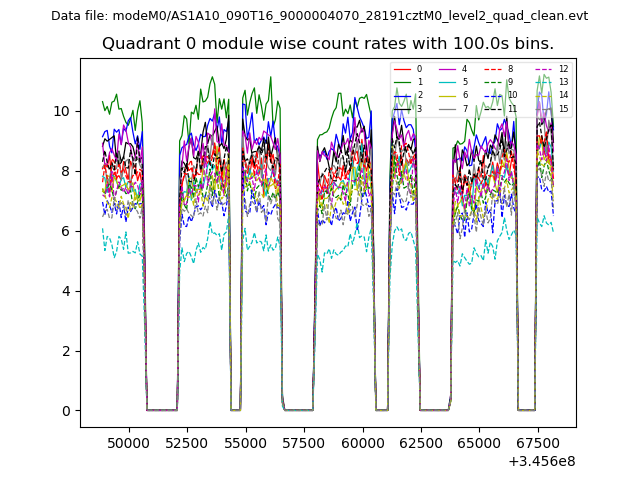 |
 |
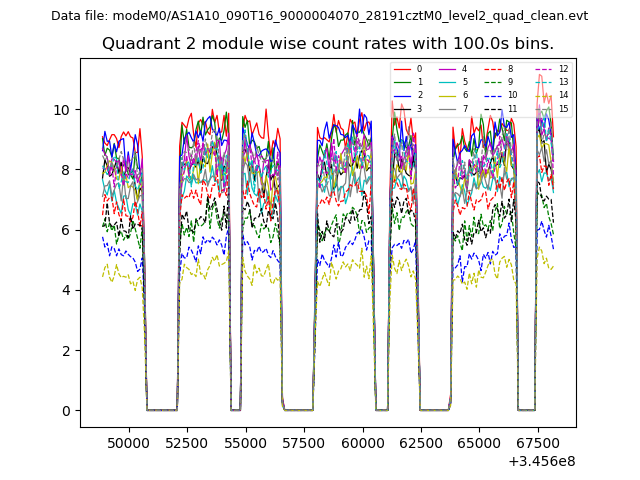
| Module-wise count rates for Quadrant B Data is divided into 100 sec bins |
 |
 |
| Module-wise count rates for Quadrant C Data is divided into 100 sec bins |
 |
 |
| Module-wise count rates for Quadrant D Data is divided into 100 sec bins |
 |
 |
| Parameter | Plot |
|---|---|
| CZT HV Monitor | 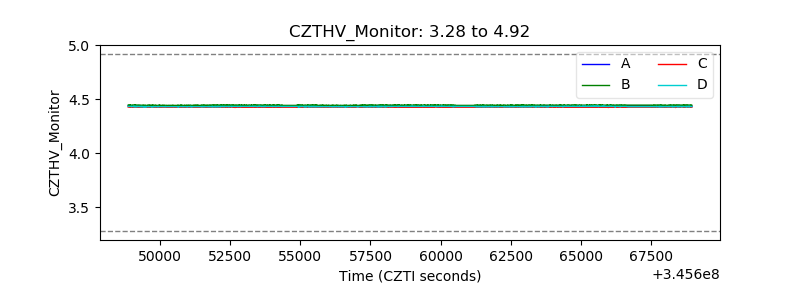 |
| D_VDD | 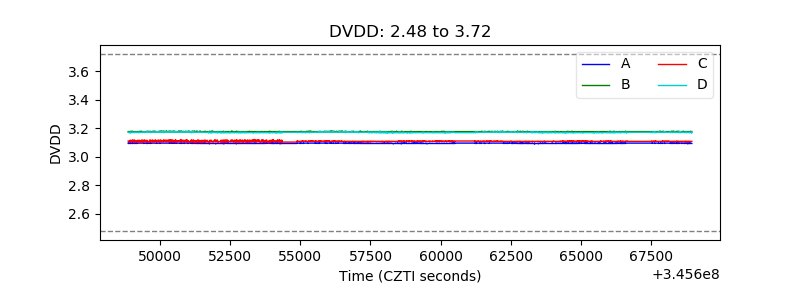 |
| Temperature 1 | 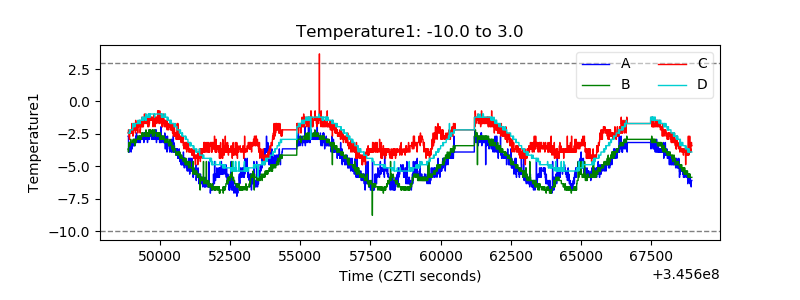 |
| Veto HV Monitor | 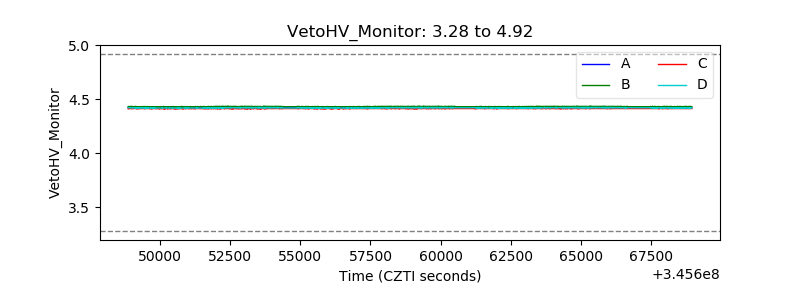 |
| Veto LLD | 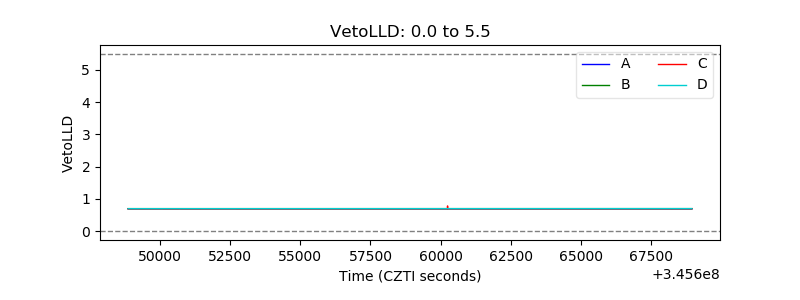 |
| Alpha Counter | 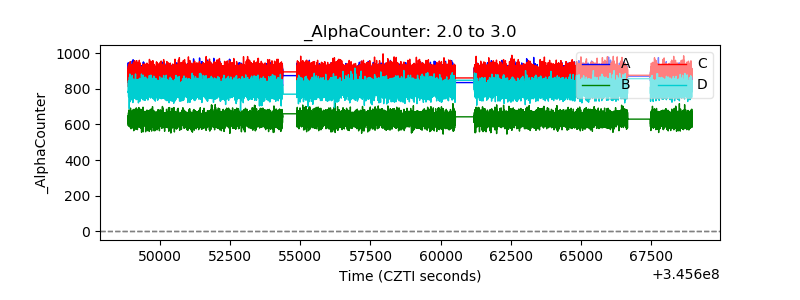 |
| _CPM_Rate | 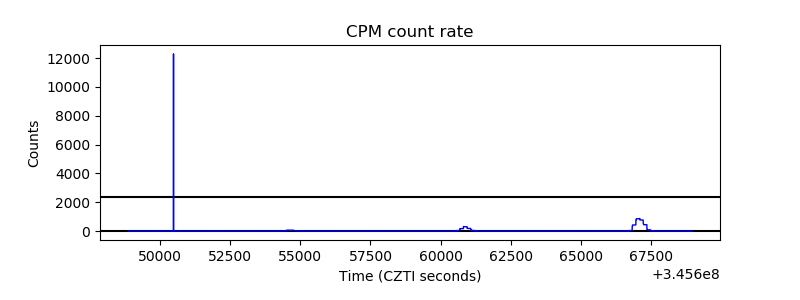 |
| CZT Counter | 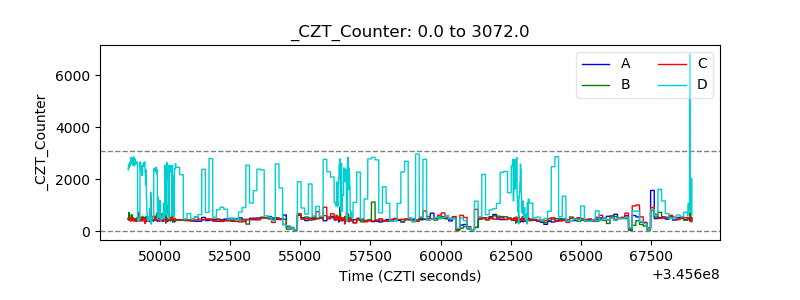 |
| +2.5 Volts monitor |  |
| +5 Volts monitor |  |
| _ROLL_ROT | 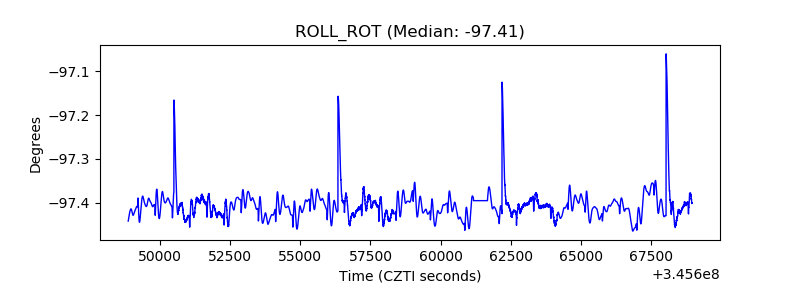 |
| _Roll_DEC | 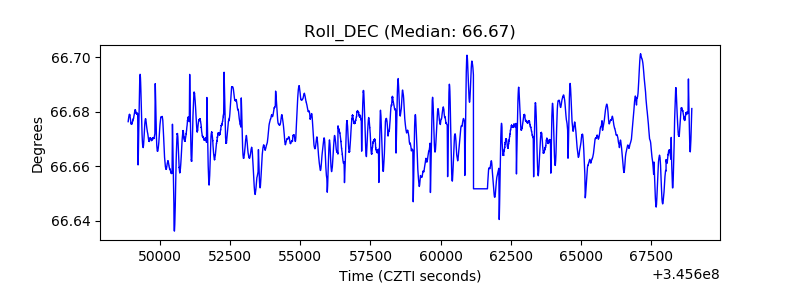 |
| _Roll_RA | 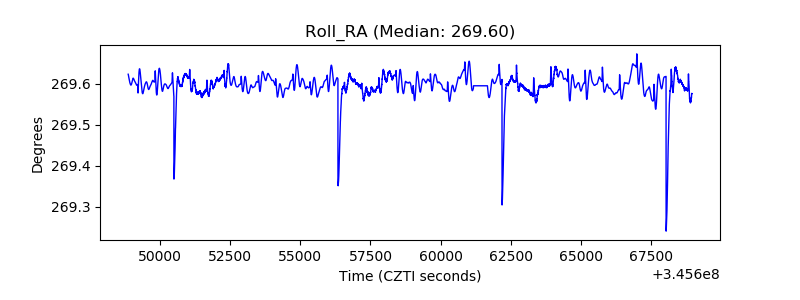 |
| Veto Counter | 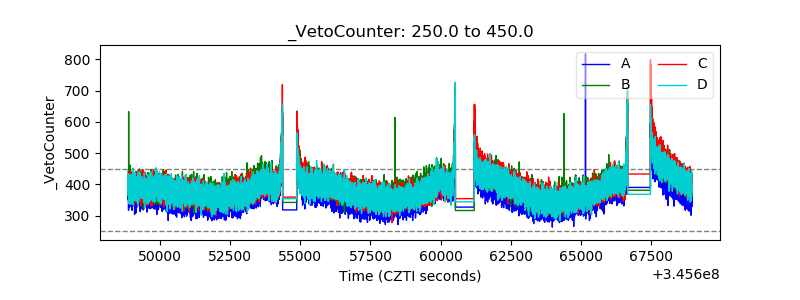 |