| Param | Original file | Final file |
|---|---|---|
| Filename | modeM0/AS1A10_090T16_9000004070_28192cztM0_level2.evt | modeM0/AS1A10_090T16_9000004070_28192cztM0_level2_quad_clean.evt |
| Size (bytes) | 562,616,640 | 85,449,600 |
| Size | 536.6 MB | 81.5 MB |
| Events in quadrant A | 3,490,500 | 541,382 |
| Events in quadrant B | 3,293,792 | 553,613 |
| Events in quadrant C | 3,670,633 | 526,541 |
| Events in quadrant D | 6,115,049 | 484,067 |
| Mode M0 | |||
|---|---|---|---|
| Quadrant | BADHDUFLAG | Total packets | Discarded packets |
| A | 0 | 14736 | 0 |
| B | 0 | 14316 | 0 |
| C | 0 | 15411 | 0 |
| D | 0 | 23100 | 0 |
| Mode M9 | |||
|---|---|---|---|
| Quadrant | BADHDUFLAG | Total packets | Discarded packets |
| A | 0 | 9 | 0 |
| B | 0 | 9 | 0 |
| C | 0 | 9 | 0 |
| D | 0 | 9 | 0 |
| Quadrant | Total seconds | Saturated seconds | Saturation percentage |
|---|---|---|---|
| A | 6908 | 52 | 0.752750% |
| B | 6909 | 37 | 0.535533% |
| C | 6908 | 145 | 2.099016% |
| D | 6908 | 785 | 11.363636% |
Noise dominated data is calculated using 1-second bins in cleaned event files. If a bin has >2000 counts, and if more than 50% of those come from <1% of pixels, then it is considered to be noise-dominated and hence unusable.
| Quadrant | # 1 sec bins | Bins with >0 counts | Bins with >2000 counts | High rate bins dominated by noise | Noise dominated (total time) | Noise dominated (detector-on time) | Marked lightcurve |
|---|---|---|---|---|---|---|---|
| A | 7893 | 6909 | 9 | 9 | 0.11% | 0.13% | 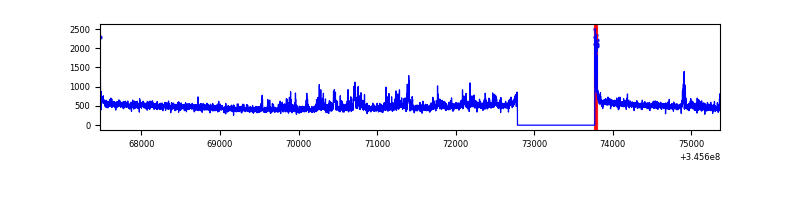 |
| B | 7894 | 6910 | 3 | 3 | 0.04% | 0.04% | 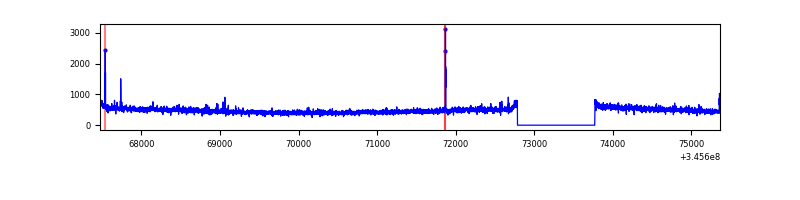 |
| C | 7893 | 6908 | 13 | 13 | 0.16% | 0.19% | 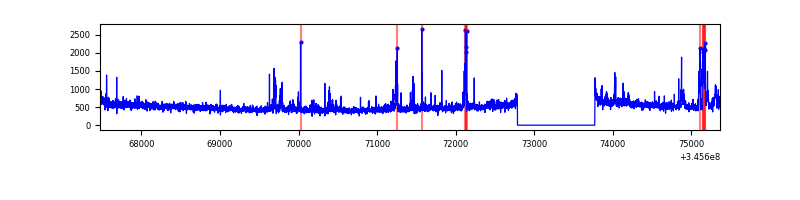 |
| D | 7893 | 6909 | 607 | 607 | 7.69% | 8.79% | 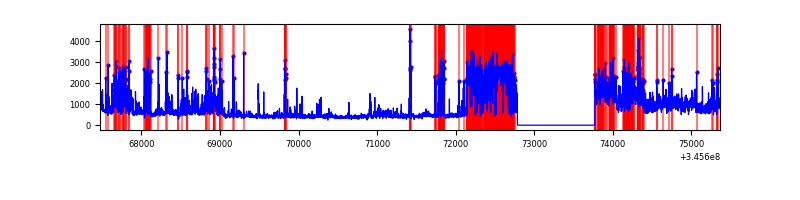 |
Top three noisy pixels from each quadrant. If the there are fewer than three noisy pixels in the level2.evt file, extra rows are filled as -1
| Pixel properties | Quadrant properties | ||||||
|---|---|---|---|---|---|---|---|
| Quadrant | DetID | PixID | Counts | Sigma | Mean | Median | Sigma |
| A | 12 | 16 | 234596 | 1401.46 | 830 | 810 | 166.8 |
| A | 12 | 194 | 41393 | 243.28 | 830 | 810 | 166.8 |
| A | 8 | 192 | 12078 | 67.55 | 830 | 810 | 166.8 |
| B | 12 | 111 | 19711 | 121.46 | 827 | 804 | 155.7 |
| B | 11 | 111 | 18064 | 110.88 | 827 | 804 | 155.7 |
| B | 14 | 111 | 16532 | 101.04 | 827 | 804 | 155.7 |
| C | 3 | 233 | 396284 | 2101.35 | 805 | 810 | 188.2 |
| C | 14 | 238 | 130759 | 690.48 | 805 | 810 | 188.2 |
| C | 15 | 208 | 8469 | 40.7 | 805 | 810 | 188.2 |
| D | 1 | 52 | 1383207 | 7472.37 | 779 | 759 | 185.0 |
| D | 7 | 80 | 995563 | 5377.09 | 779 | 759 | 185.0 |
| D | 5 | 222 | 496491 | 2679.52 | 779 | 759 | 185.0 |
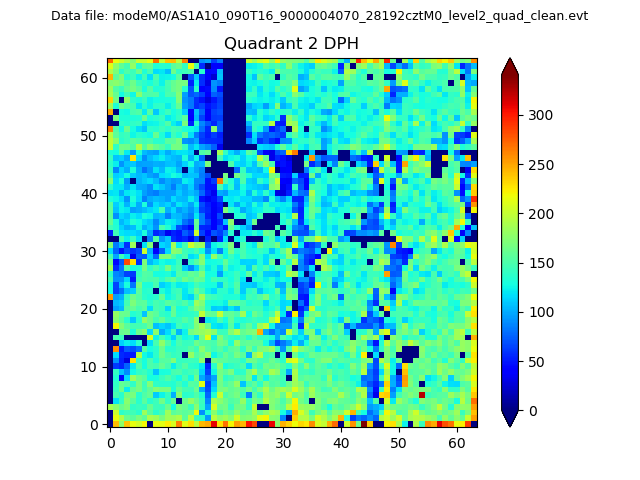
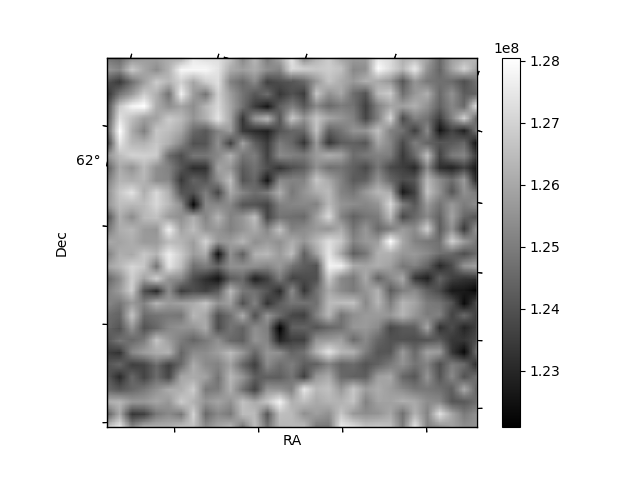
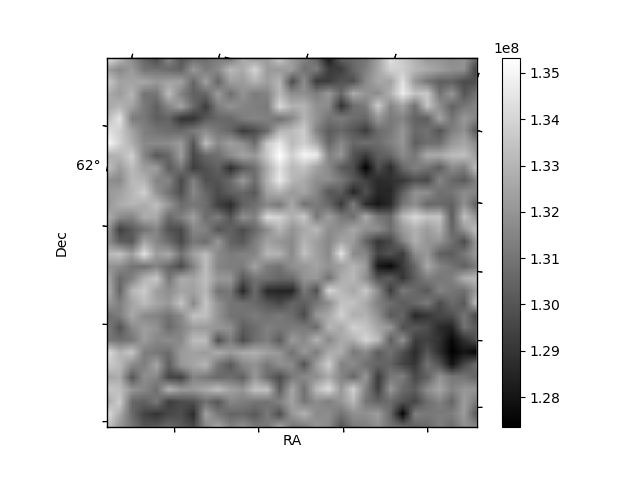
Histogram calculated using DETX and DETY for each event in the final _common_clean file
| Quadrant A |  |
 |
Quadrant B |
|---|---|---|---|
| Quadrant D |  |
 |
Quadrant C |
| Plot type | Count rate plots | Images |
|---|---|---|
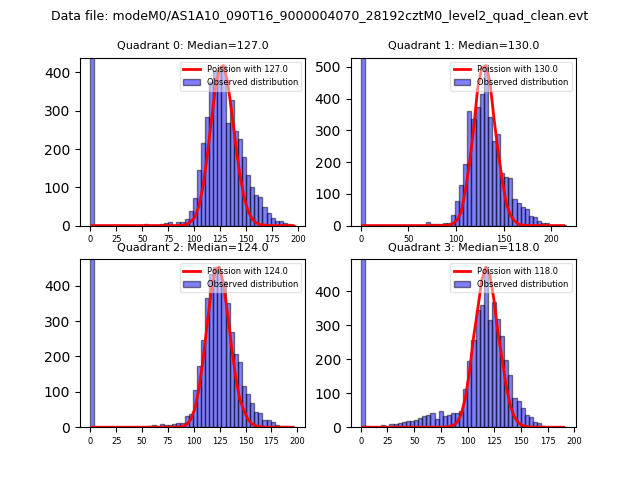
| Comparison with Poisson distribution Blue bars denote a histogram of data divided into 1 sec bins. Red curve is a Poisson curve with rate = median count rate of data. |
 |
 |
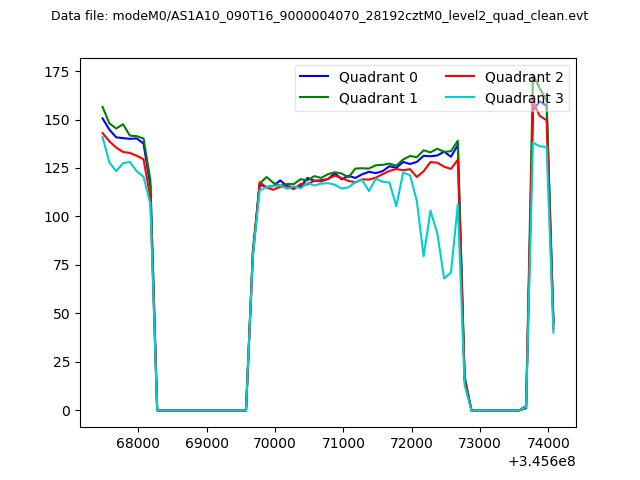
| Quadrant-wise count rates Data is divided into 100 sec bins |
 |
|
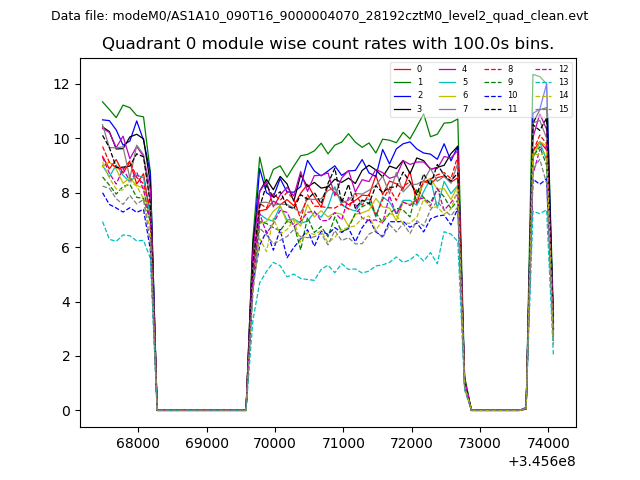
| Module-wise count rates for Quadrant A Data is divided into 100 sec bins |
 |
 |
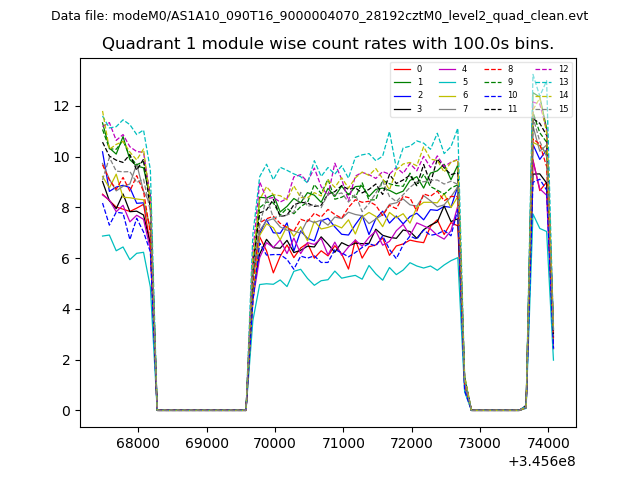
| Module-wise count rates for Quadrant B Data is divided into 100 sec bins |
 |
 |
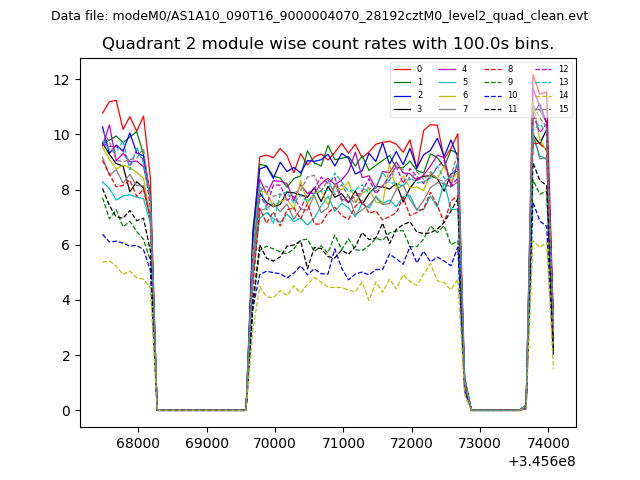
| Module-wise count rates for Quadrant C Data is divided into 100 sec bins |
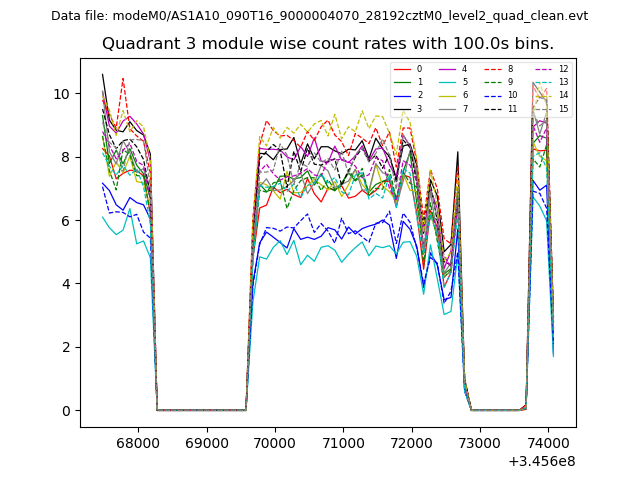
 |
 |
| Module-wise count rates for Quadrant D Data is divided into 100 sec bins |
 |
 |
| Parameter | Plot |
|---|---|
| CZT HV Monitor | 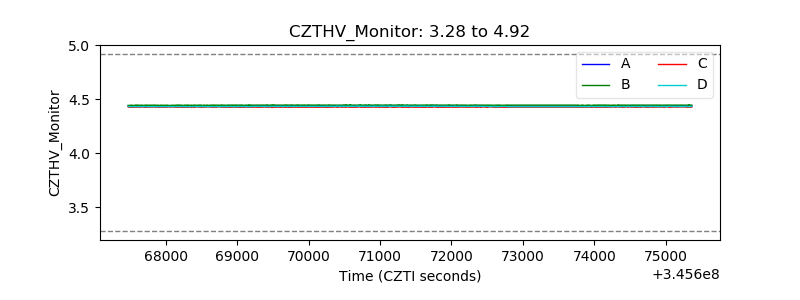 |
| D_VDD | 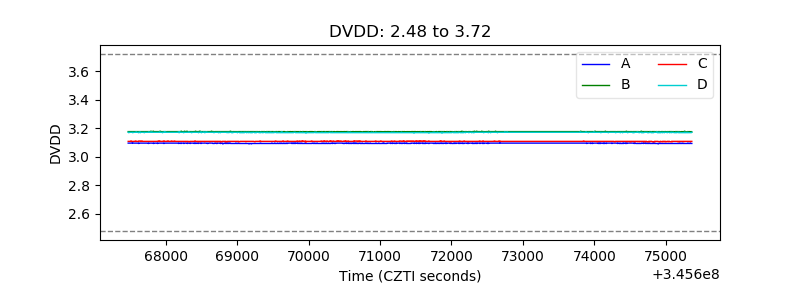 |
| Temperature 1 |  |
| Veto HV Monitor | 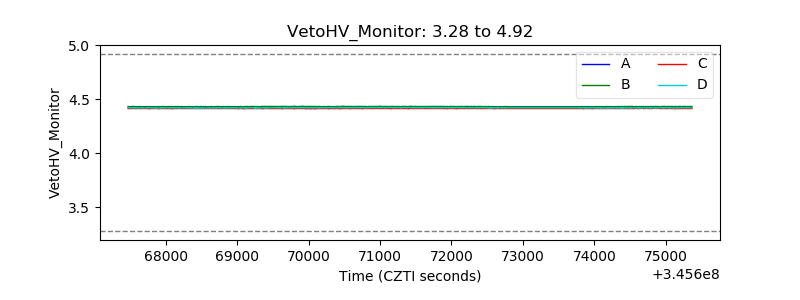 |
| Veto LLD | 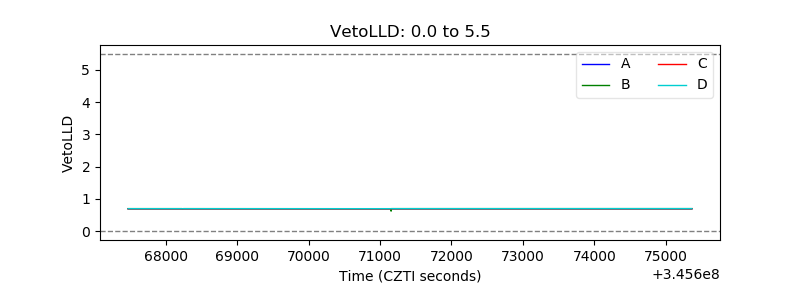 |
| Alpha Counter | 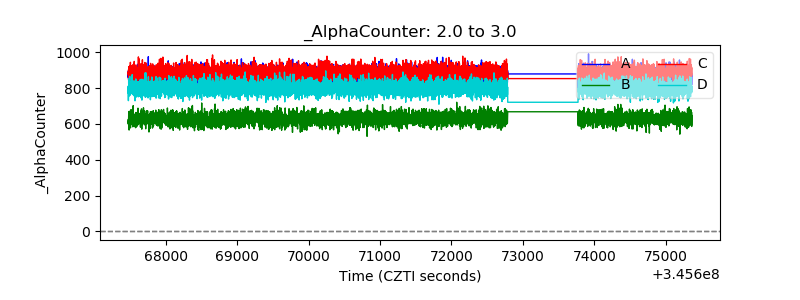 |
| _CPM_Rate | 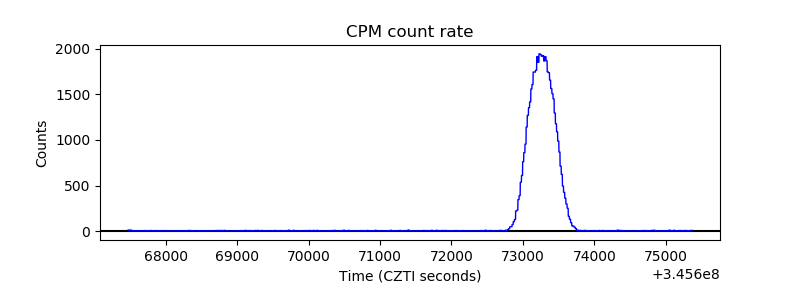 |
| CZT Counter | 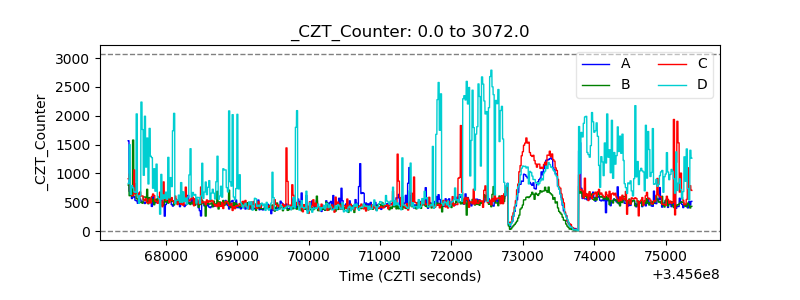 |
| +2.5 Volts monitor |  |
| +5 Volts monitor |  |
| _ROLL_ROT | 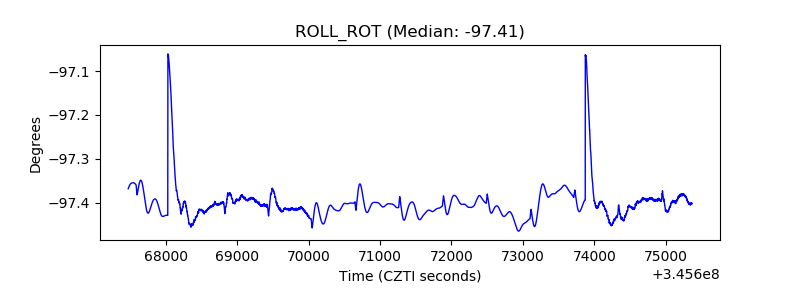 |
| _Roll_DEC | 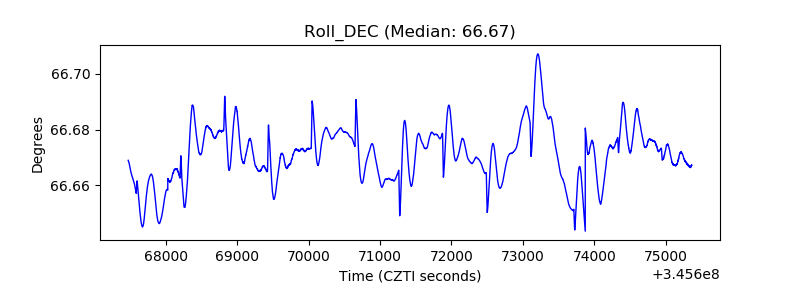 |
| _Roll_RA | 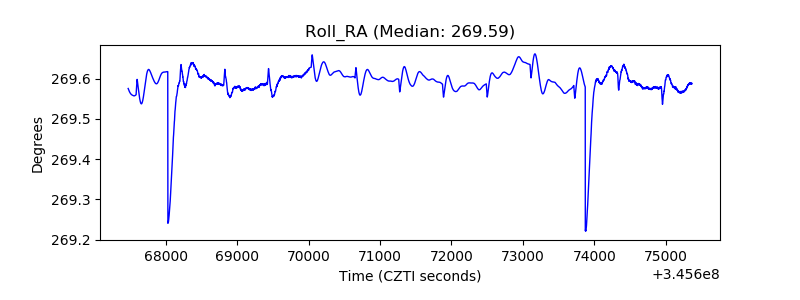 |
| Veto Counter | 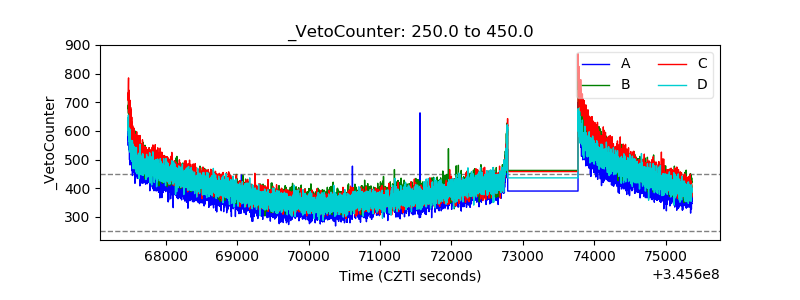 |