| Param | Original file | Final file |
|---|---|---|
| Filename | modeM0/AS1A10_090T16_9000004070_28194cztM0_level2.evt | modeM0/AS1A10_090T16_9000004070_28194cztM0_level2_quad_clean.evt |
| Size (bytes) | 568,186,560 | 76,645,440 |
| Size | 541.9 MB | 73.1 MB |
| Events in quadrant A | 3,243,764 | 476,366 |
| Events in quadrant B | 3,207,143 | 483,773 |
| Events in quadrant C | 3,494,147 | 467,522 |
| Events in quadrant D | 6,819,201 | 436,394 |
| Mode M0 | |||
|---|---|---|---|
| Quadrant | BADHDUFLAG | Total packets | Discarded packets |
| A | 0 | 14025 | 0 |
| B | 0 | 13833 | 0 |
| C | 0 | 14708 | 0 |
| D | 0 | 24897 | 0 |
| Mode M9 | |||
|---|---|---|---|
| Quadrant | BADHDUFLAG | Total packets | Discarded packets |
| A | 0 | 11 | 0 |
| B | 0 | 11 | 0 |
| C | 0 | 11 | 0 |
| D | 0 | 11 | 0 |
| Quadrant | Total seconds | Saturated seconds | Saturation percentage |
|---|---|---|---|
| A | 6548 | 49 | 0.748320% |
| B | 6548 | 65 | 0.992670% |
| C | 6548 | 127 | 1.939524% |
| D | 6549 | 508 | 7.756909% |
Noise dominated data is calculated using 1-second bins in cleaned event files. If a bin has >2000 counts, and if more than 50% of those come from <1% of pixels, then it is considered to be noise-dominated and hence unusable.
| Quadrant | # 1 sec bins | Bins with >0 counts | Bins with >2000 counts | High rate bins dominated by noise | Noise dominated (total time) | Noise dominated (detector-on time) | Marked lightcurve |
|---|---|---|---|---|---|---|---|
| A | 7633 | 6548 | 1 | 1 | 0.01% | 0.02% | 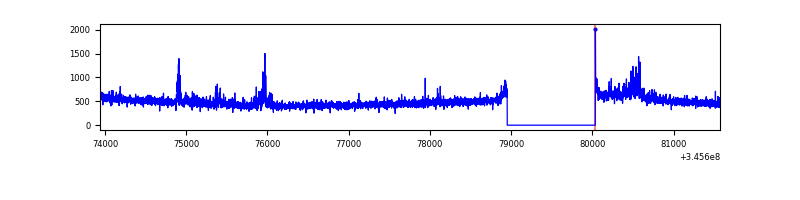 |
| B | 7633 | 6548 | 11 | 11 | 0.14% | 0.17% | 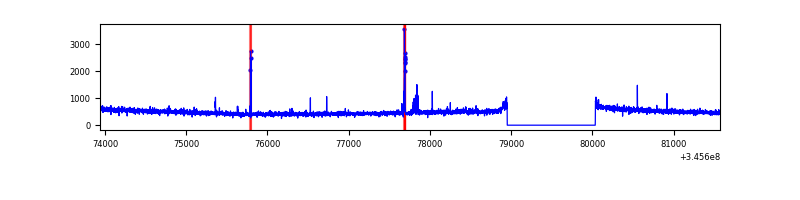 |
| C | 7633 | 6548 | 7 | 7 | 0.09% | 0.11% | 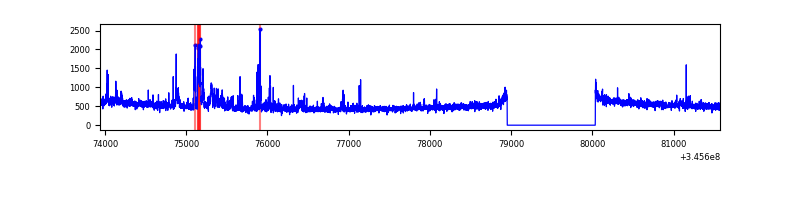 |
| D | 7634 | 6549 | 413 | 413 | 5.41% | 6.31% | 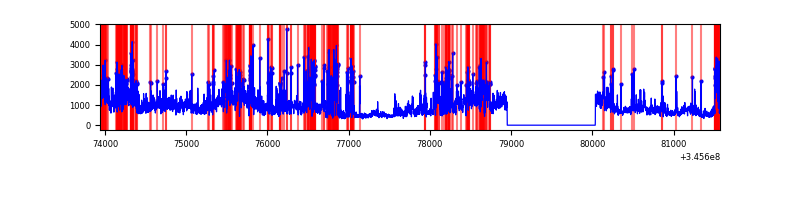 |
Top three noisy pixels from each quadrant. If the there are fewer than three noisy pixels in the level2.evt file, extra rows are filled as -1
| Pixel properties | Quadrant properties | ||||||
|---|---|---|---|---|---|---|---|
| Quadrant | DetID | PixID | Counts | Sigma | Mean | Median | Sigma |
| A | 12 | 16 | 136385 | 844.27 | 798 | 781 | 160.6 |
| A | 12 | 194 | 26932 | 162.82 | 798 | 781 | 160.6 |
| A | 13 | 254 | 9977 | 57.25 | 798 | 781 | 160.6 |
| B | 0 | 230 | 32452 | 209.95 | 798 | 776 | 150.9 |
| B | 15 | 222 | 30800 | 199.0 | 798 | 776 | 150.9 |
| B | 12 | 111 | 18779 | 119.33 | 798 | 776 | 150.9 |
| C | 3 | 233 | 314350 | 1731.63 | 776 | 782 | 181.1 |
| C | 14 | 238 | 126371 | 693.54 | 776 | 782 | 181.1 |
| C | 15 | 208 | 29589 | 159.08 | 776 | 782 | 181.1 |
| D | 1 | 52 | 2428670 | 13524.51 | 760 | 738 | 179.5 |
| D | 5 | 222 | 1304759 | 7263.89 | 760 | 738 | 179.5 |
| D | 7 | 80 | 96567 | 533.8 | 760 | 738 | 179.5 |
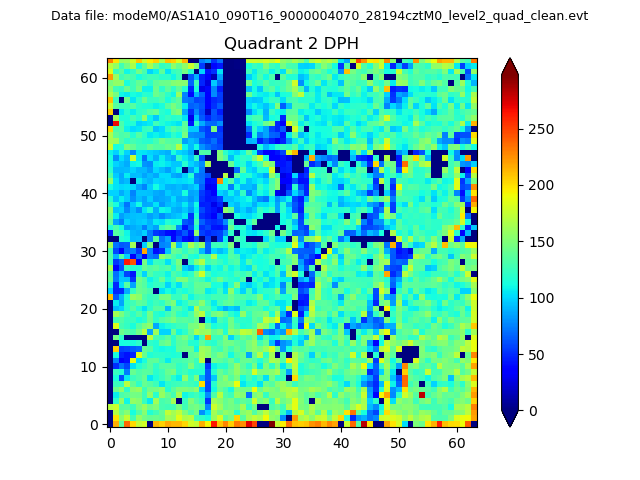
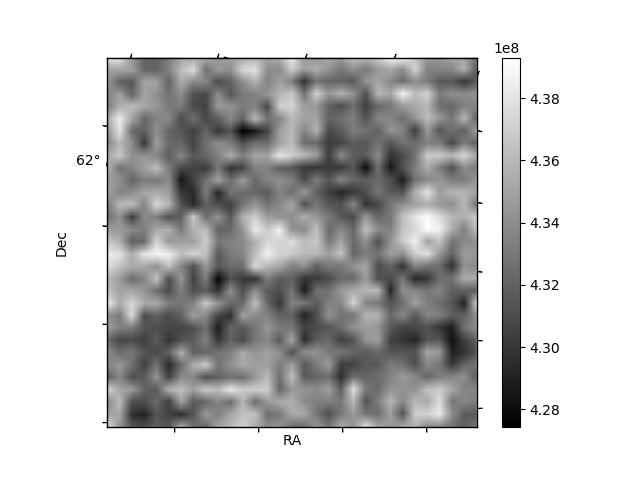
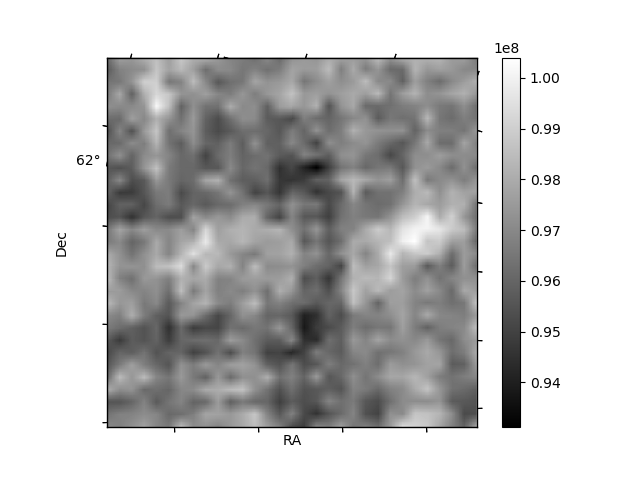
Histogram calculated using DETX and DETY for each event in the final _common_clean file
| Quadrant A | 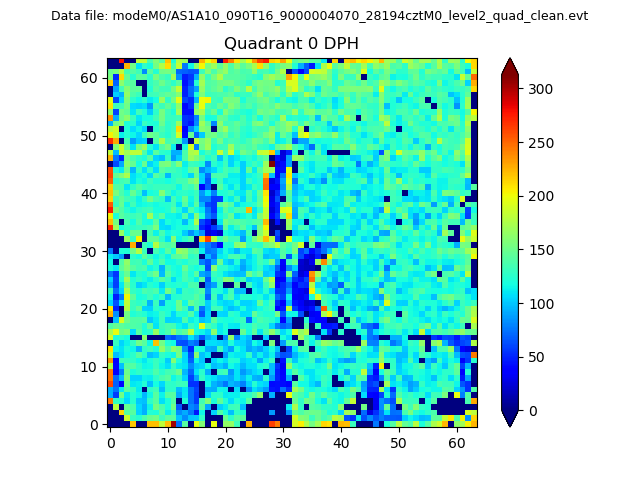 |
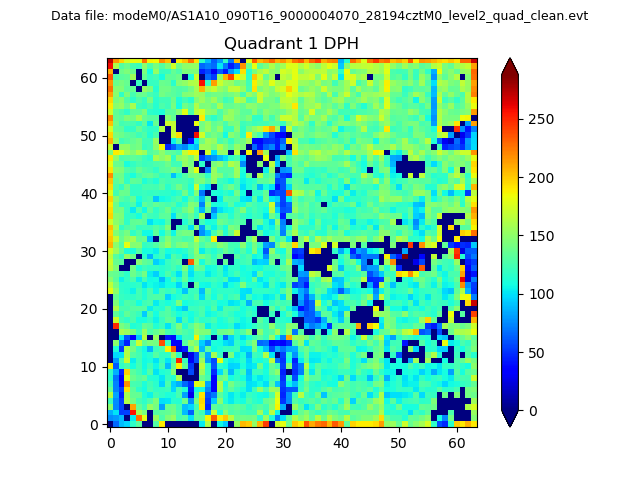 |
Quadrant B |
|---|---|---|---|
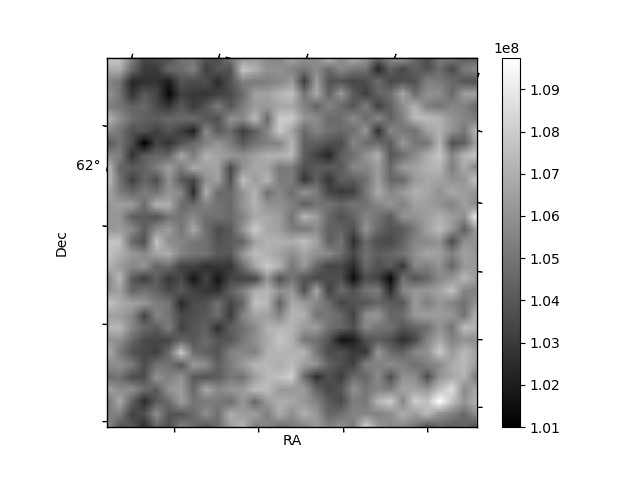
| Quadrant D | 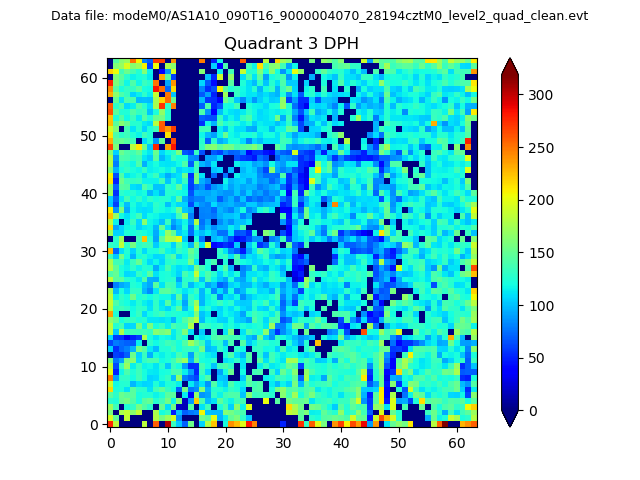 |
 |
Quadrant C |
| Plot type | Count rate plots | Images |
|---|---|---|
| Comparison with Poisson distribution Blue bars denote a histogram of data divided into 1 sec bins. Red curve is a Poisson curve with rate = median count rate of data. |
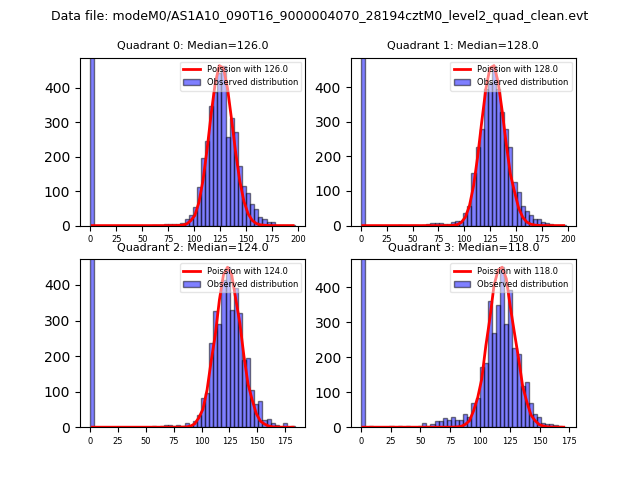 |
 |
| Quadrant-wise count rates Data is divided into 100 sec bins |
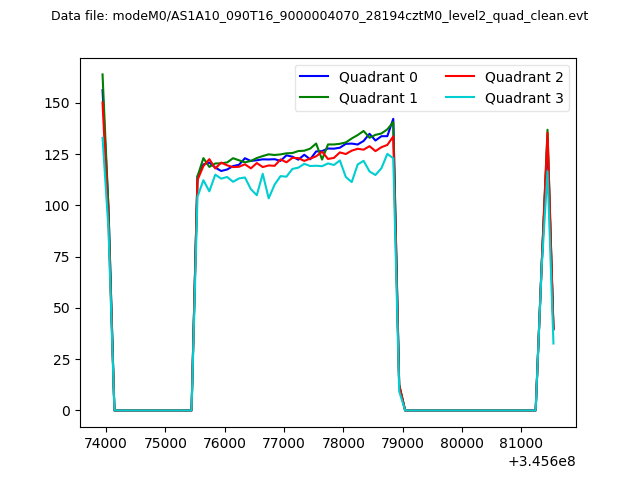 |
|
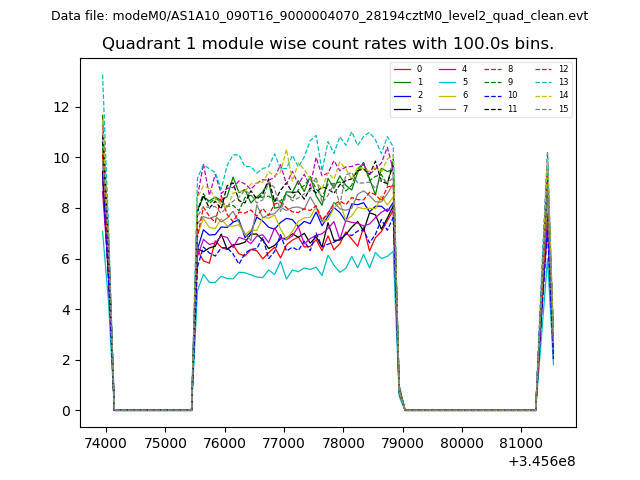
| Module-wise count rates for Quadrant A Data is divided into 100 sec bins |
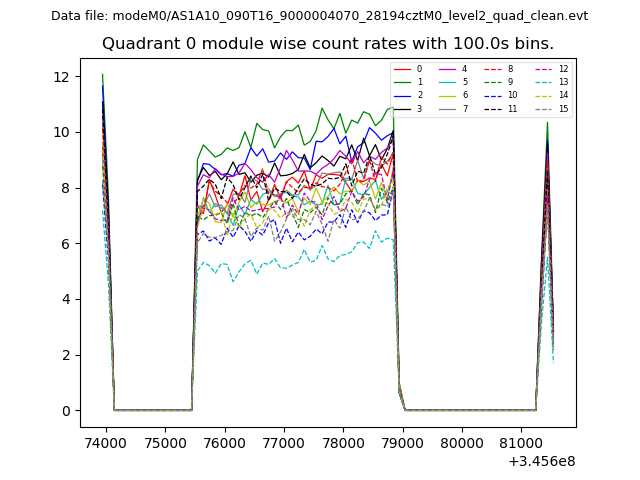 |
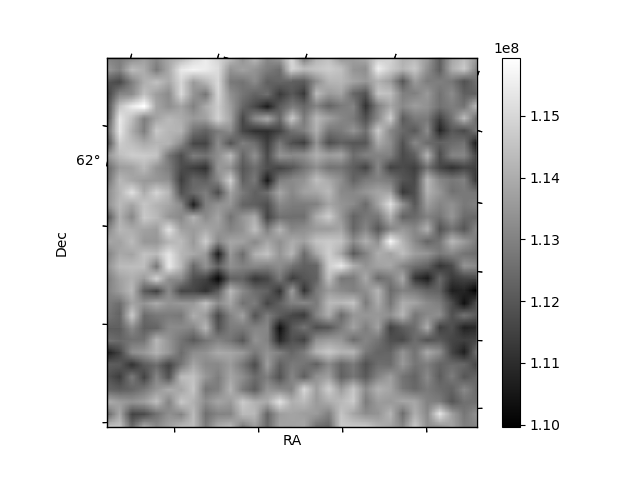 |
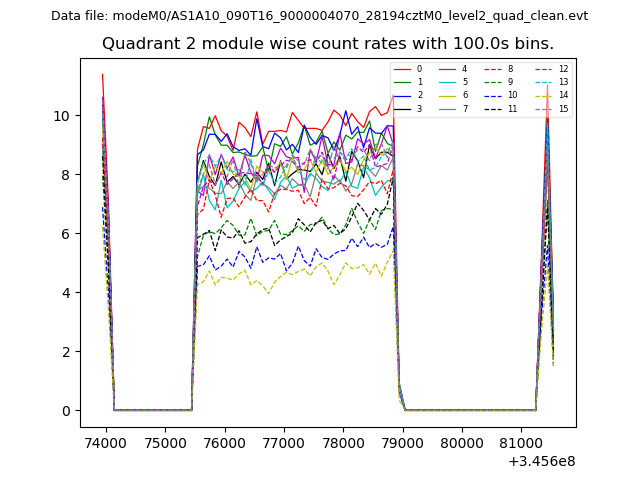
| Module-wise count rates for Quadrant B Data is divided into 100 sec bins |
 |
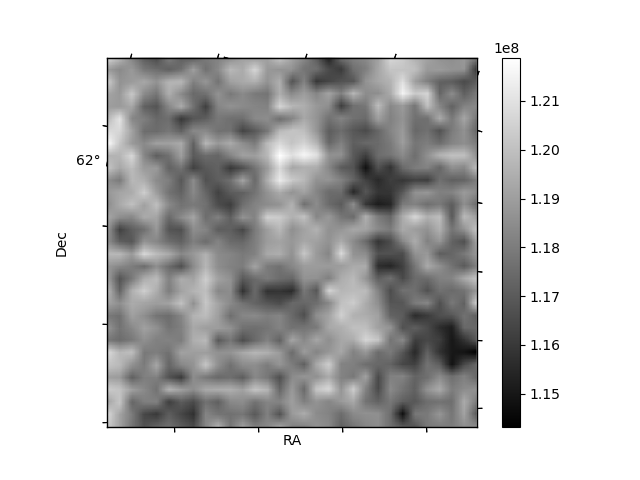 |
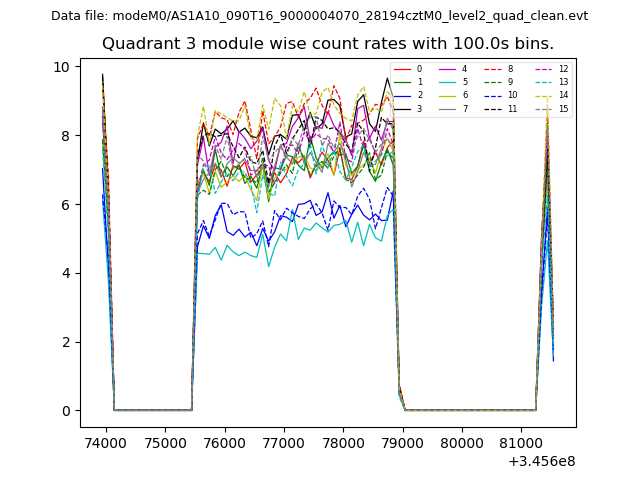
| Module-wise count rates for Quadrant C Data is divided into 100 sec bins |
 |
 |
| Module-wise count rates for Quadrant D Data is divided into 100 sec bins |
 |
 |
| Parameter | Plot |
|---|---|
| CZT HV Monitor | 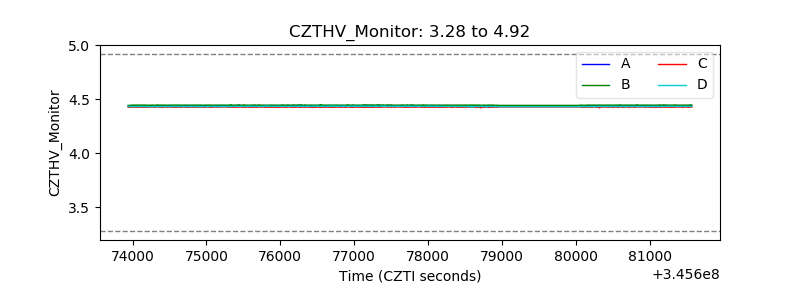 |
| D_VDD | 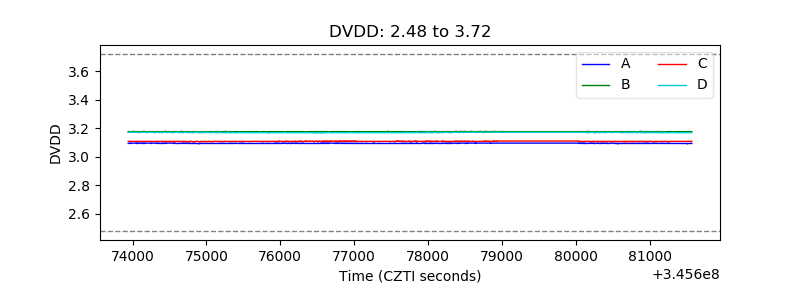 |
| Temperature 1 | 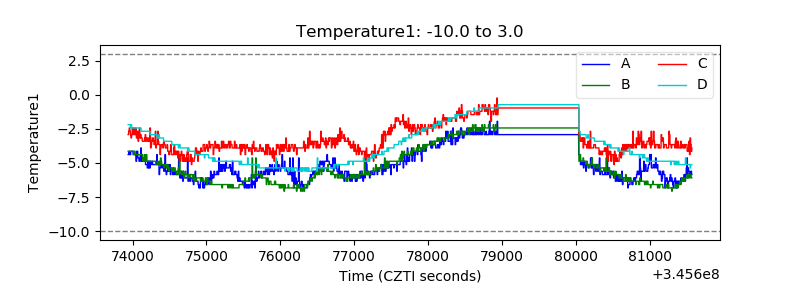 |
| Veto HV Monitor | 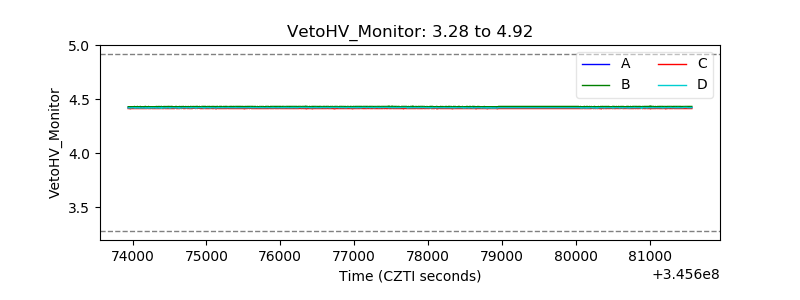 |
| Veto LLD | 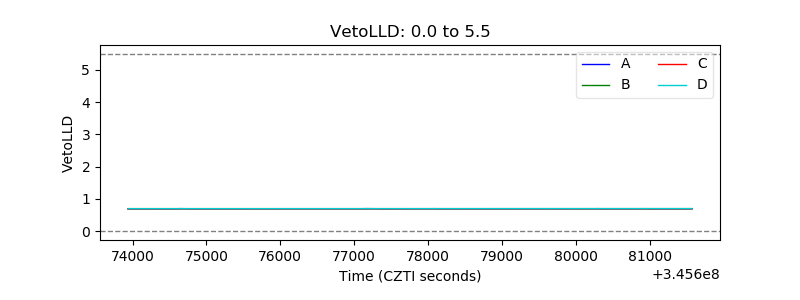 |
| Alpha Counter | 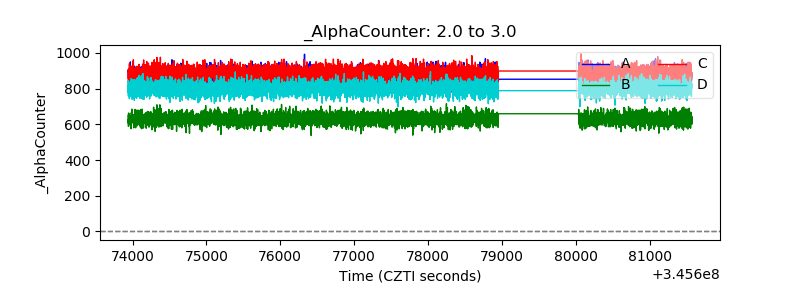 |
| _CPM_Rate | 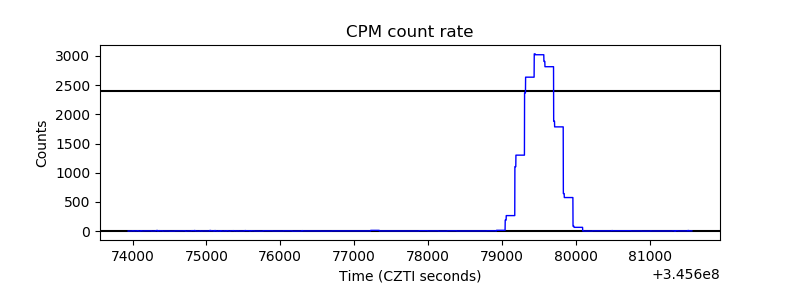 |
| CZT Counter | 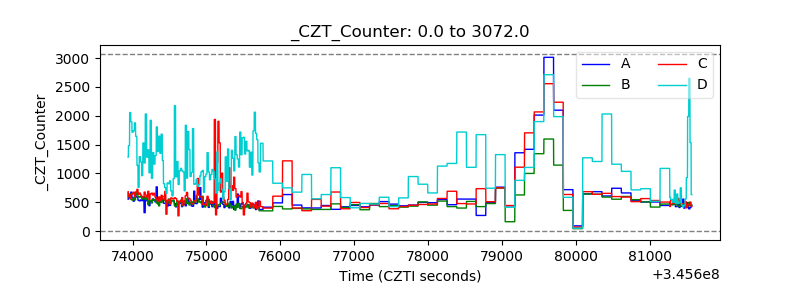 |
| +2.5 Volts monitor | 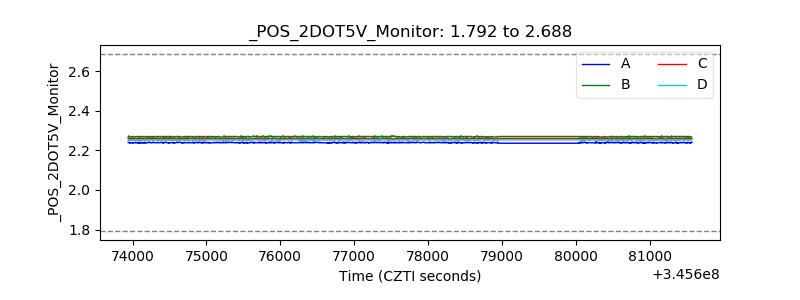 |
| +5 Volts monitor | 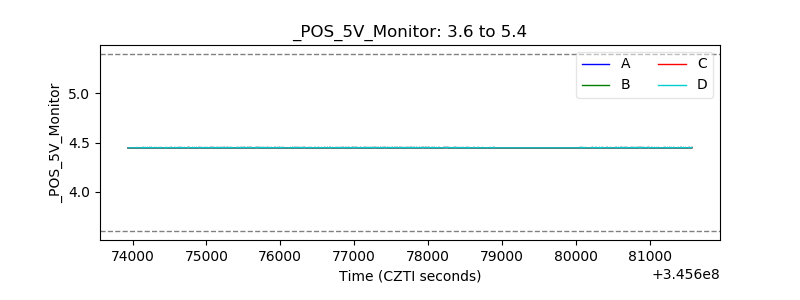 |
| _ROLL_ROT | 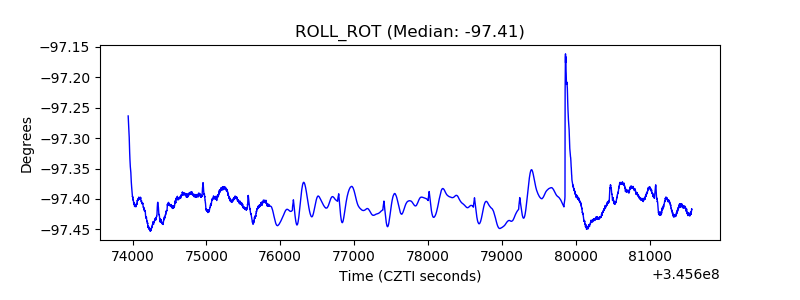 |
| _Roll_DEC | 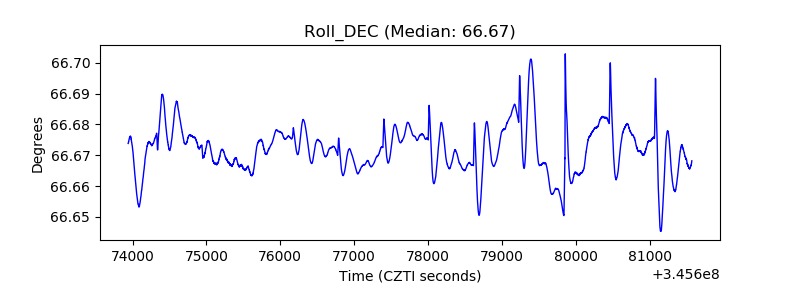 |
| _Roll_RA | 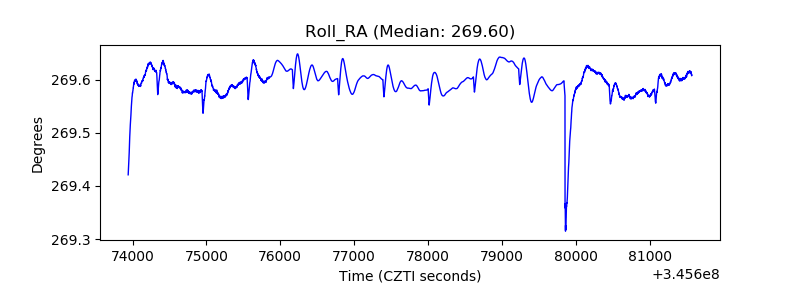 |
| Veto Counter | 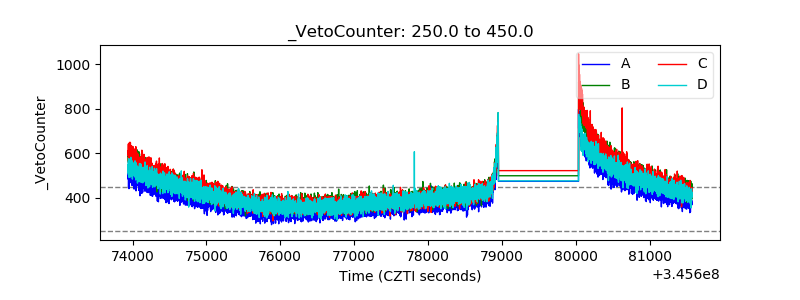 |