| Param | Original file | Final file |
|---|---|---|
| Filename | modeM0/AS1A10_090T16_9000004070_28195cztM0_level2.evt | modeM0/AS1A10_090T16_9000004070_28195cztM0_level2_quad_clean.evt |
| Size (bytes) | 521,959,680 | 84,047,040 |
| Size | 497.8 MB | 80.2 MB |
| Events in quadrant A | 3,163,946 | 537,347 |
| Events in quadrant B | 3,146,482 | 547,413 |
| Events in quadrant C | 3,332,126 | 525,605 |
| Events in quadrant D | 5,737,006 | 494,131 |
| Mode M0 | |||
|---|---|---|---|
| Quadrant | BADHDUFLAG | Total packets | Discarded packets |
| A | 0 | 13622 | 0 |
| B | 0 | 13511 | 0 |
| C | 0 | 14038 | 0 |
| D | 0 | 21404 | 0 |
| Mode M9 | |||
|---|---|---|---|
| Quadrant | BADHDUFLAG | Total packets | Discarded packets |
| A | 0 | 17 | 2 |
| B | 0 | 17 | 1 |
| C | 0 | 17 | 1 |
| D | 0 | 18 | 3 |
| Quadrant | Total seconds | Saturated seconds | Saturation percentage |
|---|---|---|---|
| A | 6310 | 47 | 0.744849% |
| B | 6305 | 51 | 0.808882% |
| C | 6307 | 109 | 1.728238% |
| D | 6302 | 452 | 7.172326% |
Noise dominated data is calculated using 1-second bins in cleaned event files. If a bin has >2000 counts, and if more than 50% of those come from <1% of pixels, then it is considered to be noise-dominated and hence unusable.
| Quadrant | # 1 sec bins | Bins with >0 counts | Bins with >2000 counts | High rate bins dominated by noise | Noise dominated (total time) | Noise dominated (detector-on time) | Marked lightcurve |
|---|---|---|---|---|---|---|---|
| A | 7561 | 6320 | 2 | 2 | 0.03% | 0.03% | 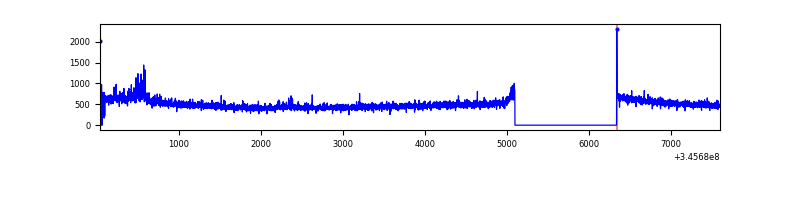 |
| B | 7561 | 6318 | 1 | 1 | 0.01% | 0.02% | 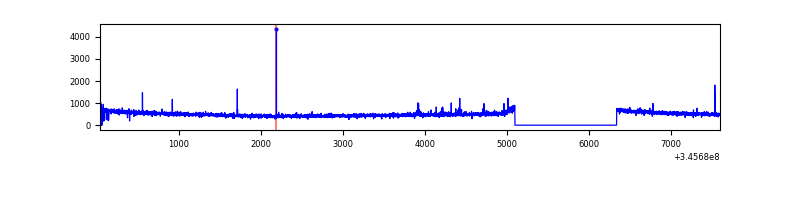 |
| C | 7560 | 6318 | 6 | 6 | 0.08% | 0.09% | 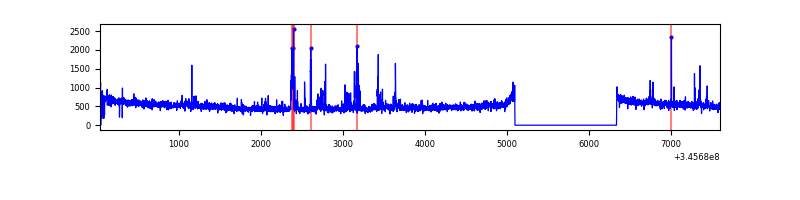 |
| D | 7560 | 6316 | 405 | 405 | 5.36% | 6.41% | 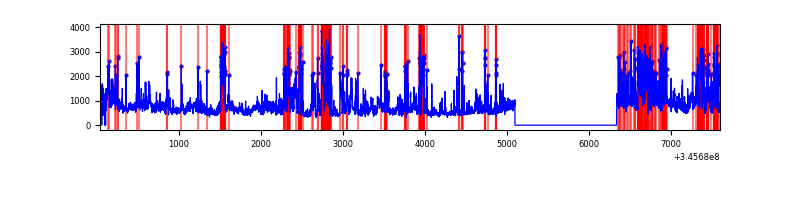 |
Top three noisy pixels from each quadrant. If the there are fewer than three noisy pixels in the level2.evt file, extra rows are filled as -1
| Pixel properties | Quadrant properties | ||||||
|---|---|---|---|---|---|---|---|
| Quadrant | DetID | PixID | Counts | Sigma | Mean | Median | Sigma |
| A | 12 | 16 | 71751 | 445.93 | 794 | 779 | 159.2 |
| A | 12 | 194 | 16948 | 101.59 | 794 | 779 | 159.2 |
| A | 8 | 192 | 10550 | 61.39 | 794 | 779 | 159.2 |
| B | 0 | 230 | 20257 | 128.69 | 793 | 774 | 151.4 |
| B | 12 | 111 | 18233 | 115.32 | 793 | 774 | 151.4 |
| B | 11 | 111 | 16347 | 102.86 | 793 | 774 | 151.4 |
| C | 3 | 233 | 208125 | 1164.84 | 768 | 774 | 178.0 |
| C | 14 | 238 | 125337 | 699.76 | 768 | 774 | 178.0 |
| C | 13 | 61 | 5121 | 24.42 | 768 | 774 | 178.0 |
| D | 1 | 52 | 2378821 | 13364.29 | 752 | 733 | 177.9 |
| D | 5 | 222 | 292254 | 1638.28 | 752 | 733 | 177.9 |
| D | 8 | 195 | 140553 | 785.76 | 752 | 733 | 177.9 |
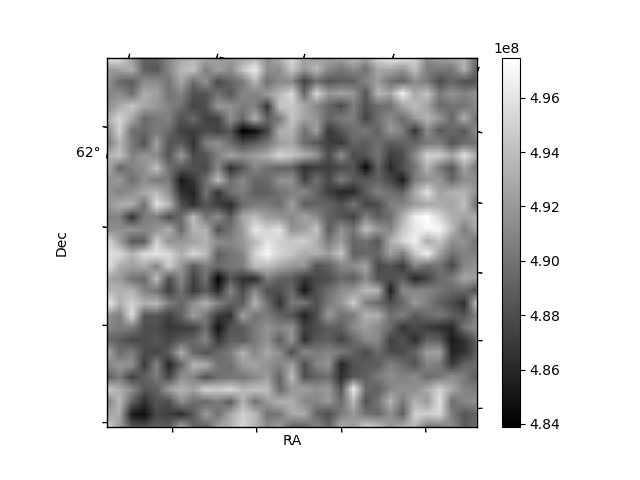
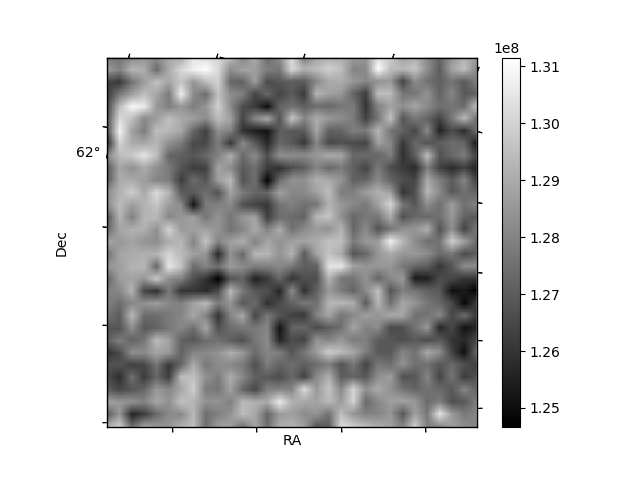
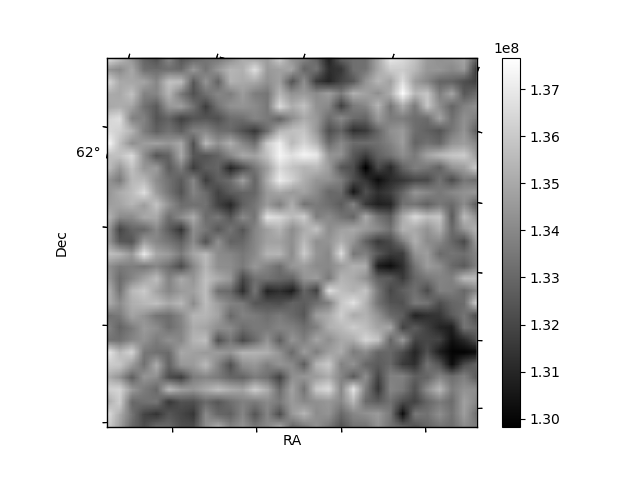
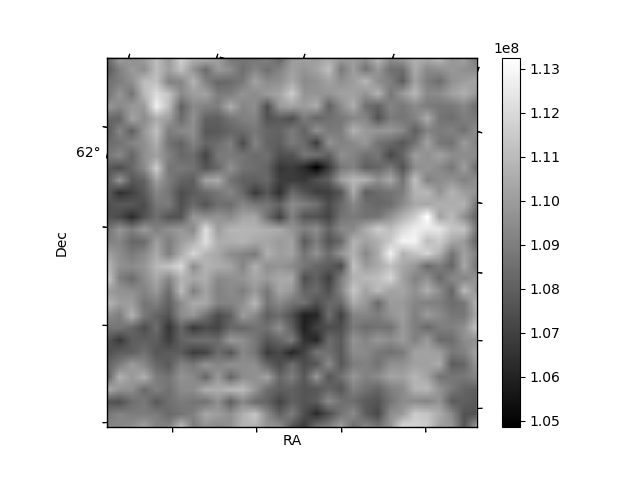
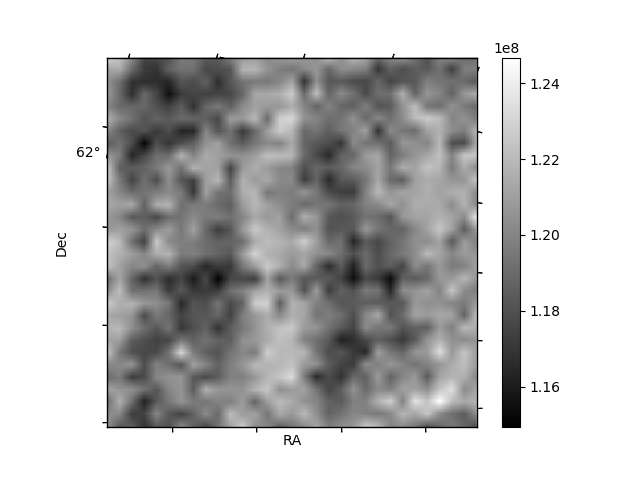
Histogram calculated using DETX and DETY for each event in the final _common_clean file
| Quadrant A | 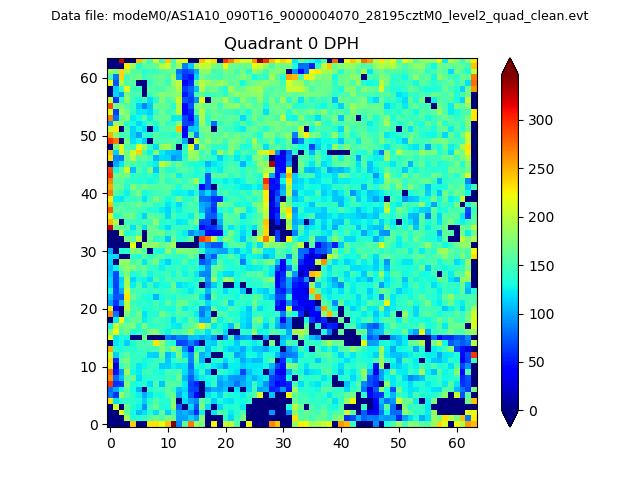 |
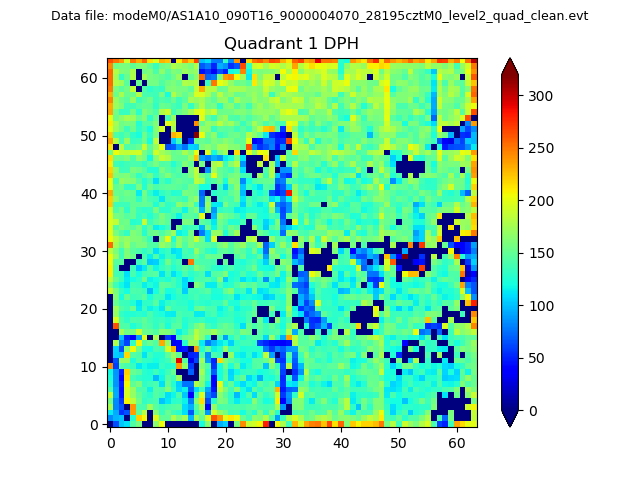 |
Quadrant B |
|---|---|---|---|
| Quadrant D | 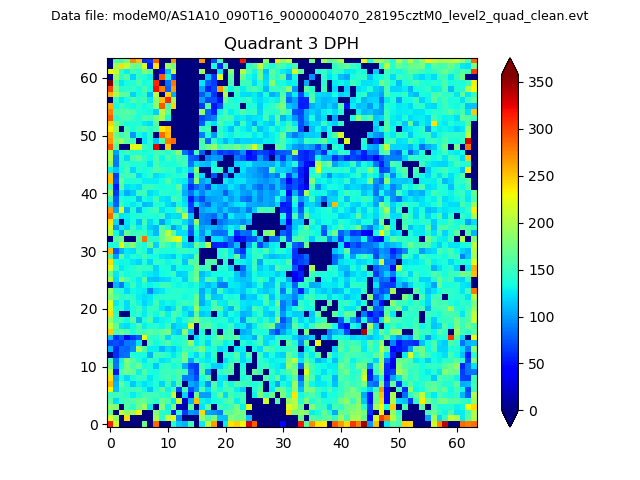 |
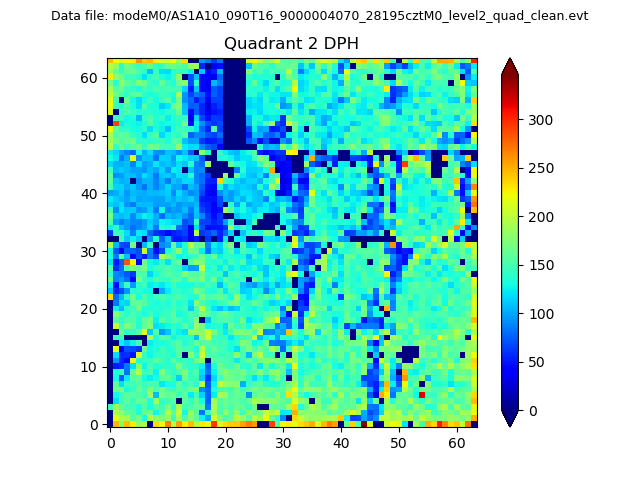 |
Quadrant C |
| Plot type | Count rate plots | Images |
|---|---|---|
| Comparison with Poisson distribution Blue bars denote a histogram of data divided into 1 sec bins. Red curve is a Poisson curve with rate = median count rate of data. |
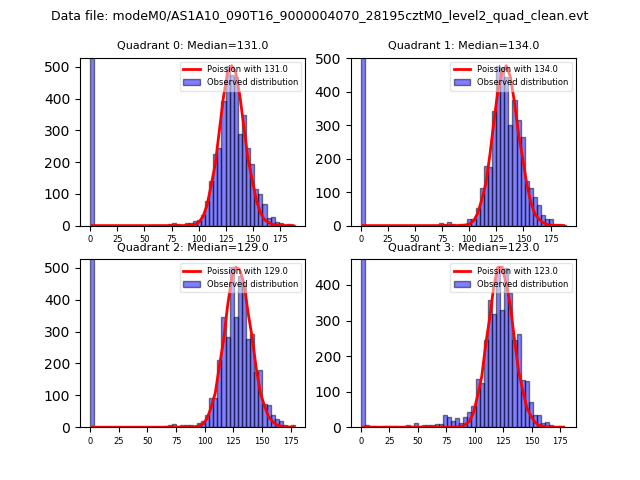 |
 |
| Quadrant-wise count rates Data is divided into 100 sec bins |
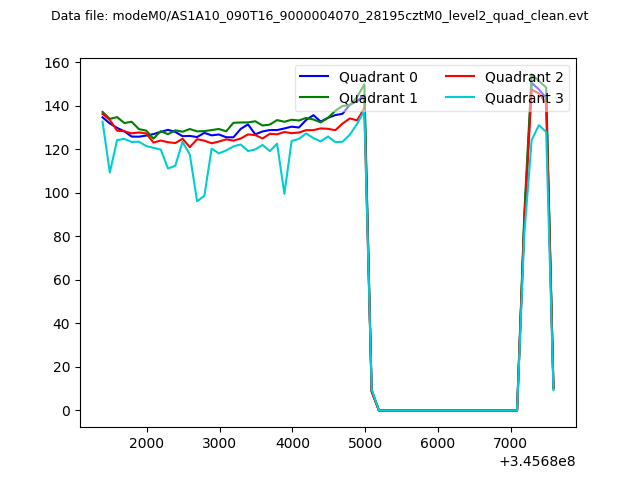 |
|
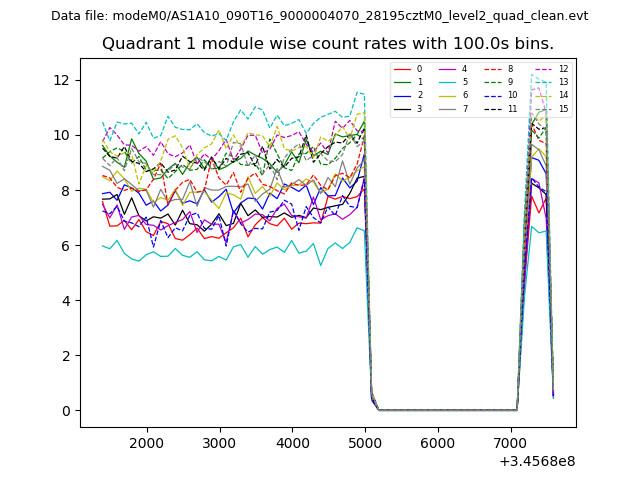
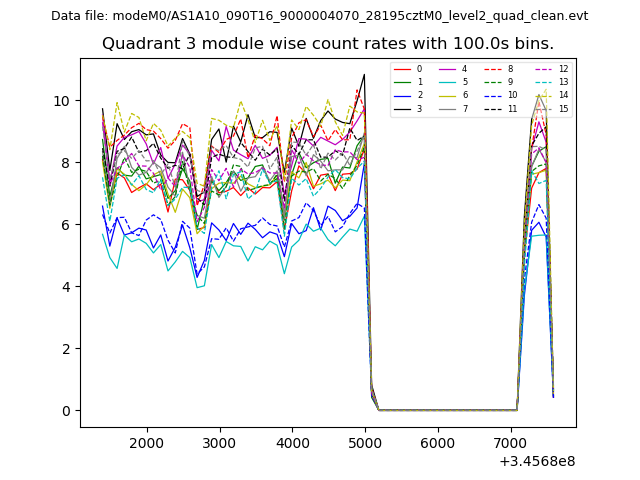
| Module-wise count rates for Quadrant A Data is divided into 100 sec bins |
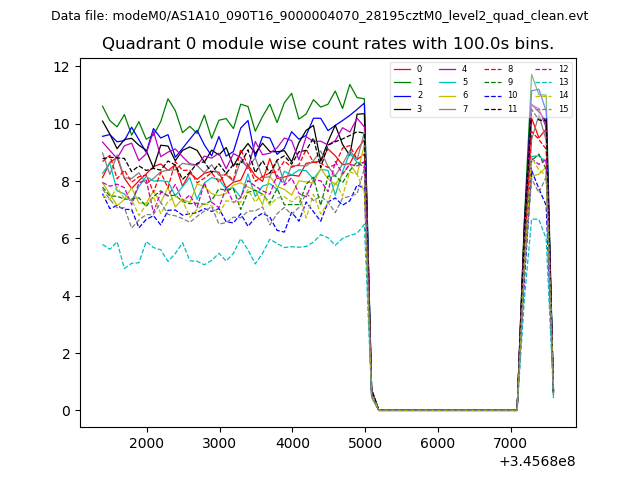 |
 |
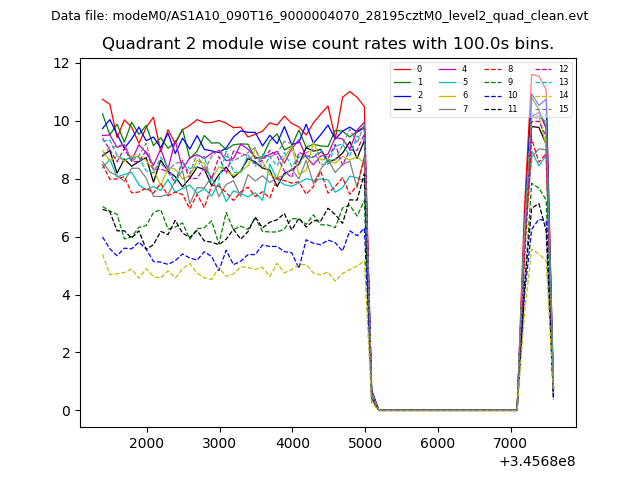
| Module-wise count rates for Quadrant B Data is divided into 100 sec bins |
 |
 |
| Module-wise count rates for Quadrant C Data is divided into 100 sec bins |
 |
 |
| Module-wise count rates for Quadrant D Data is divided into 100 sec bins |
 |
 |
| Parameter | Plot |
|---|---|
| CZT HV Monitor |  |
| D_VDD | 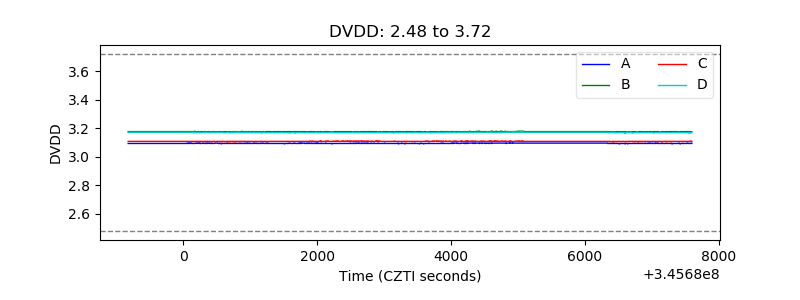 |
| Temperature 1 |  |
| Veto HV Monitor | 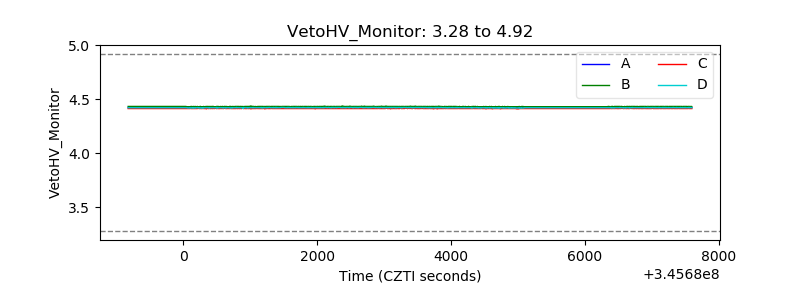 |
| Veto LLD |  |
| Alpha Counter | 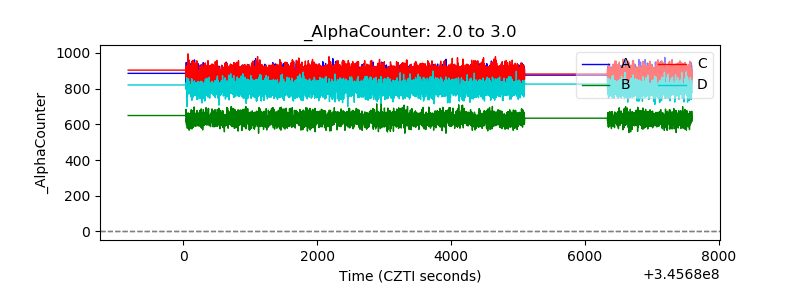 |
| _CPM_Rate | 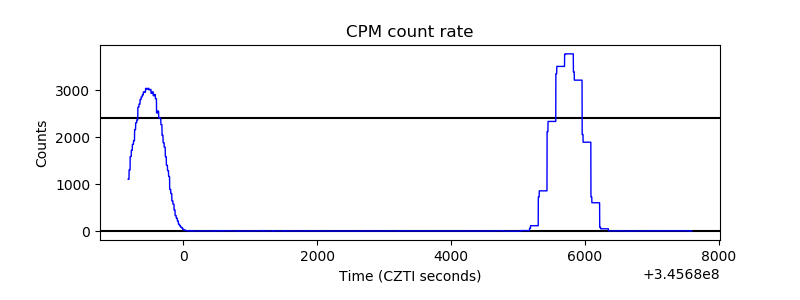 |
| CZT Counter | 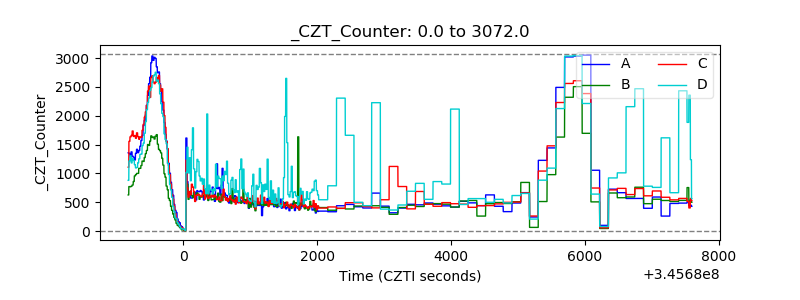 |
| +2.5 Volts monitor |  |
| +5 Volts monitor |  |
| _ROLL_ROT | 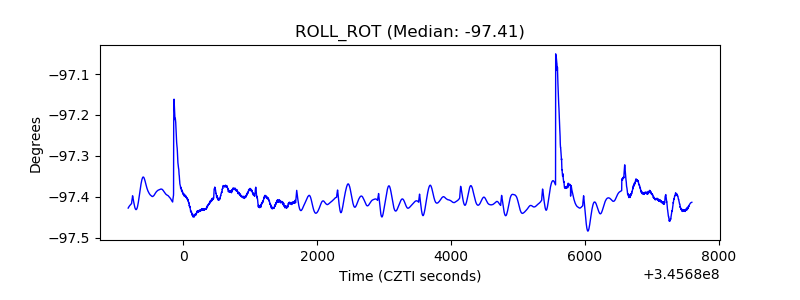 |
| _Roll_DEC | 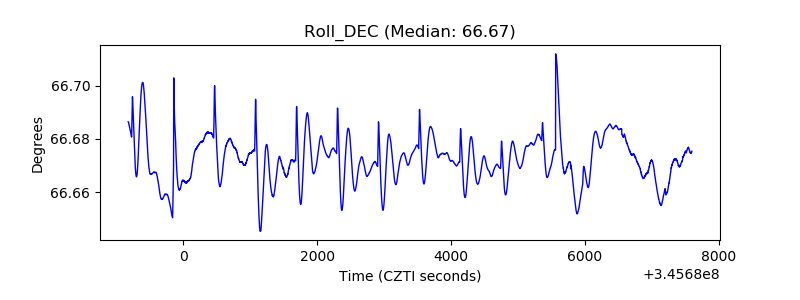 |
| _Roll_RA | 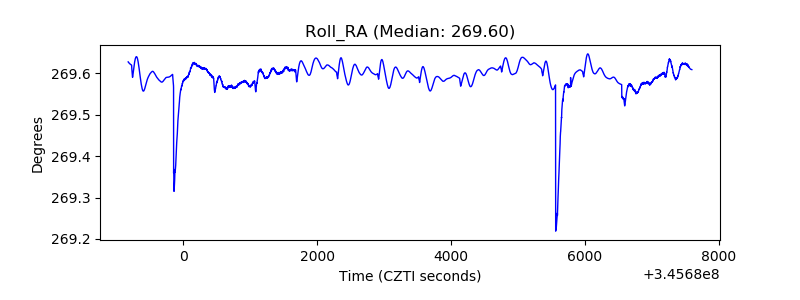 |
| Veto Counter | 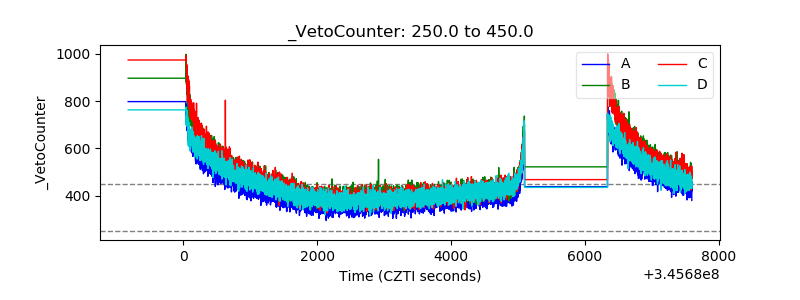 |