| Param | Original file | Final file |
|---|---|---|
| Filename | modeM0/AS1A10_045T09_9000004072_28196cztM0_level2.evt | modeM0/AS1A10_045T09_9000004072_28196cztM0_level2_quad_clean.evt |
| Size (bytes) | 326,214,720 | 63,152,640 |
| Size | 311.1 MB | 60.2 MB |
| Events in quadrant A | 1,976,479 | 422,247 |
| Events in quadrant B | 1,979,243 | 433,737 |
| Events in quadrant C | 2,145,393 | 404,275 |
| Events in quadrant D | 3,518,502 | 382,839 |
| Mode M0 | |||
|---|---|---|---|
| Quadrant | BADHDUFLAG | Total packets | Discarded packets |
| A | 0 | 8229 | 0 |
| B | 0 | 8238 | 0 |
| C | 0 | 8774 | 0 |
| D | 0 | 13093 | 0 |
| Mode M9 | |||
|---|---|---|---|
| Quadrant | BADHDUFLAG | Total packets | Discarded packets |
| A | 0 | 13 | 0 |
| B | 0 | 13 | 0 |
| C | 0 | 13 | 0 |
| D | 0 | 13 | 0 |
| Quadrant | Total seconds | Saturated seconds | Saturation percentage |
|---|---|---|---|
| A | 3805 | 41 | 1.077530% |
| B | 3793 | 43 | 1.133667% |
| C | 3797 | 110 | 2.897024% |
| D | 3783 | 218 | 5.762622% |
Noise dominated data is calculated using 1-second bins in cleaned event files. If a bin has >2000 counts, and if more than 50% of those come from <1% of pixels, then it is considered to be noise-dominated and hence unusable.
| Quadrant | # 1 sec bins | Bins with >0 counts | Bins with >2000 counts | High rate bins dominated by noise | Noise dominated (total time) | Noise dominated (detector-on time) | Marked lightcurve |
|---|---|---|---|---|---|---|---|
| A | 5338 | 3912 | 0 | 0 | 0.00% | 0.00% | 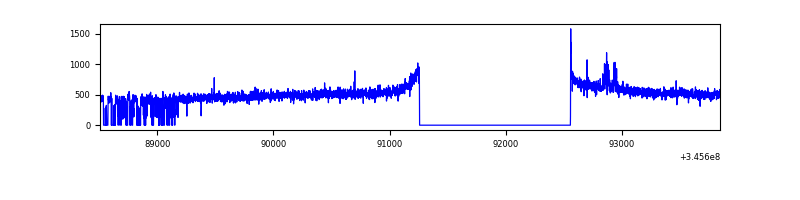 |
| B | 5338 | 3899 | 0 | 0 | 0.00% | 0.00% | 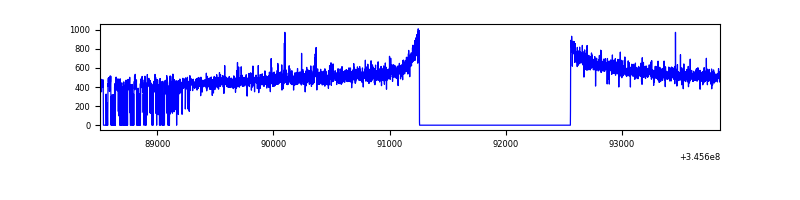 |
| C | 5338 | 3892 | 40 | 40 | 0.75% | 1.03% | 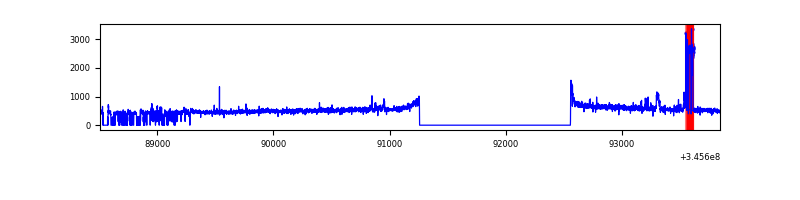 |
| D | 5337 | 3895 | 187 | 187 | 3.50% | 4.80% | 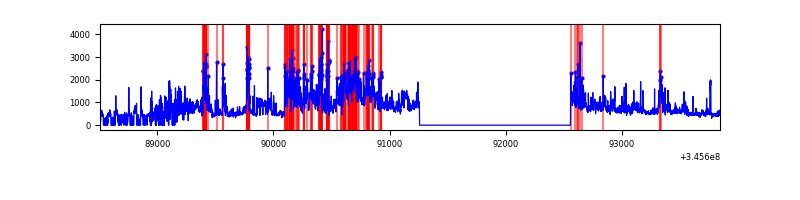 |
Top three noisy pixels from each quadrant. If the there are fewer than three noisy pixels in the level2.evt file, extra rows are filled as -1
| Pixel properties | Quadrant properties | ||||||
|---|---|---|---|---|---|---|---|
| Quadrant | DetID | PixID | Counts | Sigma | Mean | Median | Sigma |
| A | 12 | 16 | 19146 | 181.89 | 506 | 497 | 102.5 |
| A | 12 | 194 | 6301 | 56.61 | 506 | 497 | 102.5 |
| A | 13 | 254 | 5283 | 46.68 | 506 | 497 | 102.5 |
| B | 12 | 111 | 11286 | 112.97 | 502 | 490 | 95.6 |
| B | 11 | 111 | 10537 | 105.14 | 502 | 490 | 95.6 |
| B | 14 | 111 | 10209 | 101.7 | 502 | 490 | 95.6 |
| C | 3 | 233 | 203951 | 1823.32 | 478 | 483 | 111.6 |
| C | 14 | 238 | 77901 | 693.76 | 478 | 483 | 111.6 |
| C | 13 | 61 | 3153 | 23.93 | 478 | 483 | 111.6 |
| D | 1 | 52 | 1076417 | 9503.16 | 473 | 461 | 113.2 |
| D | 5 | 222 | 612119 | 5402.34 | 473 | 461 | 113.2 |
| D | 8 | 195 | 28801 | 250.31 | 473 | 461 | 113.2 |
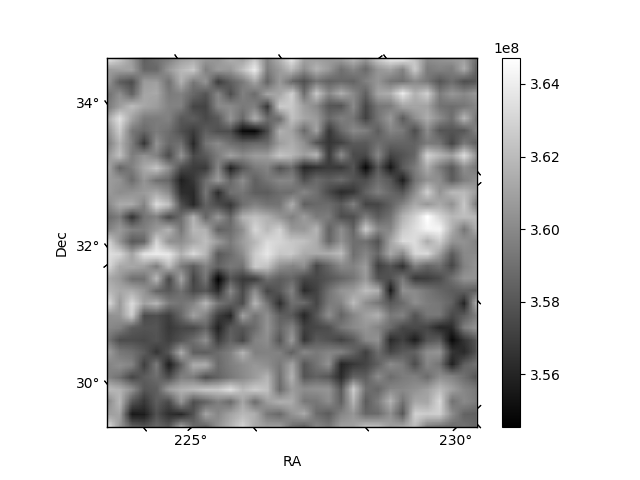
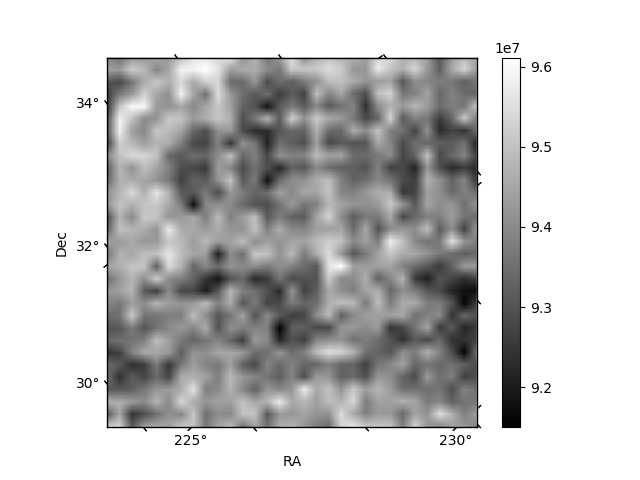
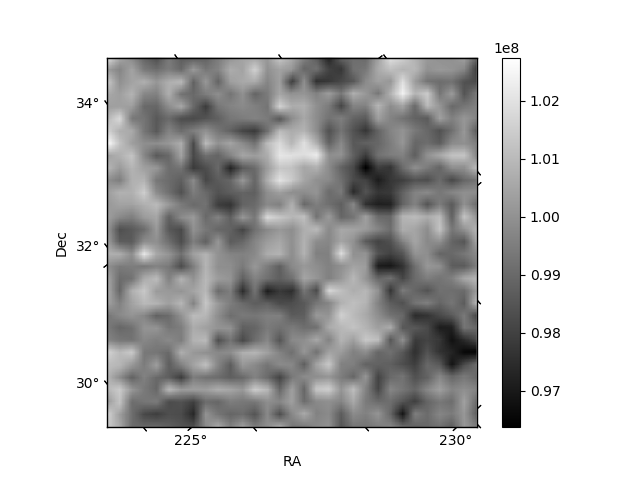
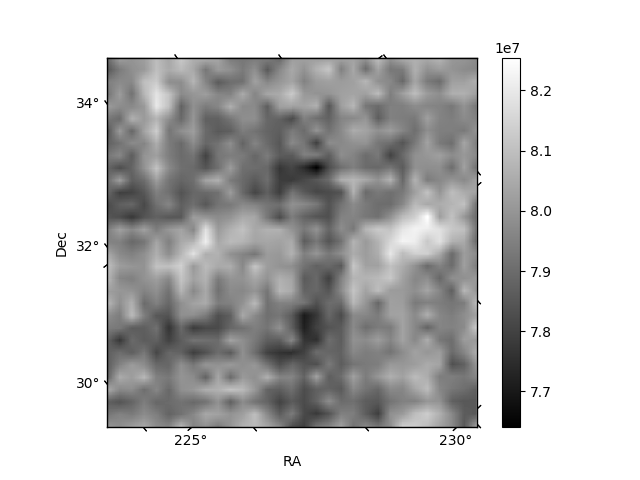
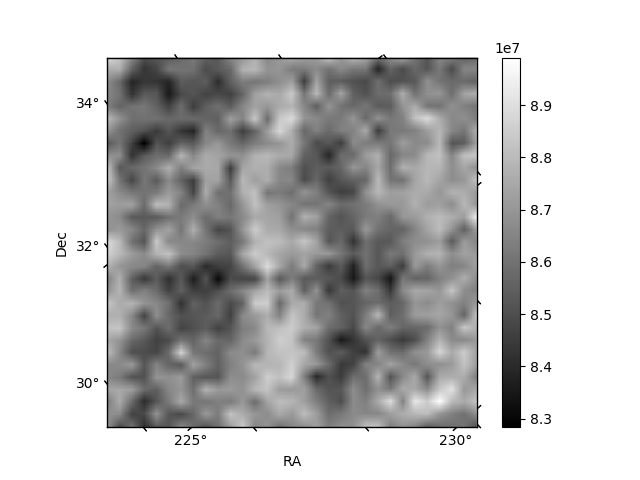
Histogram calculated using DETX and DETY for each event in the final _common_clean file
| Quadrant A | 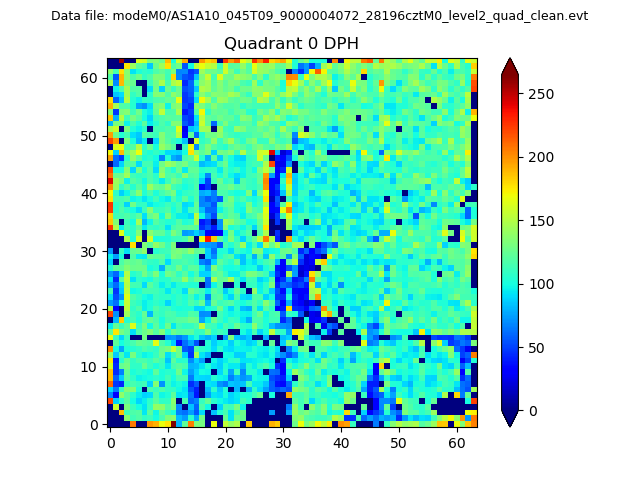 |
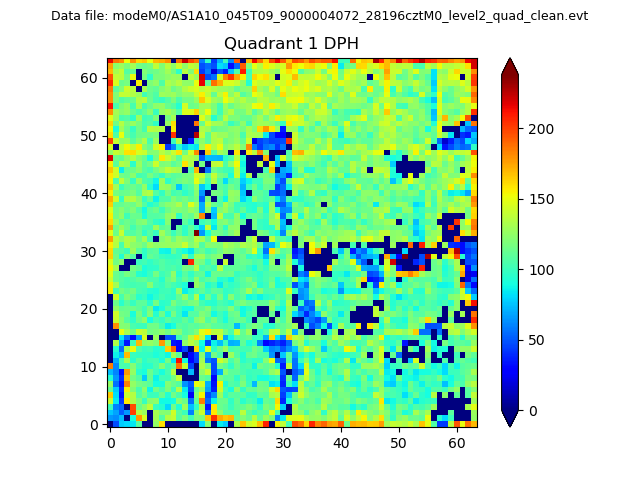 |
Quadrant B |
|---|---|---|---|
| Quadrant D | 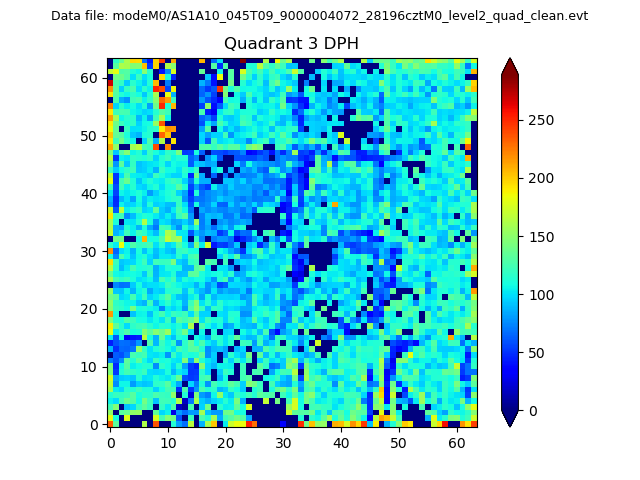 |
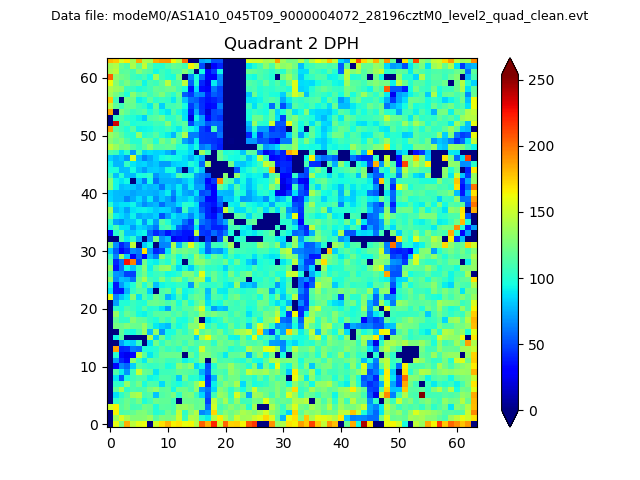 |
Quadrant C |
| Plot type | Count rate plots | Images |
|---|---|---|
| Comparison with Poisson distribution Blue bars denote a histogram of data divided into 1 sec bins. Red curve is a Poisson curve with rate = median count rate of data. |
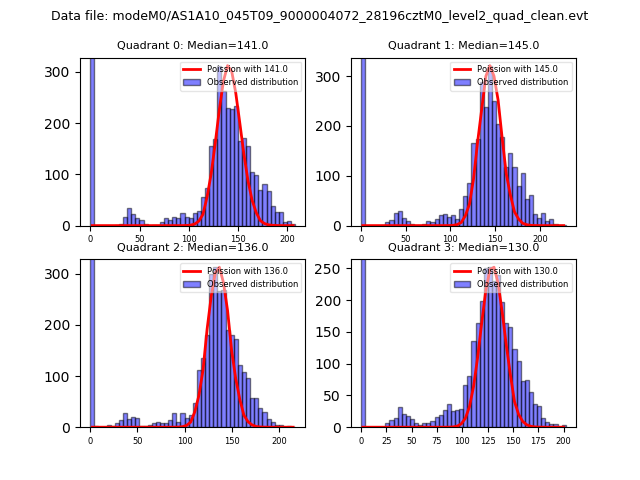 |
 |
| Quadrant-wise count rates Data is divided into 100 sec bins |
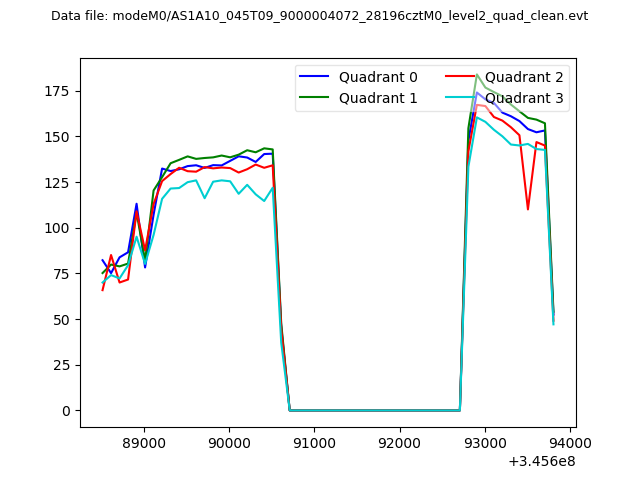 |
|
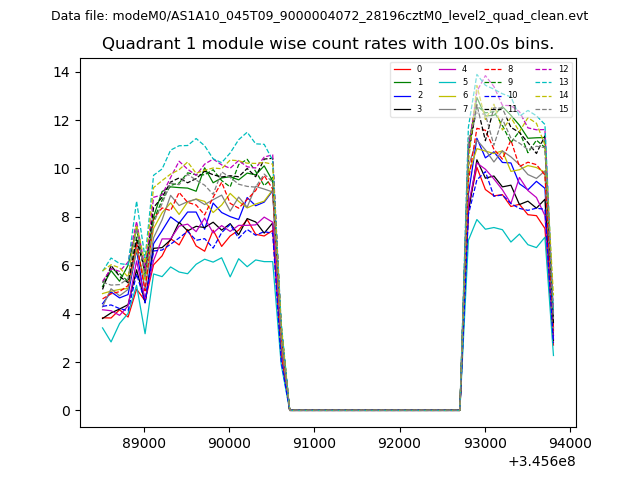
| Module-wise count rates for Quadrant A Data is divided into 100 sec bins |
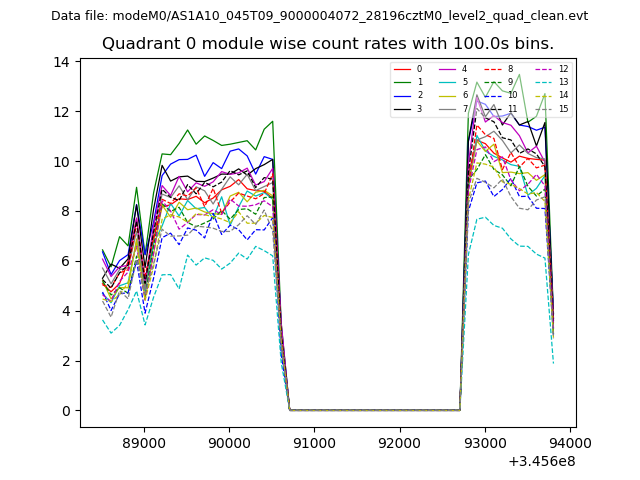 |
 |
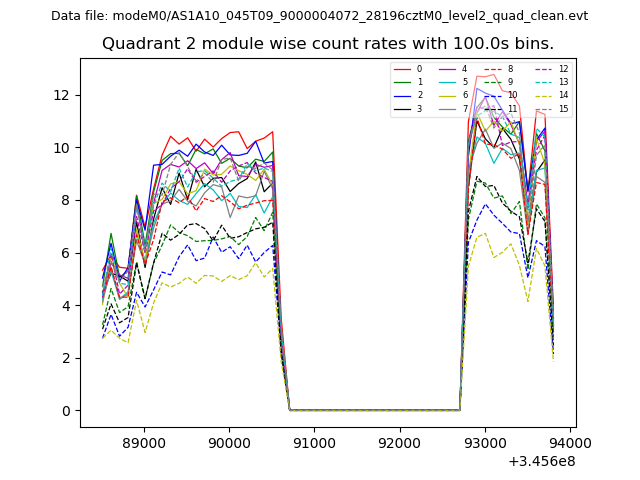
| Module-wise count rates for Quadrant B Data is divided into 100 sec bins |
 |
 |
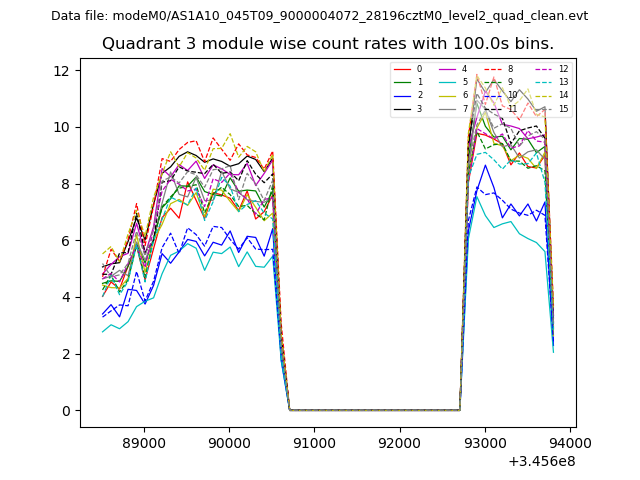
| Module-wise count rates for Quadrant C Data is divided into 100 sec bins |
 |
 |
| Module-wise count rates for Quadrant D Data is divided into 100 sec bins |
 |
 |
| Parameter | Plot |
|---|---|
| CZT HV Monitor | 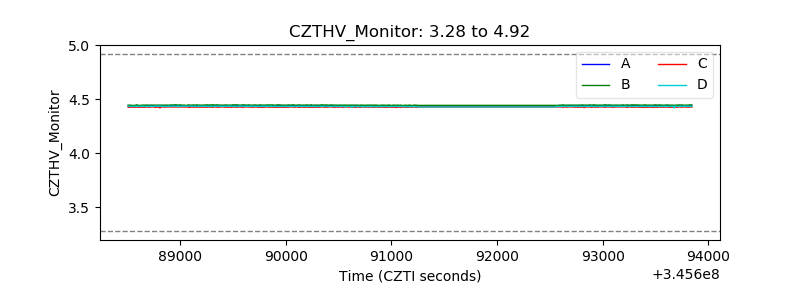 |
| D_VDD | 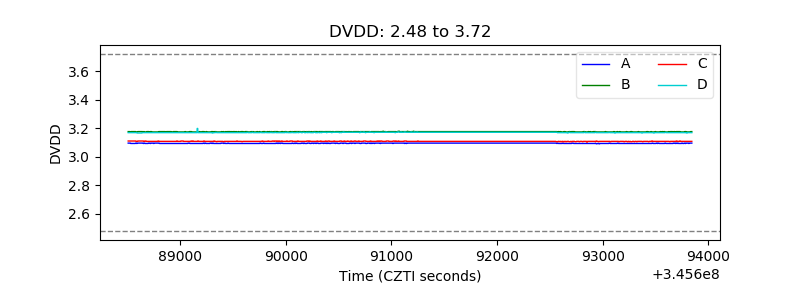 |
| Temperature 1 | 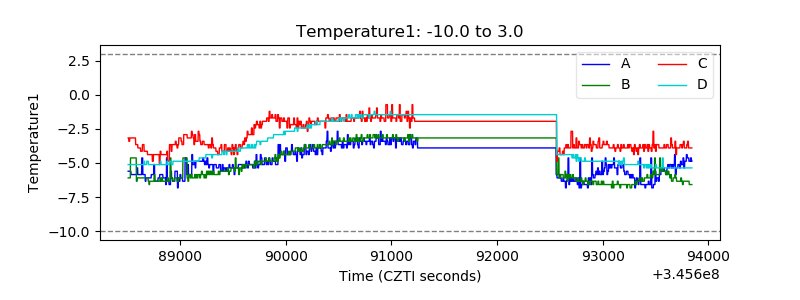 |
| Veto HV Monitor | 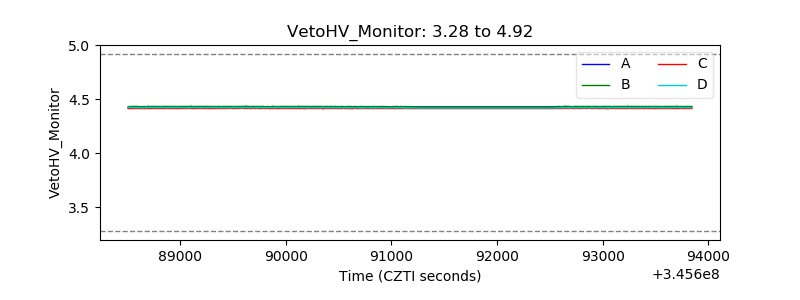 |
| Veto LLD | 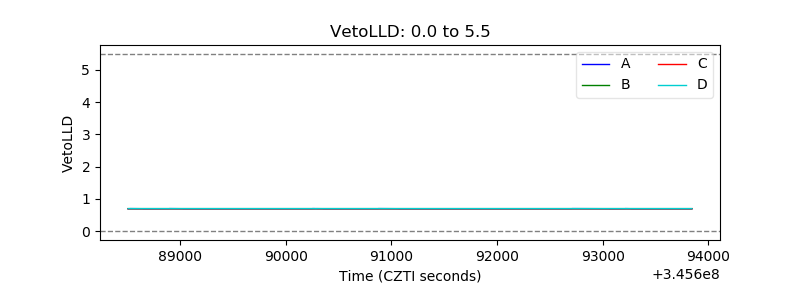 |
| Alpha Counter | 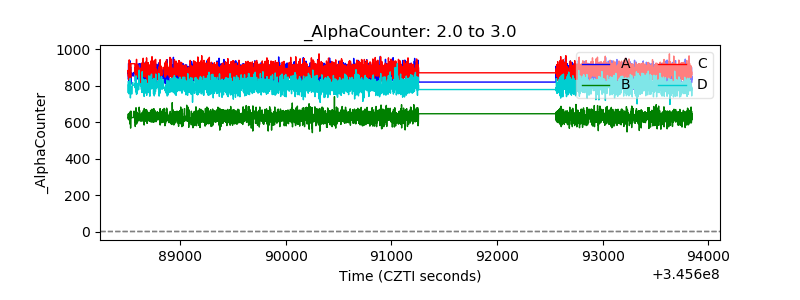 |
| _CPM_Rate | 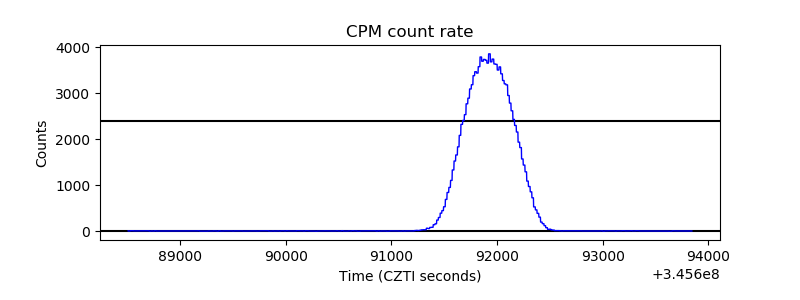 |
| CZT Counter | 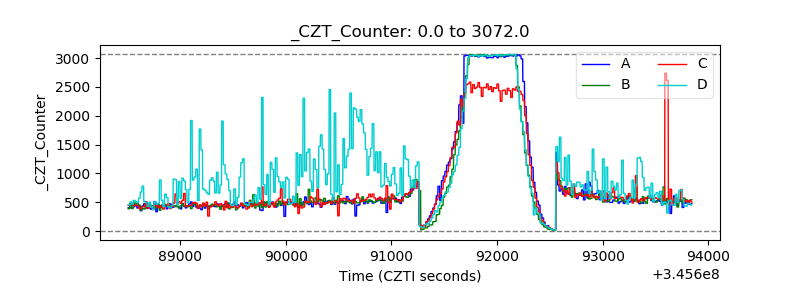 |
| +2.5 Volts monitor |  |
| +5 Volts monitor | 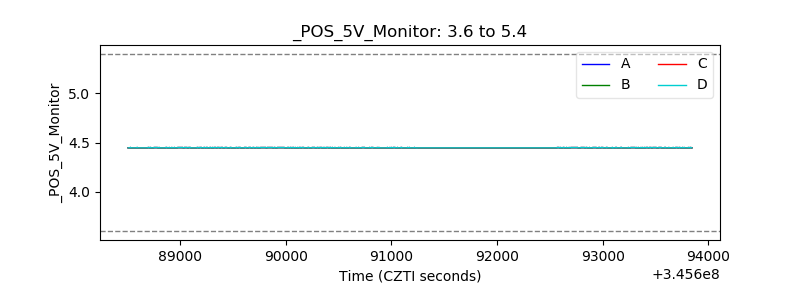 |
| _ROLL_ROT | 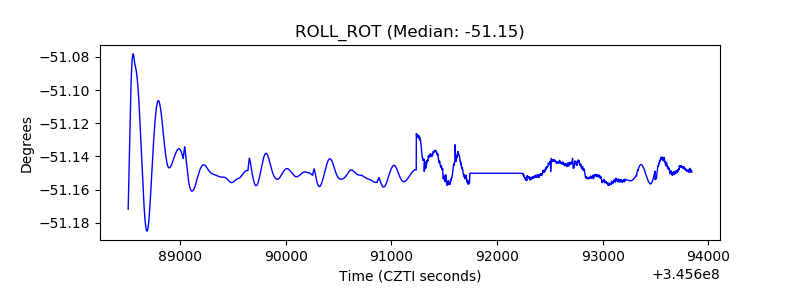 |
| _Roll_DEC | 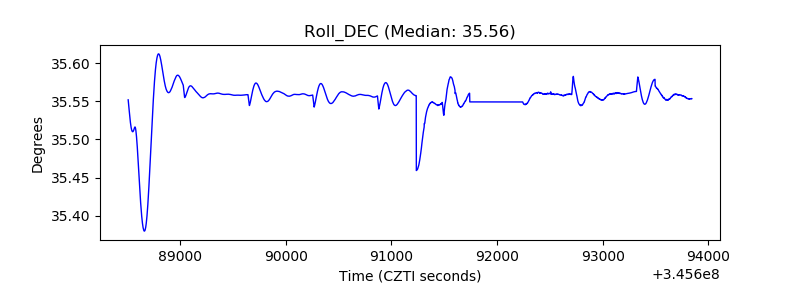 |
| _Roll_RA | 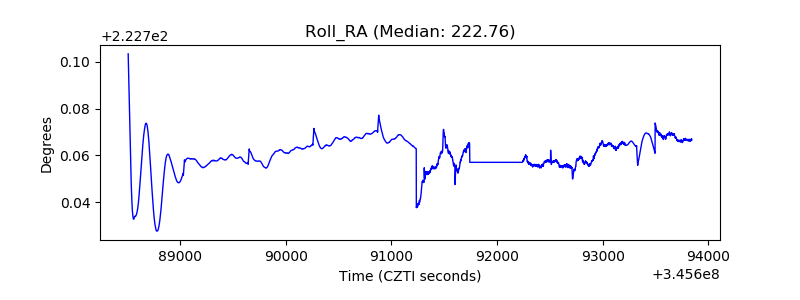 |
| Veto Counter | 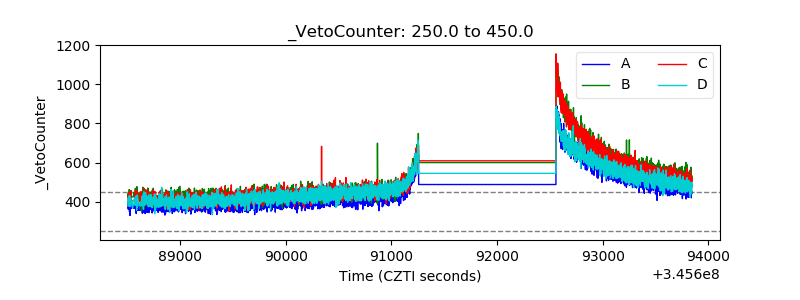 |