| Param | Original file | Final file |
|---|---|---|
| Filename | modeM0/AS1A10_045T09_9000004072_28198cztM0_level2.evt | modeM0/AS1A10_045T09_9000004072_28198cztM0_level2_quad_clean.evt |
| Size (bytes) | 476,867,520 | 95,512,320 |
| Size | 454.8 MB | 91.1 MB |
| Events in quadrant A | 2,949,649 | 633,986 |
| Events in quadrant B | 2,978,003 | 655,317 |
| Events in quadrant C | 2,920,188 | 611,000 |
| Events in quadrant D | 5,191,534 | 577,789 |
| Mode M0 | |||
|---|---|---|---|
| Quadrant | BADHDUFLAG | Total packets | Discarded packets |
| A | 0 | 12358 | 0 |
| B | 0 | 12468 | 0 |
| C | 0 | 12391 | 0 |
| D | 0 | 19540 | 0 |
| Mode M9 | |||
|---|---|---|---|
| Quadrant | BADHDUFLAG | Total packets | Discarded packets |
| A | 0 | 13 | 0 |
| B | 0 | 13 | 0 |
| C | 0 | 13 | 0 |
| D | 0 | 13 | 0 |
| Quadrant | Total seconds | Saturated seconds | Saturation percentage |
|---|---|---|---|
| A | 5933 | 37 | 0.623631% |
| B | 5934 | 59 | 0.994270% |
| C | 5934 | 75 | 1.263903% |
| D | 5934 | 476 | 8.021571% |
Noise dominated data is calculated using 1-second bins in cleaned event files. If a bin has >2000 counts, and if more than 50% of those come from <1% of pixels, then it is considered to be noise-dominated and hence unusable.
| Quadrant | # 1 sec bins | Bins with >0 counts | Bins with >2000 counts | High rate bins dominated by noise | Noise dominated (total time) | Noise dominated (detector-on time) | Marked lightcurve |
|---|---|---|---|---|---|---|---|
| A | 7188 | 5934 | 1 | 1 | 0.01% | 0.02% | 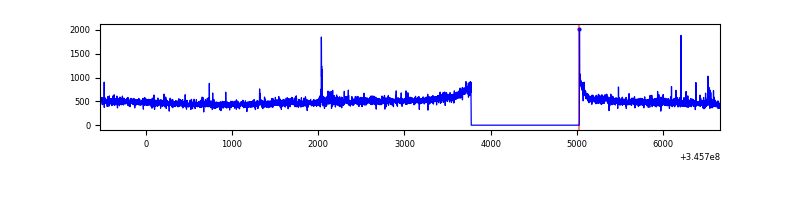 |
| B | 7189 | 5935 | 1 | 1 | 0.01% | 0.02% | 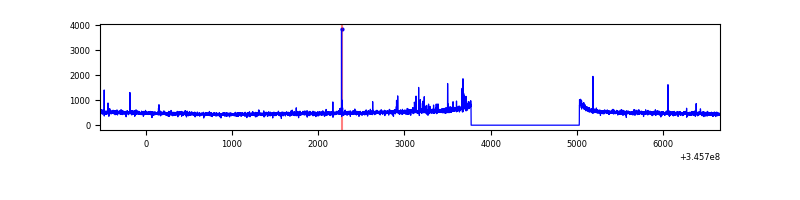 |
| C | 7189 | 5935 | 0 | 0 | 0.00% | 0.00% | 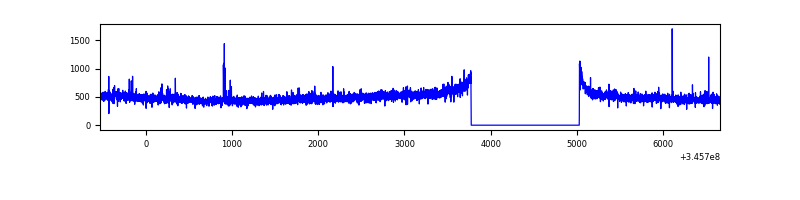 |
| D | 7189 | 5935 | 228 | 228 | 3.17% | 3.84% | 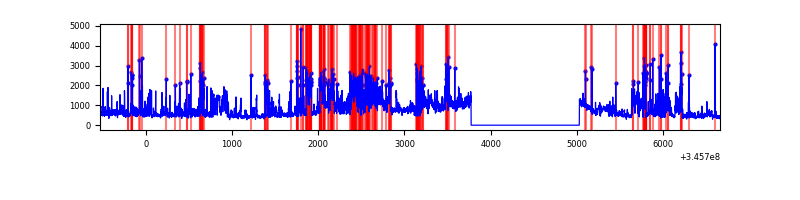 |
Top three noisy pixels from each quadrant. If the there are fewer than three noisy pixels in the level2.evt file, extra rows are filled as -1
| Pixel properties | Quadrant properties | ||||||
|---|---|---|---|---|---|---|---|
| Quadrant | DetID | PixID | Counts | Sigma | Mean | Median | Sigma |
| A | 4 | 2 | 37657 | 246.35 | 746 | 733 | 149.9 |
| A | 12 | 96 | 18717 | 119.98 | 746 | 733 | 149.9 |
| A | 6 | 16 | 14320 | 90.65 | 746 | 733 | 149.9 |
| B | 4 | 200 | 18790 | 129.31 | 745 | 728 | 139.7 |
| B | 0 | 230 | 17805 | 122.26 | 745 | 728 | 139.7 |
| B | 12 | 111 | 17348 | 118.98 | 745 | 728 | 139.7 |
| C | 14 | 238 | 116182 | 701.2 | 708 | 712 | 164.7 |
| C | 3 | 233 | 38353 | 228.58 | 708 | 712 | 164.7 |
| C | 13 | 61 | 4910 | 25.49 | 708 | 712 | 164.7 |
| D | 1 | 52 | 2136552 | 12957.61 | 691 | 672 | 164.8 |
| D | 5 | 222 | 228840 | 1384.21 | 691 | 672 | 164.8 |
| D | 8 | 195 | 127614 | 770.11 | 691 | 672 | 164.8 |
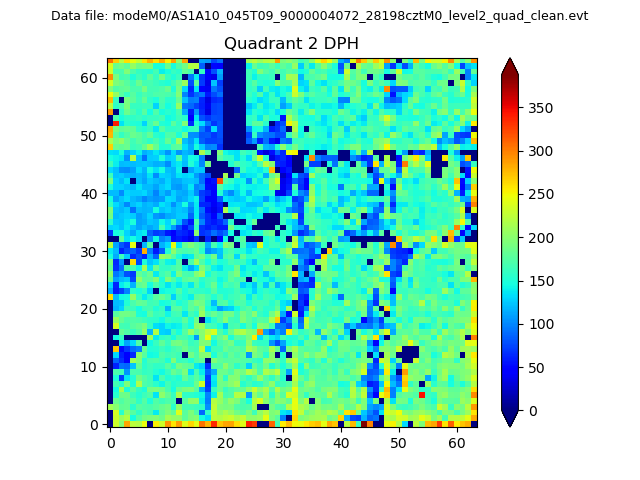
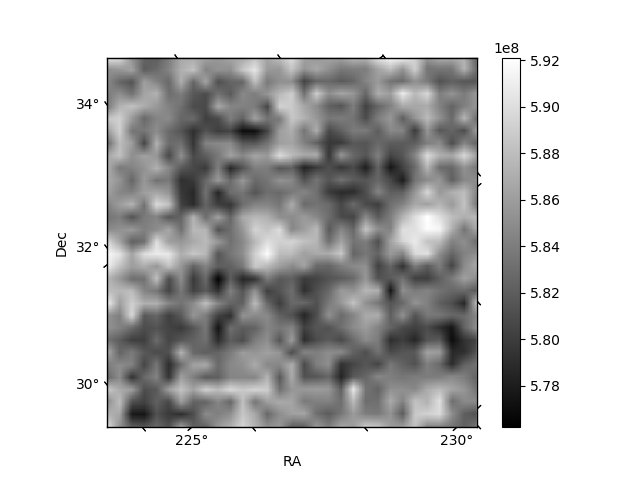
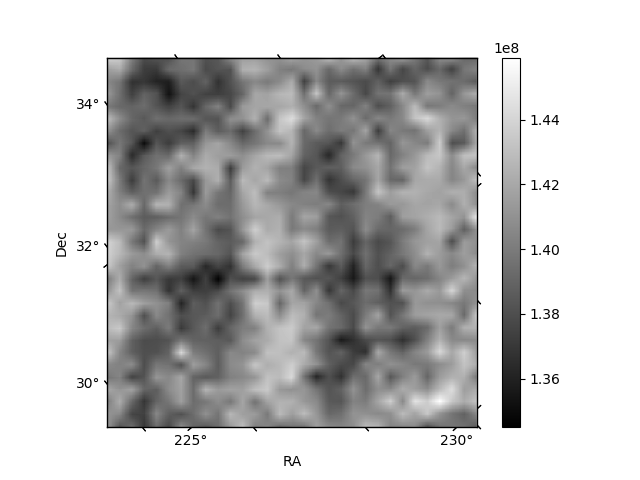
Histogram calculated using DETX and DETY for each event in the final _common_clean file
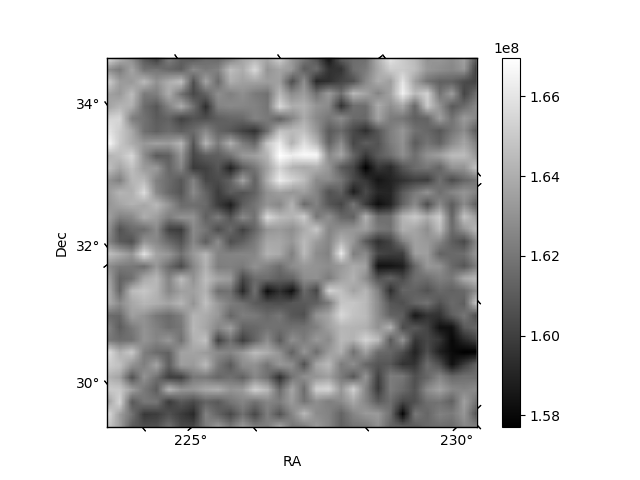
| Quadrant A | 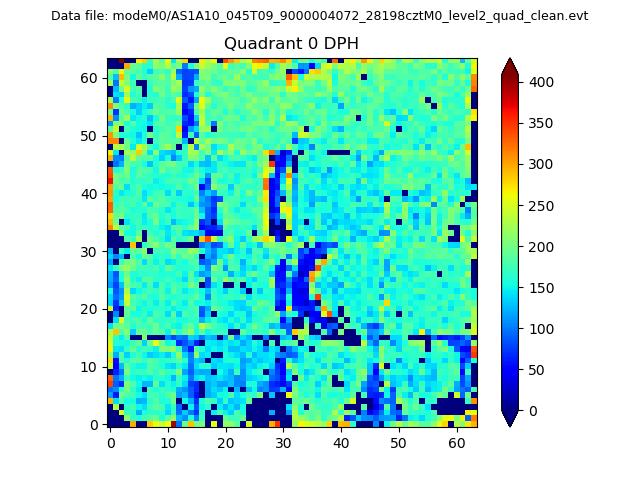 |
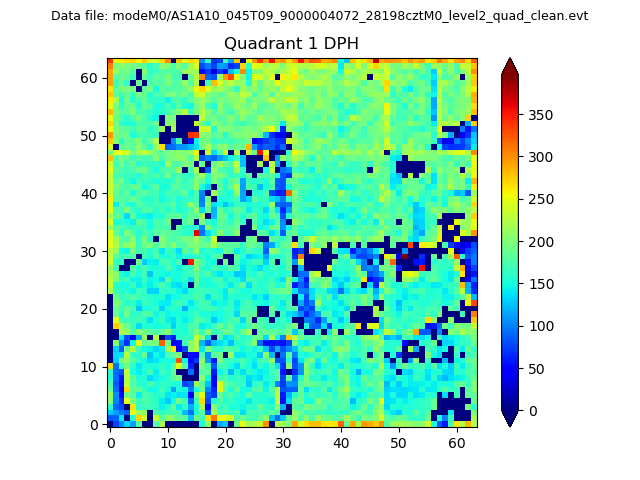 |
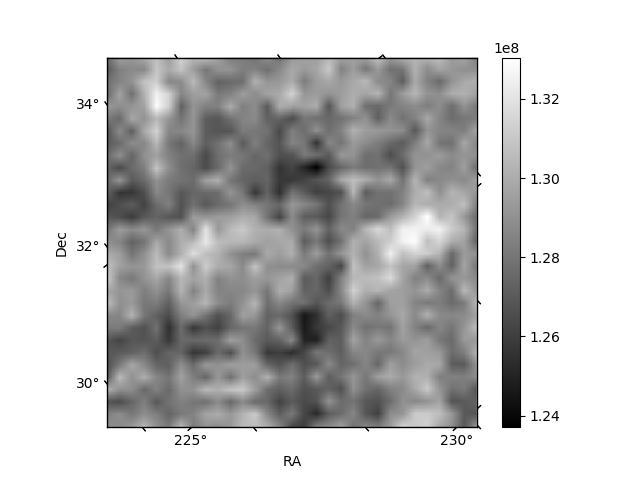
Quadrant B |
|---|---|---|---|
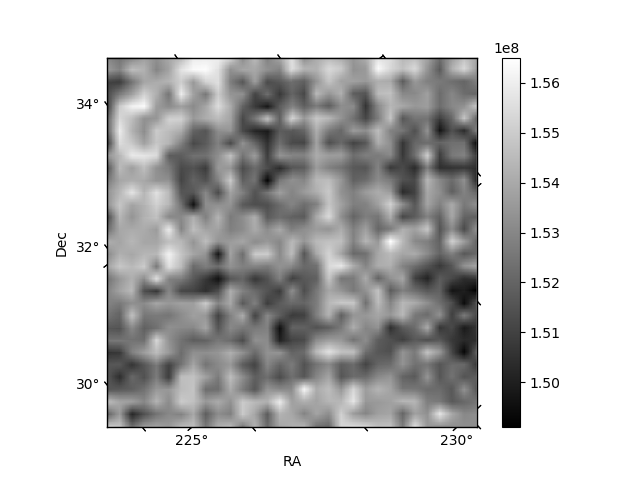
| Quadrant D | 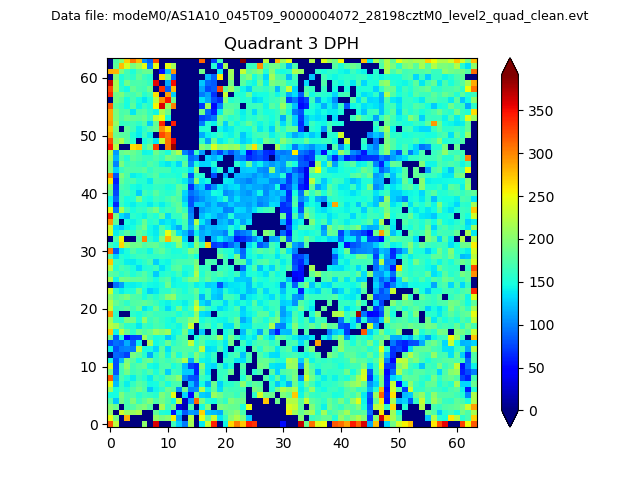 |
 |
Quadrant C |
| Plot type | Count rate plots | Images |
|---|---|---|
| Comparison with Poisson distribution Blue bars denote a histogram of data divided into 1 sec bins. Red curve is a Poisson curve with rate = median count rate of data. |
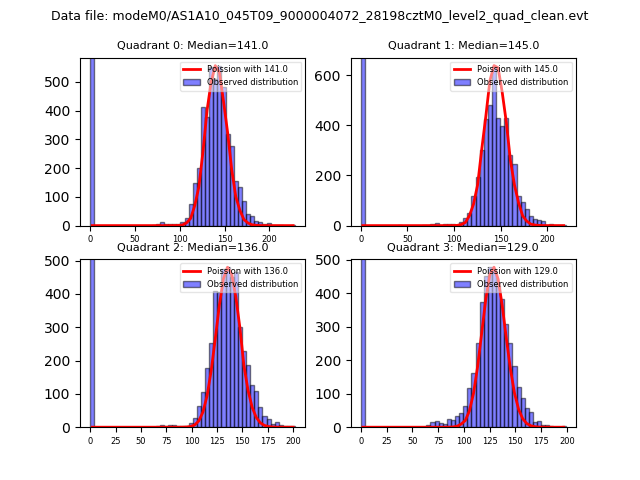 |
 |
| Quadrant-wise count rates Data is divided into 100 sec bins |
 |
|
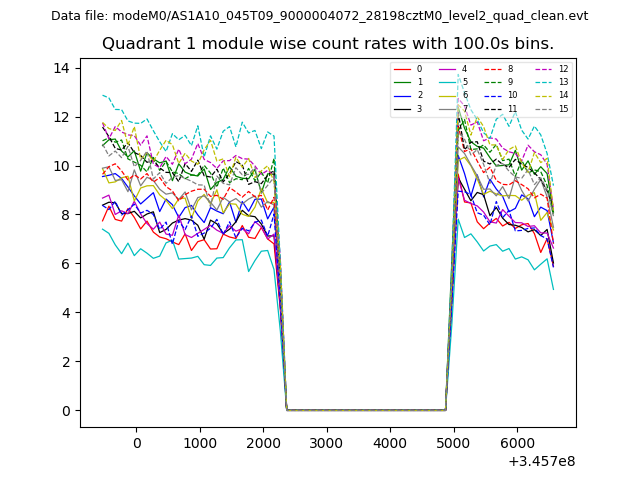
| Module-wise count rates for Quadrant A Data is divided into 100 sec bins |
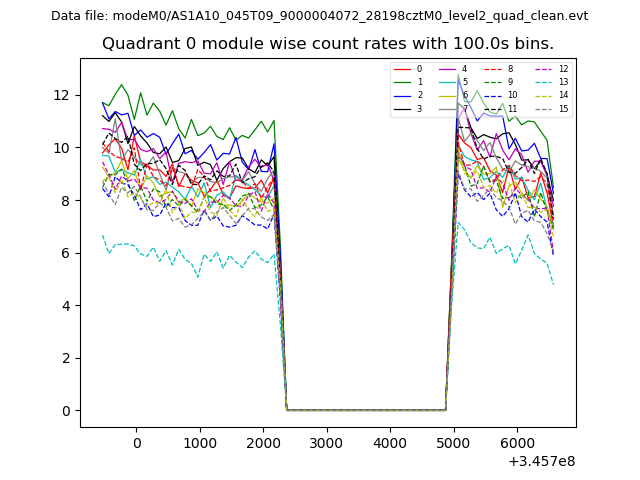 |
 |
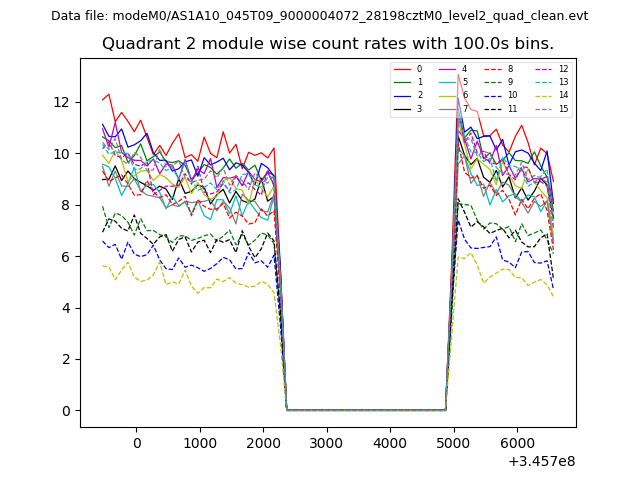
| Module-wise count rates for Quadrant B Data is divided into 100 sec bins |
 |
 |
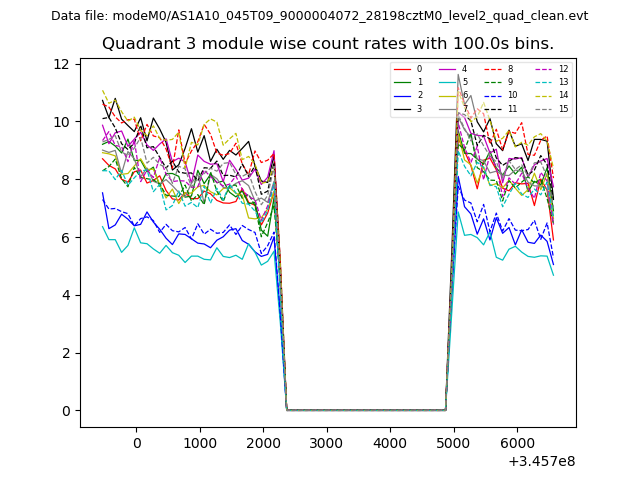
| Module-wise count rates for Quadrant C Data is divided into 100 sec bins |
 |
 |
| Module-wise count rates for Quadrant D Data is divided into 100 sec bins |
 |
 |
| Parameter | Plot |
|---|---|
| CZT HV Monitor | 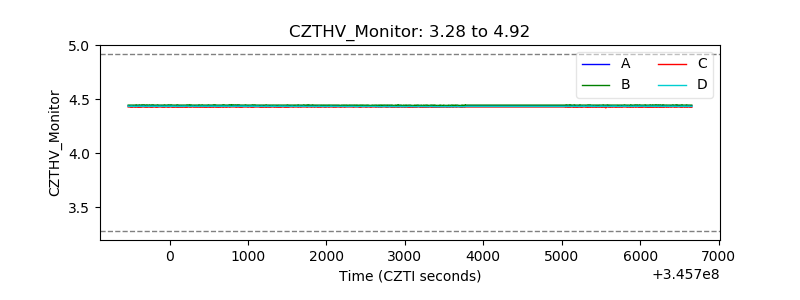 |
| D_VDD | 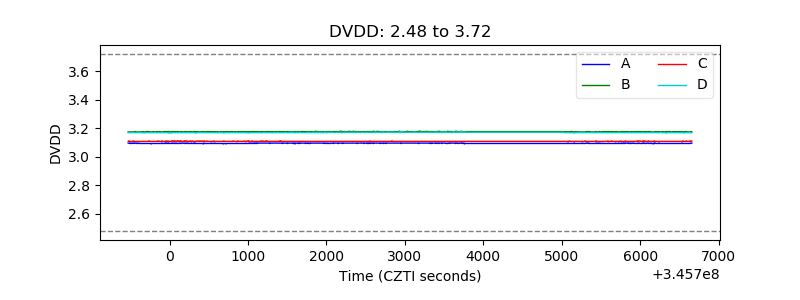 |
| Temperature 1 | 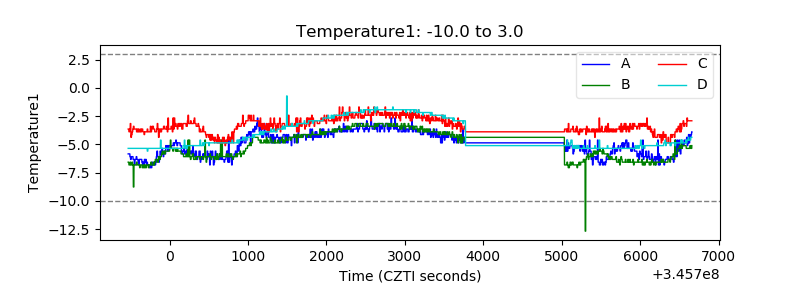 |
| Veto HV Monitor | 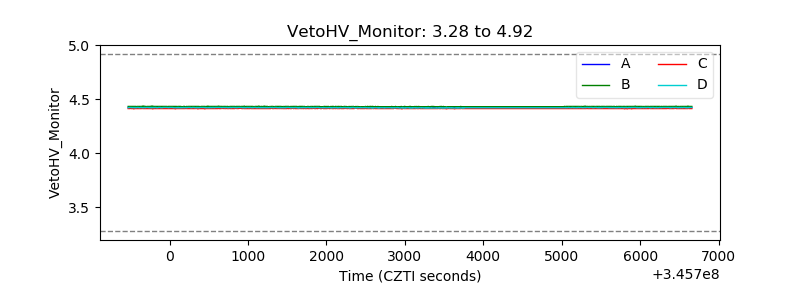 |
| Veto LLD | 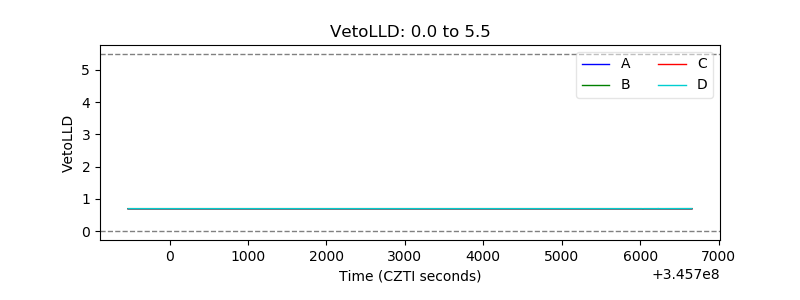 |
| Alpha Counter | 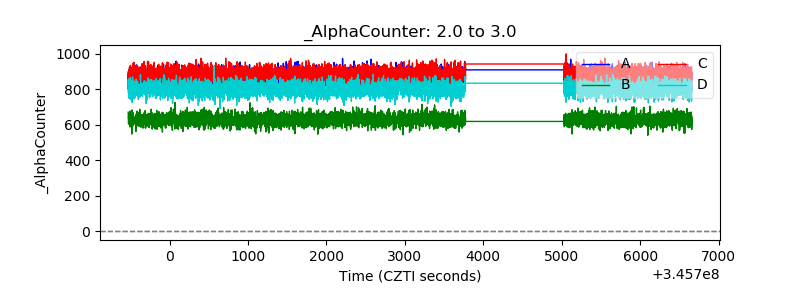 |
| _CPM_Rate | 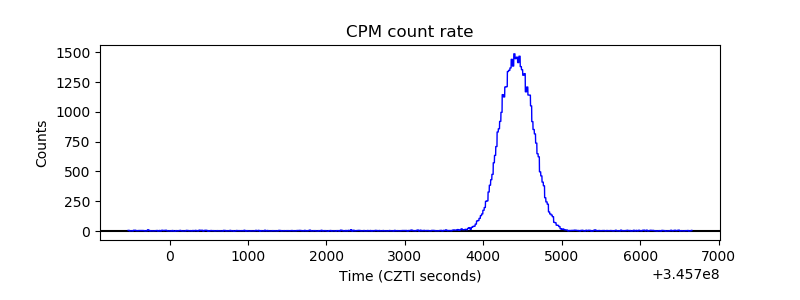 |
| CZT Counter | 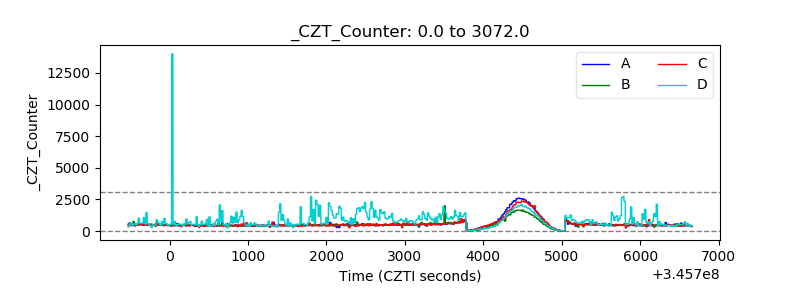 |
| +2.5 Volts monitor |  |
| +5 Volts monitor |  |
| _ROLL_ROT | 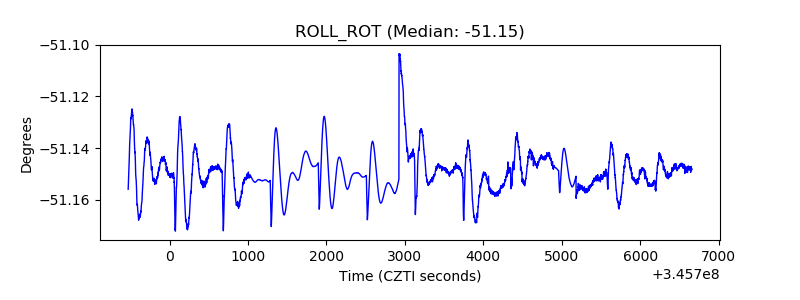 |
| _Roll_DEC | 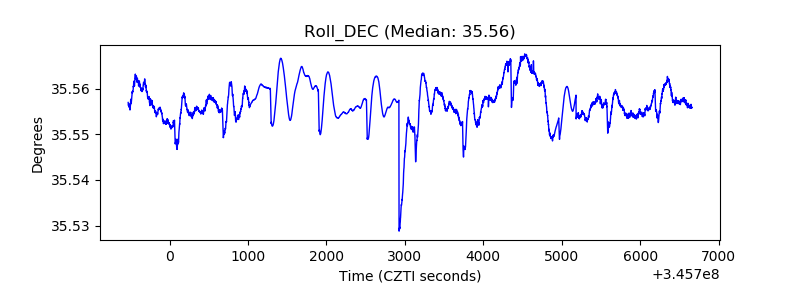 |
| _Roll_RA |  |
| Veto Counter | 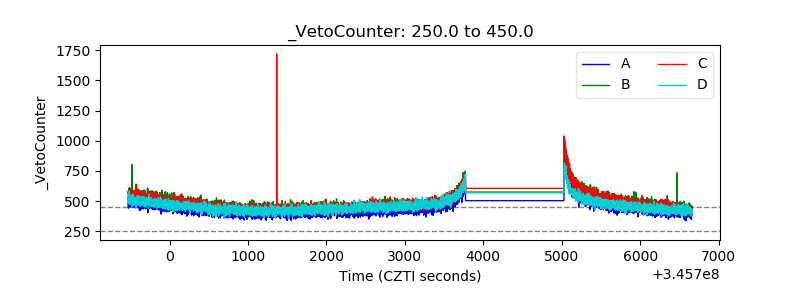 |