| Param | Original file | Final file |
|---|---|---|
| Filename | modeM0/AS1A10_045T09_9000004072_28199cztM0_level2.evt | modeM0/AS1A10_045T09_9000004072_28199cztM0_level2_quad_clean.evt |
| Size (bytes) | 474,595,200 | 89,038,080 |
| Size | 452.6 MB | 84.9 MB |
| Events in quadrant A | 3,028,959 | 574,962 |
| Events in quadrant B | 3,071,799 | 592,203 |
| Events in quadrant C | 3,079,302 | 555,099 |
| Events in quadrant D | 4,763,953 | 532,941 |
| Mode M0 | |||
|---|---|---|---|
| Quadrant | BADHDUFLAG | Total packets | Discarded packets |
| A | 0 | 13021 | 0 |
| B | 0 | 13102 | 0 |
| C | 0 | 13181 | 0 |
| D | 0 | 18413 | 0 |
| Mode M9 | |||
|---|---|---|---|
| Quadrant | BADHDUFLAG | Total packets | Discarded packets |
| A | 0 | 10 | 0 |
| B | 0 | 10 | 0 |
| C | 0 | 10 | 0 |
| D | 0 | 10 | 0 |
| Quadrant | Total seconds | Saturated seconds | Saturation percentage |
|---|---|---|---|
| A | 6316 | 23 | 0.364155% |
| B | 6316 | 44 | 0.696643% |
| C | 6316 | 61 | 0.965801% |
| D | 6316 | 276 | 4.369854% |
Noise dominated data is calculated using 1-second bins in cleaned event files. If a bin has >2000 counts, and if more than 50% of those come from <1% of pixels, then it is considered to be noise-dominated and hence unusable.
| Quadrant | # 1 sec bins | Bins with >0 counts | Bins with >2000 counts | High rate bins dominated by noise | Noise dominated (total time) | Noise dominated (detector-on time) | Marked lightcurve |
|---|---|---|---|---|---|---|---|
| A | 7386 | 6317 | 0 | 0 | 0.00% | 0.00% | 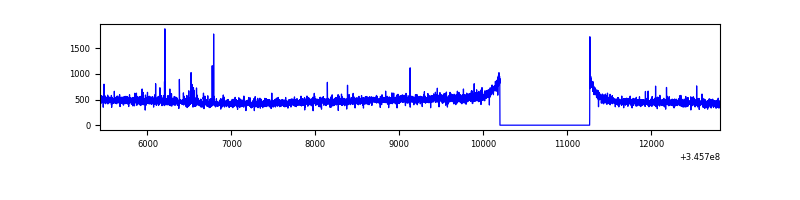 |
| B | 7386 | 6317 | 1 | 1 | 0.01% | 0.02% | 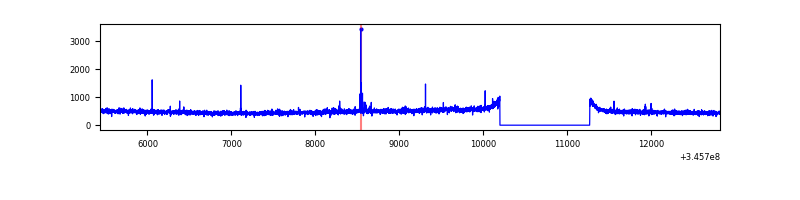 |
| C | 7386 | 6317 | 1 | 1 | 0.01% | 0.02% | 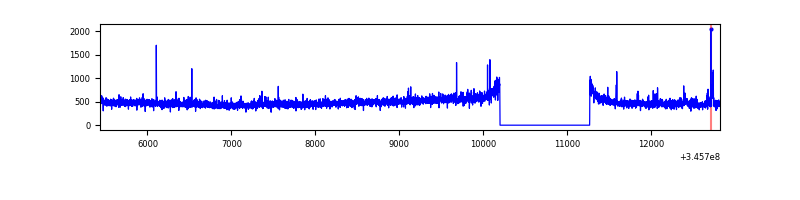 |
| D | 7386 | 6317 | 219 | 219 | 2.97% | 3.47% | 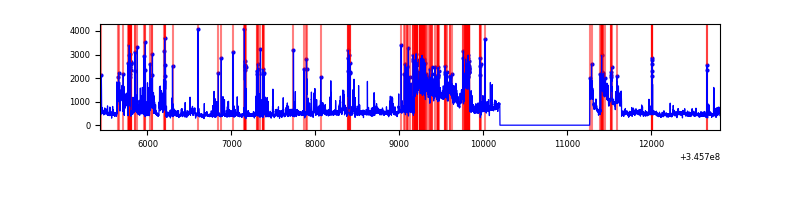 |
Top three noisy pixels from each quadrant. If the there are fewer than three noisy pixels in the level2.evt file, extra rows are filled as -1
| Pixel properties | Quadrant properties | ||||||
|---|---|---|---|---|---|---|---|
| Quadrant | DetID | PixID | Counts | Sigma | Mean | Median | Sigma |
| A | 12 | 96 | 21887 | 135.62 | 776 | 759 | 155.8 |
| A | 6 | 16 | 11714 | 70.32 | 776 | 759 | 155.8 |
| A | 13 | 254 | 9310 | 54.89 | 776 | 759 | 155.8 |
| B | 0 | 230 | 21250 | 139.49 | 772 | 751 | 147.0 |
| B | 12 | 111 | 18347 | 119.73 | 772 | 751 | 147.0 |
| B | 11 | 111 | 16461 | 106.9 | 772 | 751 | 147.0 |
| C | 14 | 238 | 119523 | 688.53 | 737 | 742 | 172.5 |
| C | 3 | 233 | 71658 | 411.07 | 737 | 742 | 172.5 |
| C | 15 | 208 | 13462 | 73.73 | 737 | 742 | 172.5 |
| D | 1 | 52 | 1811446 | 10240.18 | 733 | 713 | 176.8 |
| D | 8 | 195 | 82969 | 465.18 | 733 | 713 | 176.8 |
| D | 5 | 222 | 75091 | 420.63 | 733 | 713 | 176.8 |
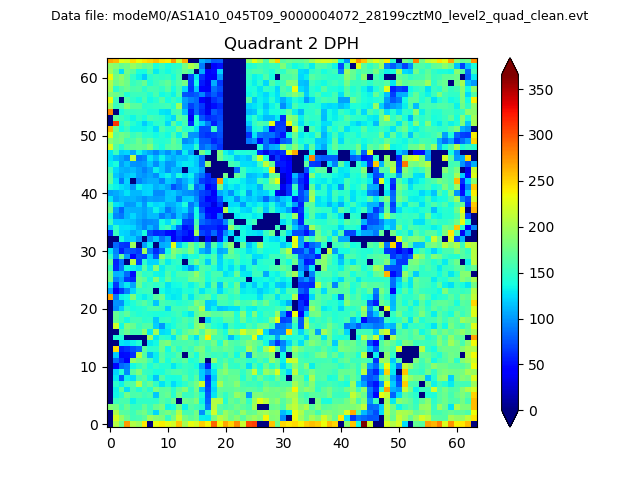
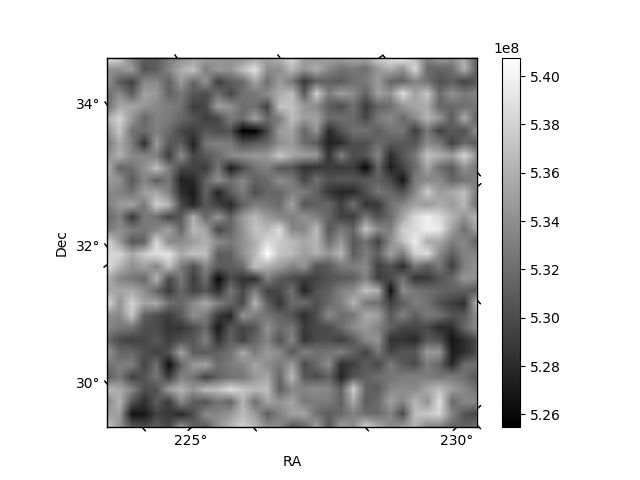
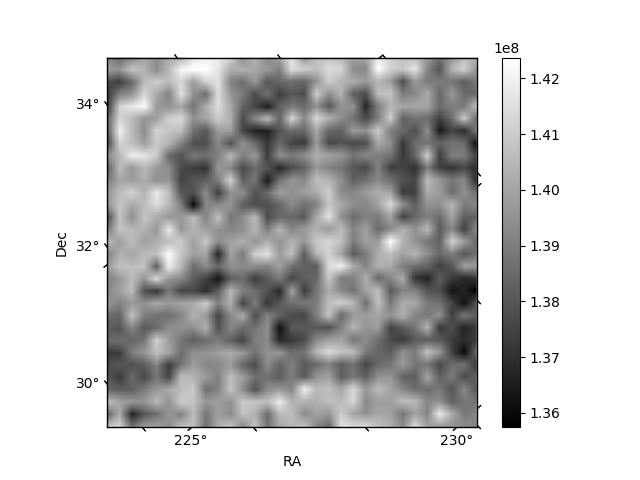
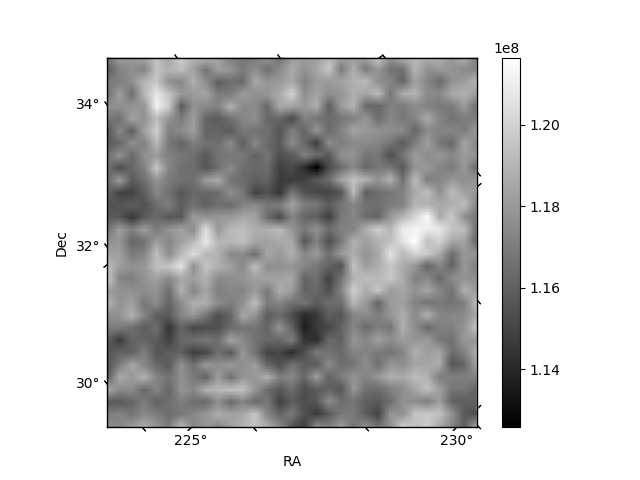
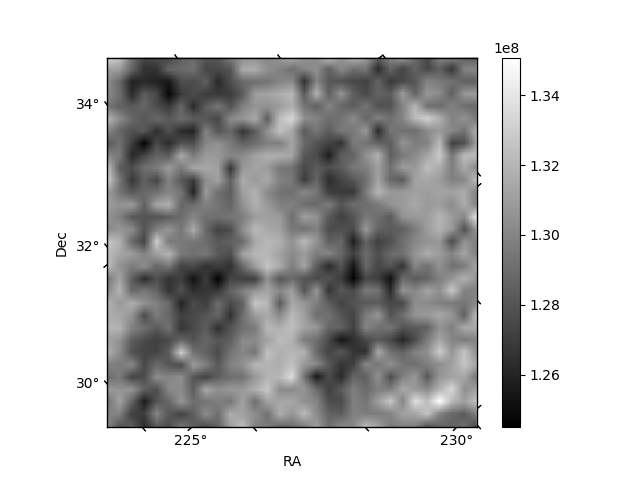
Histogram calculated using DETX and DETY for each event in the final _common_clean file
| Quadrant A | 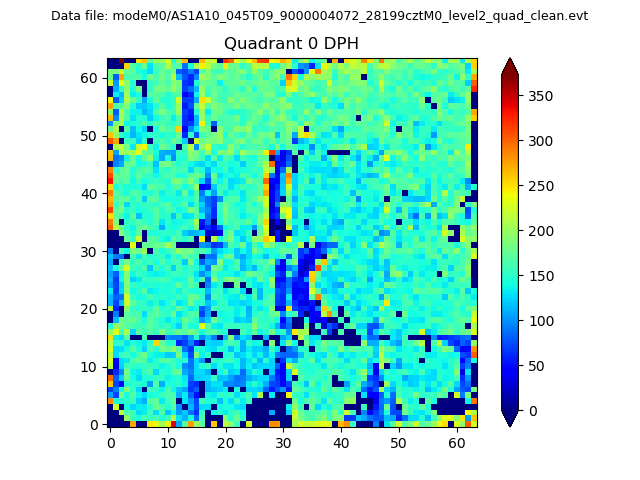 |
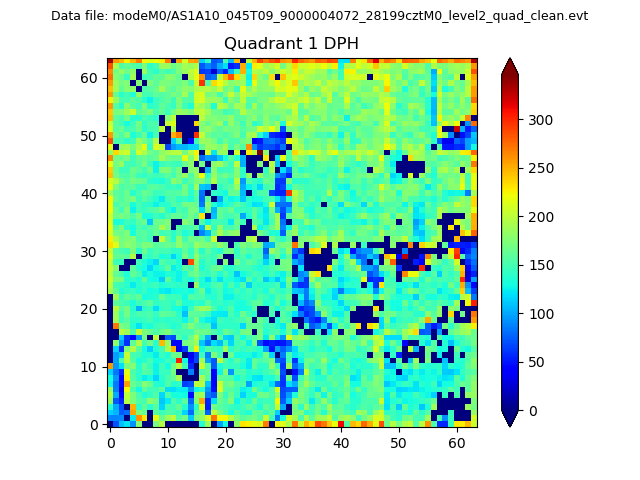 |
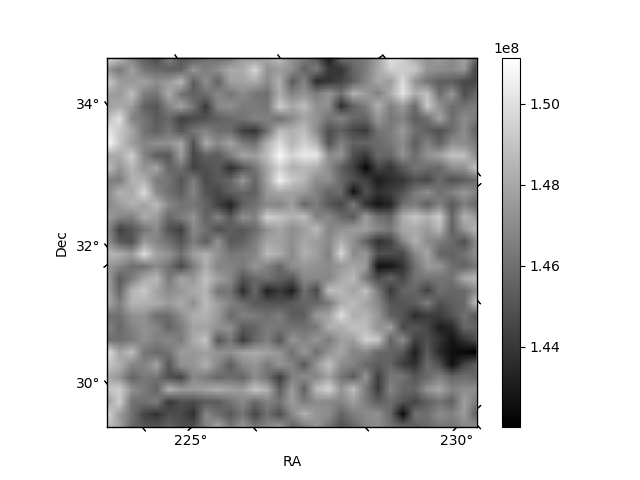
Quadrant B |
|---|---|---|---|
| Quadrant D | 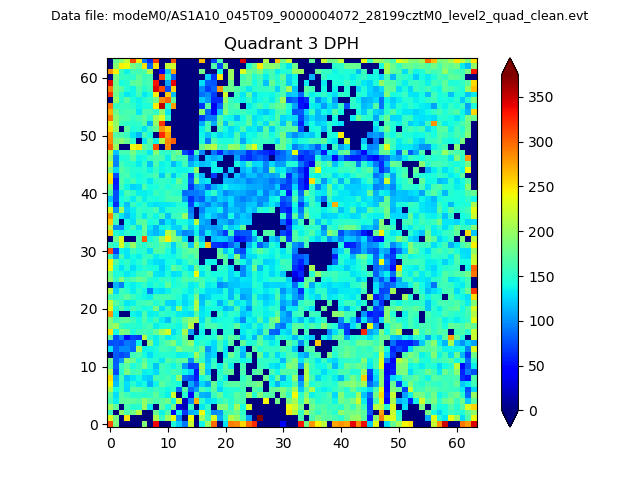 |
 |
Quadrant C |
| Plot type | Count rate plots | Images |
|---|---|---|
| Comparison with Poisson distribution Blue bars denote a histogram of data divided into 1 sec bins. Red curve is a Poisson curve with rate = median count rate of data. |
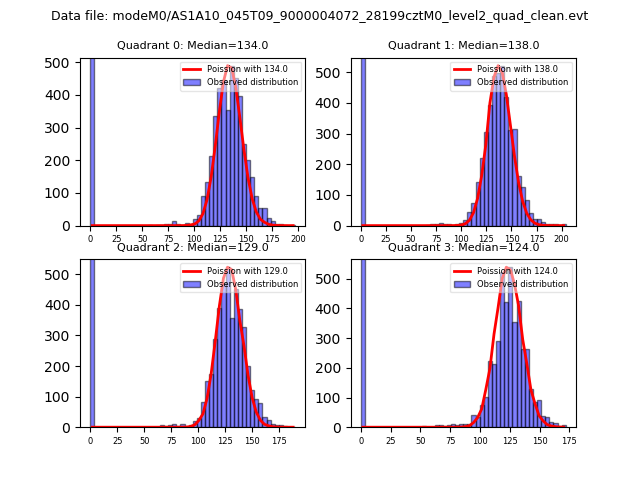 |
 |
| Quadrant-wise count rates Data is divided into 100 sec bins |
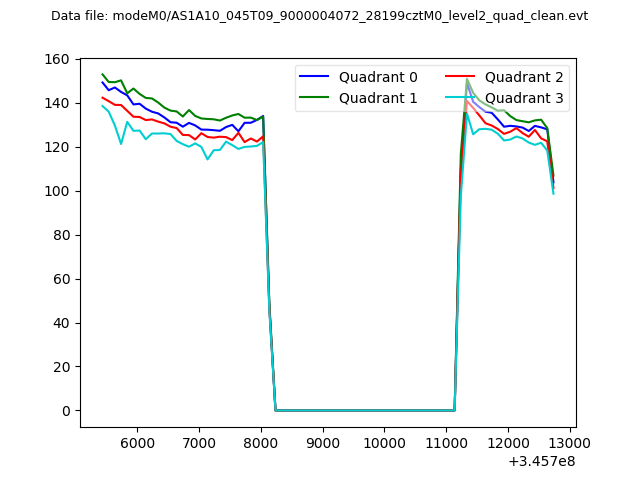 |
|
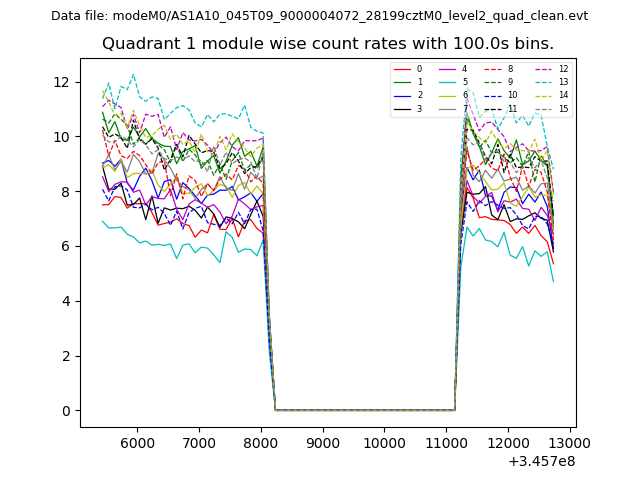
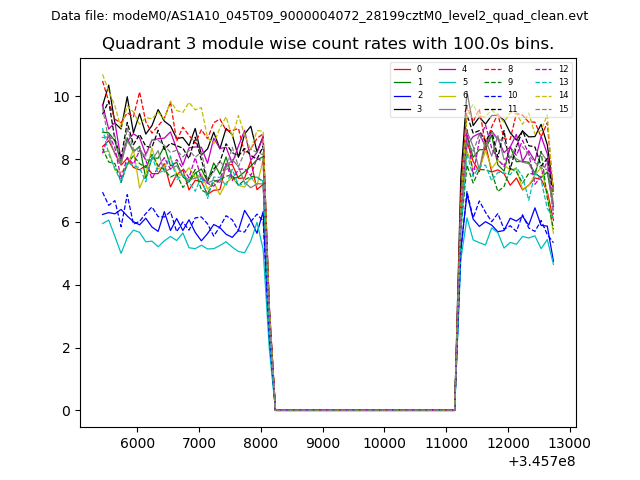
| Module-wise count rates for Quadrant A Data is divided into 100 sec bins |
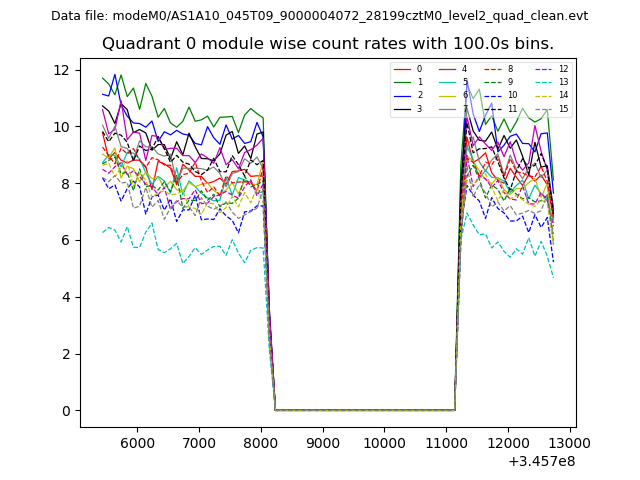 |
 |
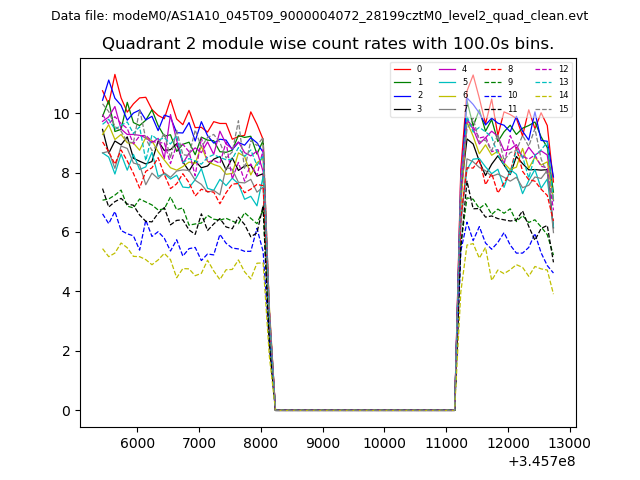
| Module-wise count rates for Quadrant B Data is divided into 100 sec bins |
 |
 |
| Module-wise count rates for Quadrant C Data is divided into 100 sec bins |
 |
 |
| Module-wise count rates for Quadrant D Data is divided into 100 sec bins |
 |
 |
| Parameter | Plot |
|---|---|
| CZT HV Monitor | 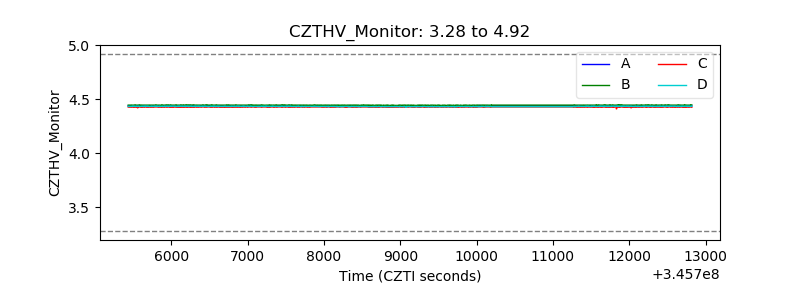 |
| D_VDD | 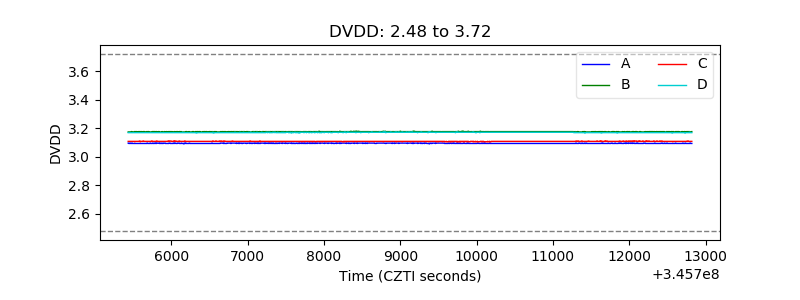 |
| Temperature 1 | 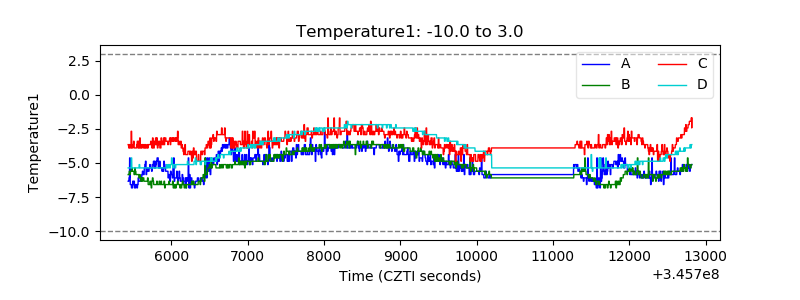 |
| Veto HV Monitor | 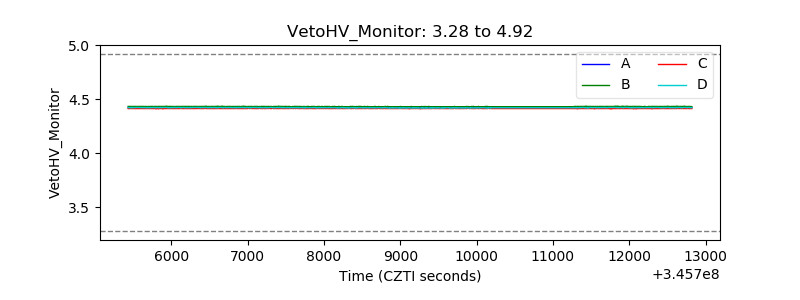 |
| Veto LLD | 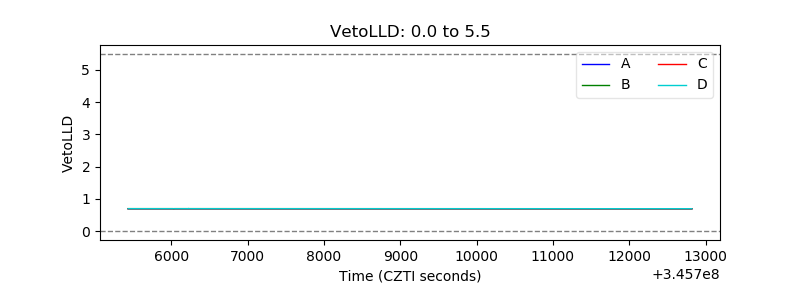 |
| Alpha Counter | 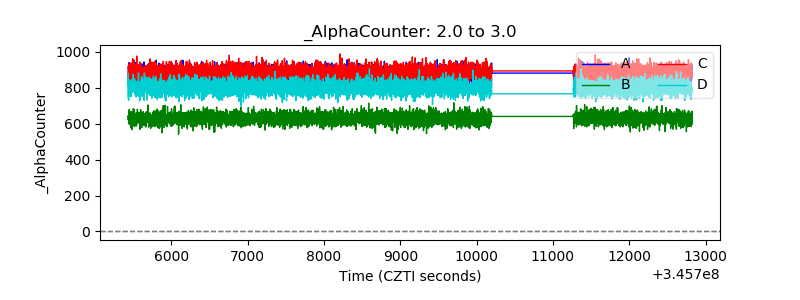 |
| _CPM_Rate | 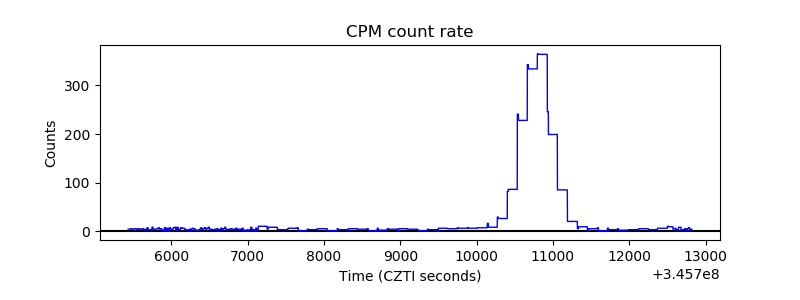 |
| CZT Counter | 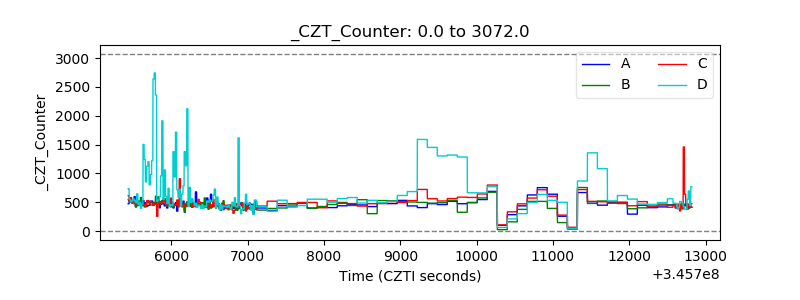 |
| +2.5 Volts monitor |  |
| +5 Volts monitor |  |
| _ROLL_ROT | 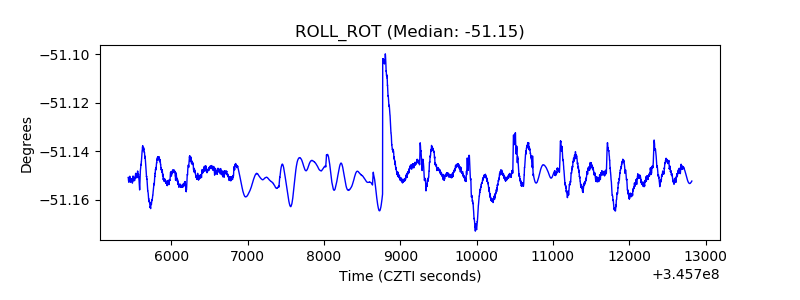 |
| _Roll_DEC | 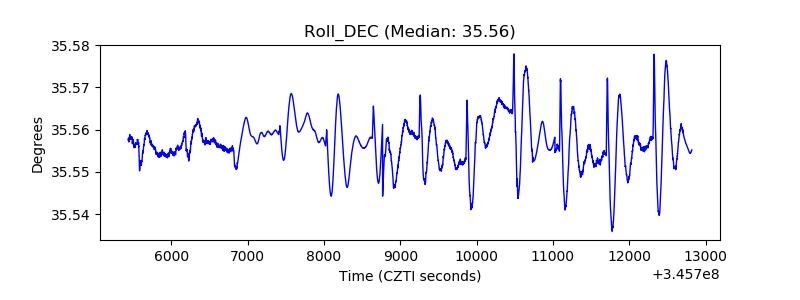 |
| _Roll_RA | 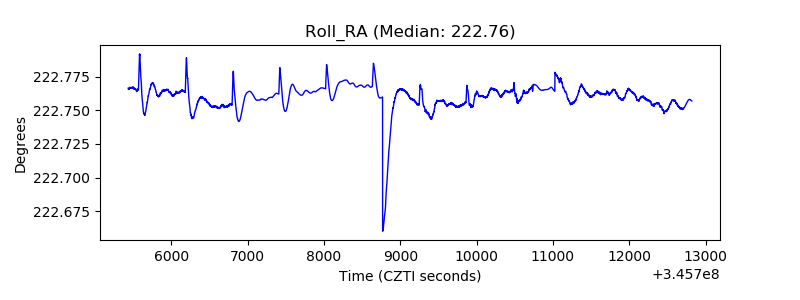 |
| Veto Counter | 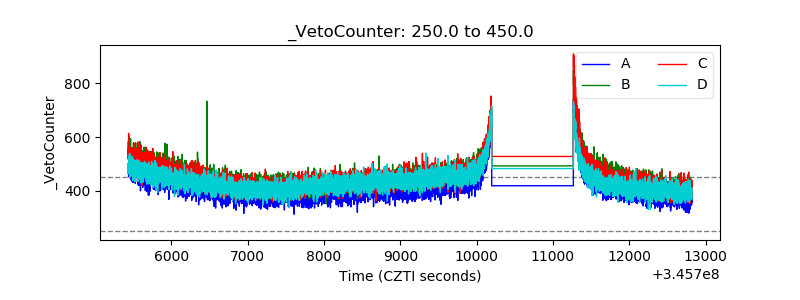 |