| Param | Original file | Final file |
|---|---|---|
| Filename | modeM0/AS1A10_045T09_9000004072_28200cztM0_level2.evt | modeM0/AS1A10_045T09_9000004072_28200cztM0_level2_quad_clean.evt |
| Size (bytes) | 491,195,520 | 83,943,360 |
| Size | 468.4 MB | 80.1 MB |
| Events in quadrant A | 3,000,264 | 535,758 |
| Events in quadrant B | 3,034,591 | 548,285 |
| Events in quadrant C | 3,376,014 | 516,413 |
| Events in quadrant D | 5,033,302 | 497,973 |
| Mode M0 | |||
|---|---|---|---|
| Quadrant | BADHDUFLAG | Total packets | Discarded packets |
| A | 0 | 13097 | 0 |
| B | 0 | 13166 | 0 |
| C | 0 | 14025 | 0 |
| D | 0 | 19355 | 0 |
| Mode M9 | |||
|---|---|---|---|
| Quadrant | BADHDUFLAG | Total packets | Discarded packets |
| A | 0 | 6 | 0 |
| B | 0 | 6 | 0 |
| C | 0 | 6 | 0 |
| D | 0 | 6 | 0 |
| Quadrant | Total seconds | Saturated seconds | Saturation percentage |
|---|---|---|---|
| A | 6353 | 75 | 1.180545% |
| B | 6353 | 102 | 1.605541% |
| C | 6354 | 160 | 2.518099% |
| D | 6354 | 349 | 5.492603% |
Noise dominated data is calculated using 1-second bins in cleaned event files. If a bin has >2000 counts, and if more than 50% of those come from <1% of pixels, then it is considered to be noise-dominated and hence unusable.
| Quadrant | # 1 sec bins | Bins with >0 counts | Bins with >2000 counts | High rate bins dominated by noise | Noise dominated (total time) | Noise dominated (detector-on time) | Marked lightcurve |
|---|---|---|---|---|---|---|---|
| A | 7003 | 6354 | 0 | 0 | 0.00% | 0.00% | 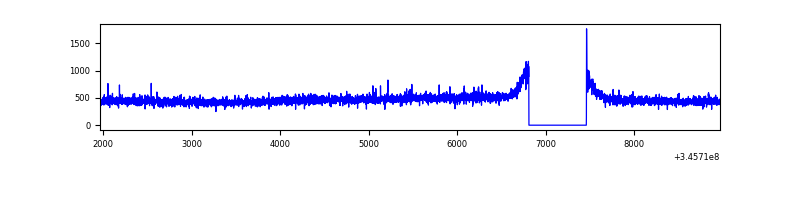 |
| B | 7003 | 6353 | 2 | 2 | 0.03% | 0.03% | 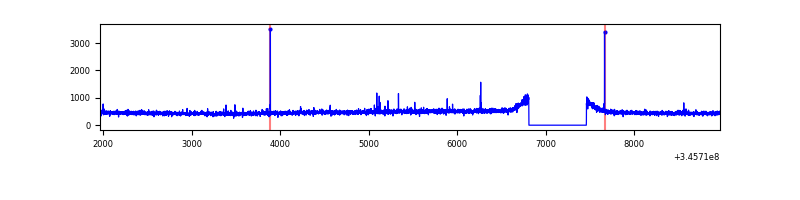 |
| C | 7004 | 6355 | 35 | 35 | 0.50% | 0.55% | 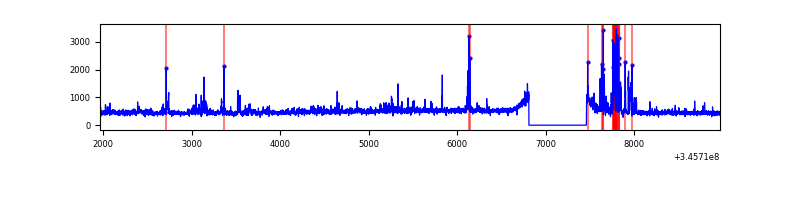 |
| D | 7004 | 6355 | 294 | 294 | 4.20% | 4.63% | 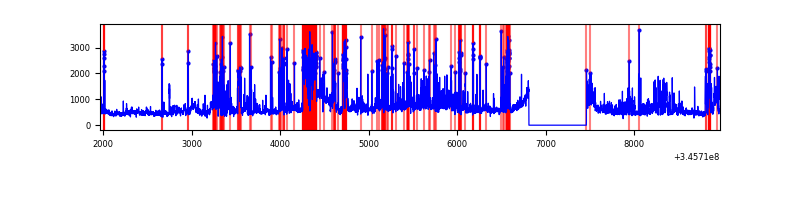 |
Top three noisy pixels from each quadrant. If the there are fewer than three noisy pixels in the level2.evt file, extra rows are filled as -1
| Pixel properties | Quadrant properties | ||||||
|---|---|---|---|---|---|---|---|
| Quadrant | DetID | PixID | Counts | Sigma | Mean | Median | Sigma |
| A | 13 | 254 | 8761 | 50.8 | 773 | 757 | 157.6 |
| A | 3 | 137 | 7591 | 43.37 | 773 | 757 | 157.6 |
| A | 6 | 16 | 6663 | 37.48 | 773 | 757 | 157.6 |
| B | 12 | 111 | 18725 | 120.36 | 766 | 747 | 149.4 |
| B | 11 | 111 | 17229 | 110.35 | 766 | 747 | 149.4 |
| B | 14 | 111 | 16281 | 104.0 | 766 | 747 | 149.4 |
| C | 15 | 208 | 207622 | 1187.86 | 735 | 740 | 174.2 |
| C | 3 | 233 | 158171 | 903.93 | 735 | 740 | 174.2 |
| C | 14 | 238 | 118313 | 675.07 | 735 | 740 | 174.2 |
| D | 1 | 52 | 1883490 | 10722.06 | 733 | 714 | 175.6 |
| D | 8 | 195 | 204423 | 1160.08 | 733 | 714 | 175.6 |
| D | 5 | 222 | 94587 | 534.59 | 733 | 714 | 175.6 |
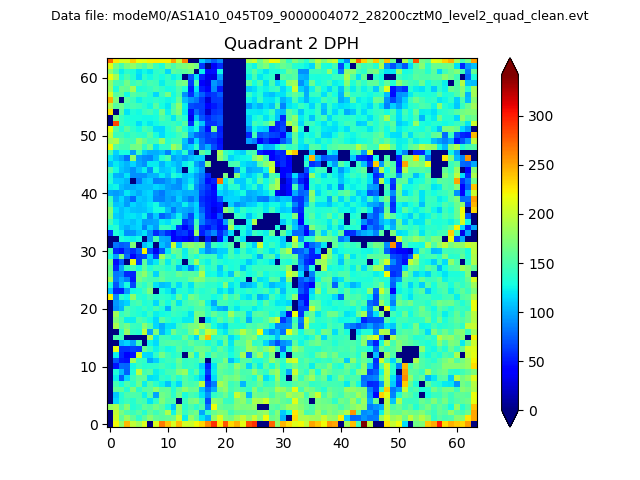
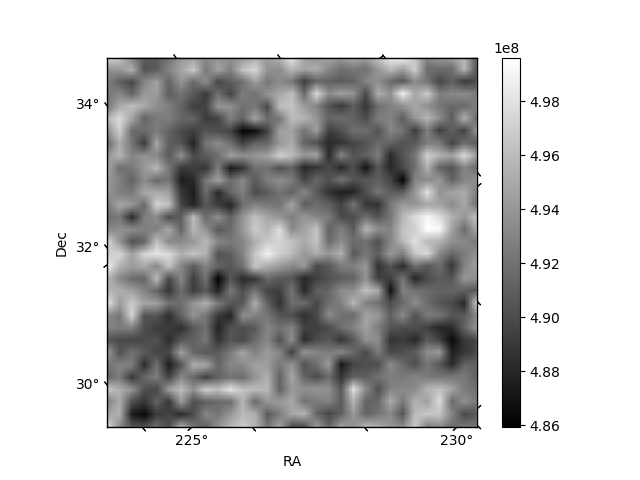
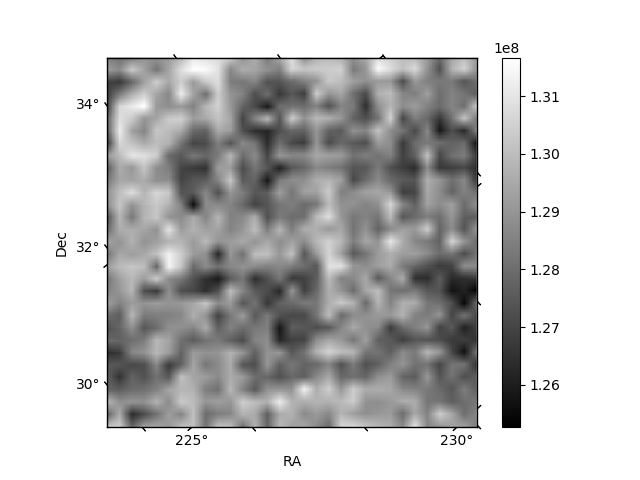
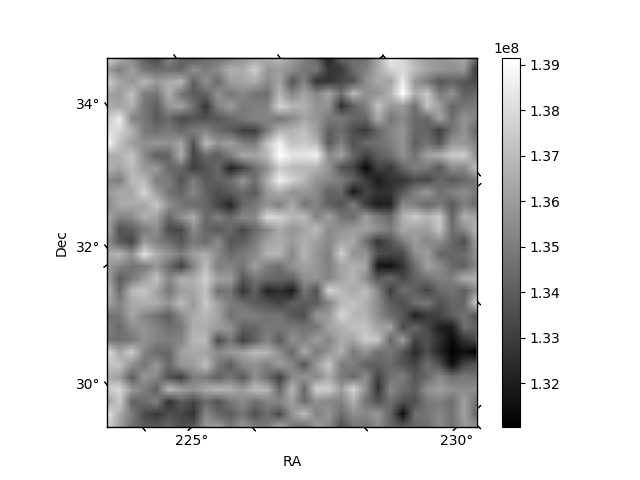
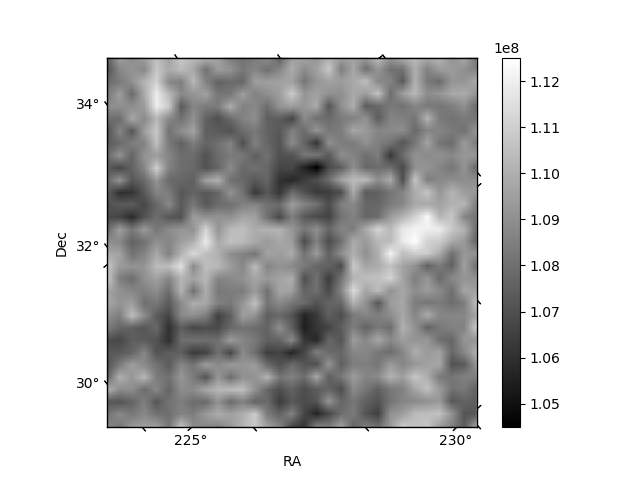
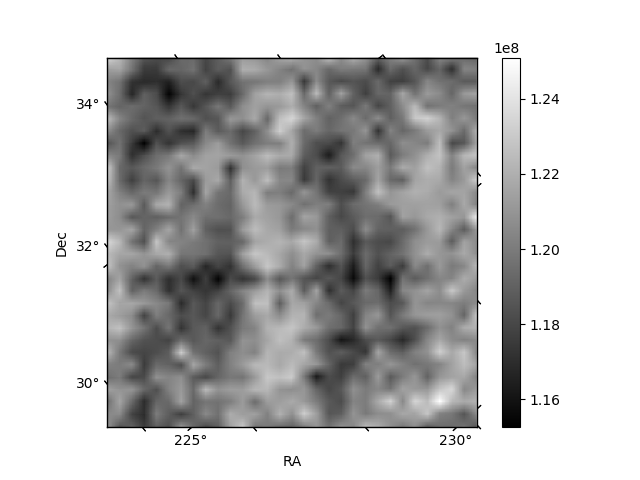
Histogram calculated using DETX and DETY for each event in the final _common_clean file
| Quadrant A | 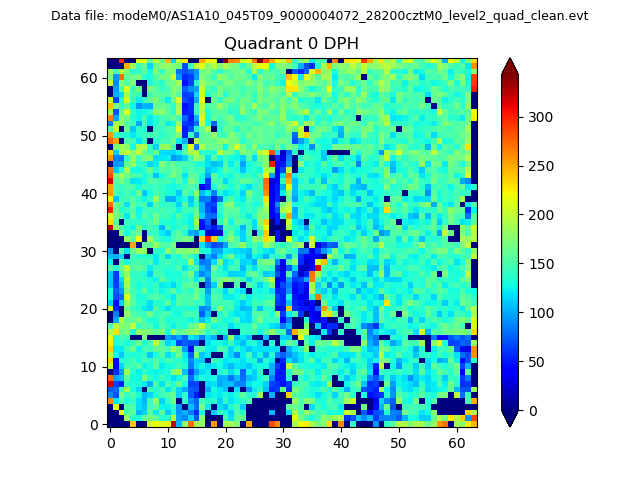 |
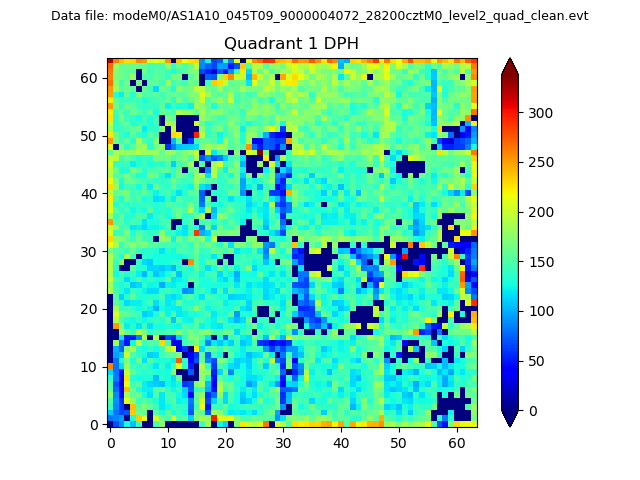 |
Quadrant B |
|---|---|---|---|
| Quadrant D | 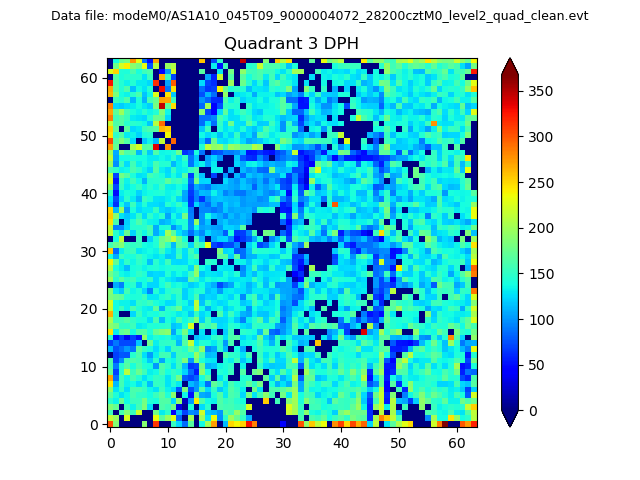 |
 |
Quadrant C |
| Plot type | Count rate plots | Images |
|---|---|---|
| Comparison with Poisson distribution Blue bars denote a histogram of data divided into 1 sec bins. Red curve is a Poisson curve with rate = median count rate of data. |
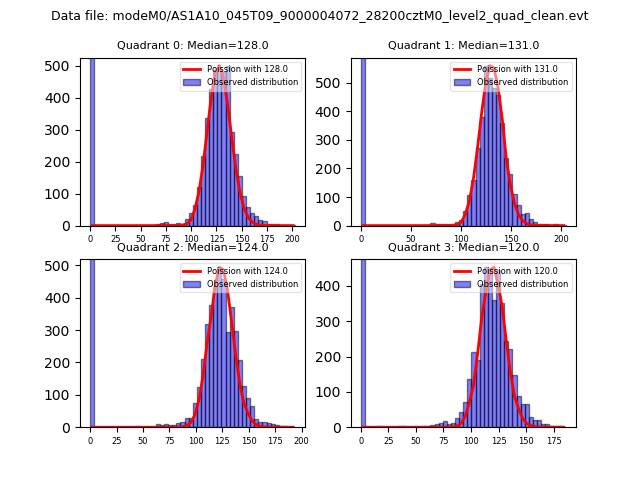 |
 |
| Quadrant-wise count rates Data is divided into 100 sec bins |
 |
|
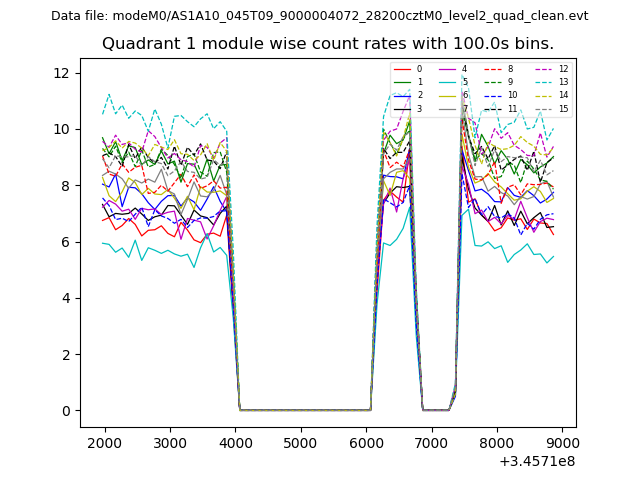
| Module-wise count rates for Quadrant A Data is divided into 100 sec bins |
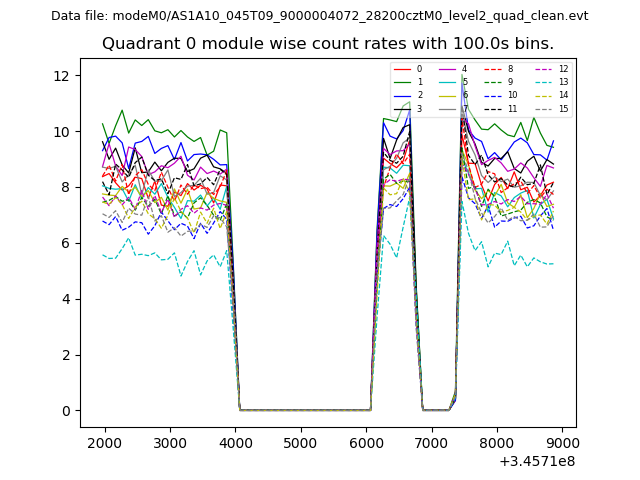 |
 |
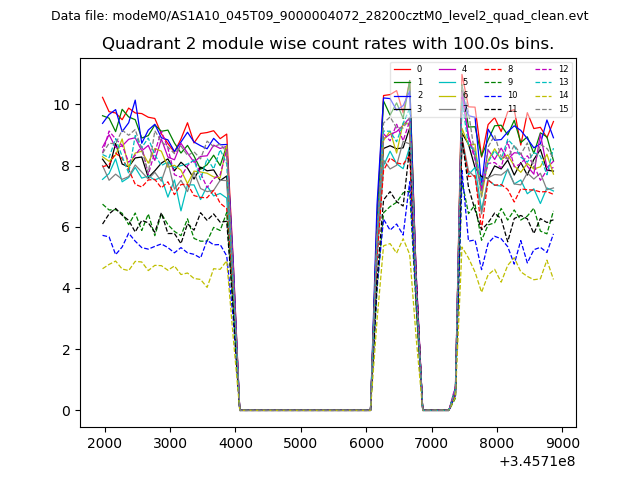
| Module-wise count rates for Quadrant B Data is divided into 100 sec bins |
 |
 |
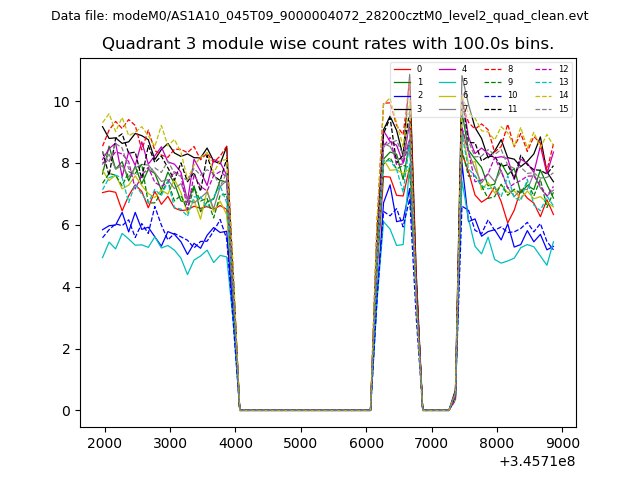
| Module-wise count rates for Quadrant C Data is divided into 100 sec bins |
 |
 |
| Module-wise count rates for Quadrant D Data is divided into 100 sec bins |
 |
 |
| Parameter | Plot |
|---|---|
| CZT HV Monitor | 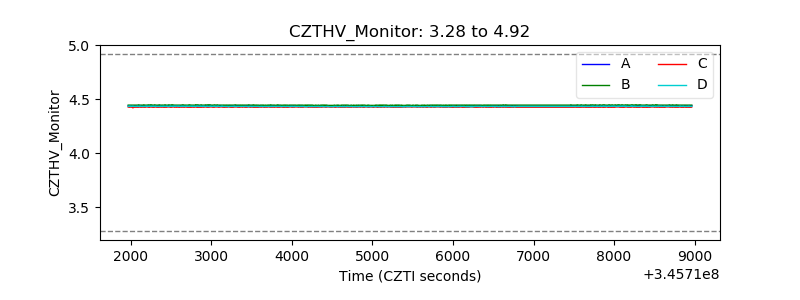 |
| D_VDD | 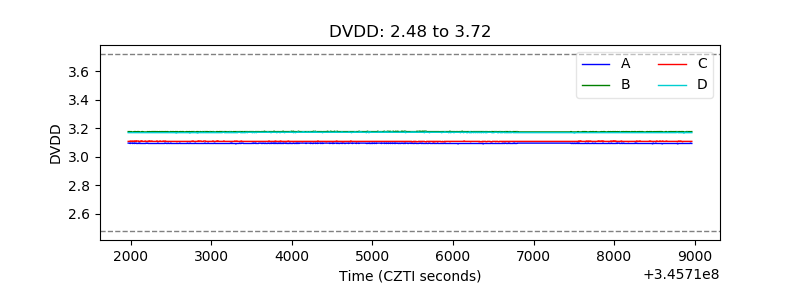 |
| Temperature 1 | 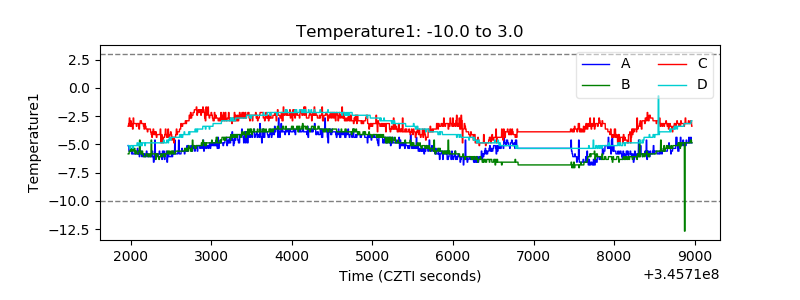 |
| Veto HV Monitor |  |
| Veto LLD | 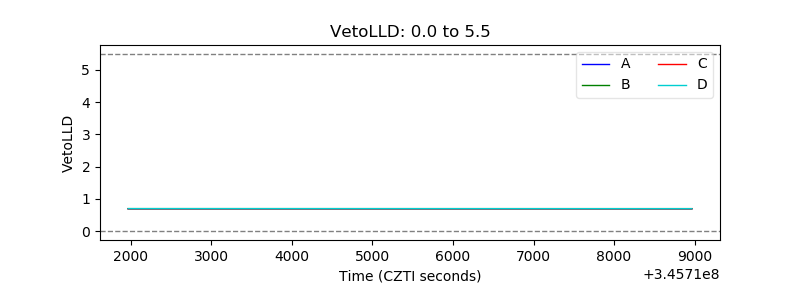 |
| Alpha Counter |  |
| _CPM_Rate | 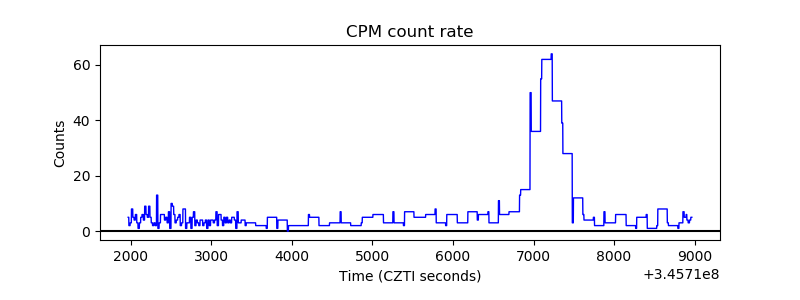 |
| CZT Counter | 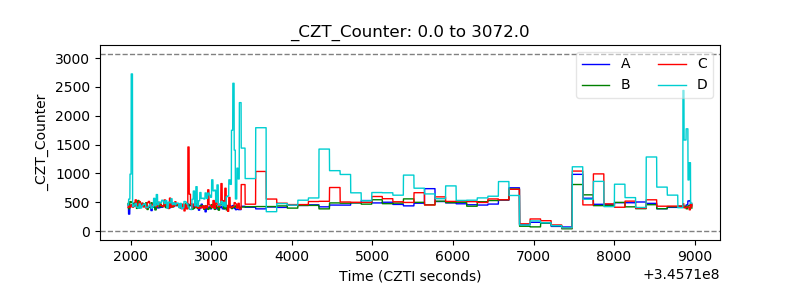 |
| +2.5 Volts monitor |  |
| +5 Volts monitor |  |
| _ROLL_ROT | 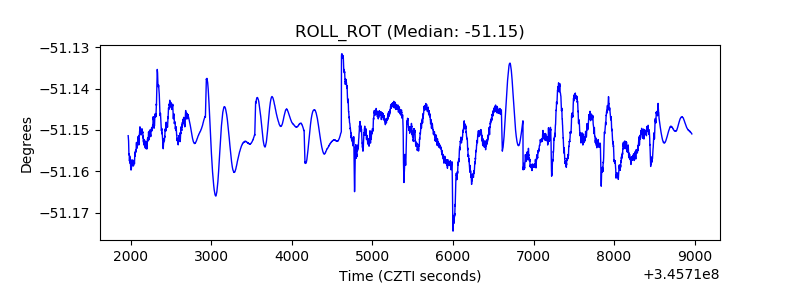 |
| _Roll_DEC | 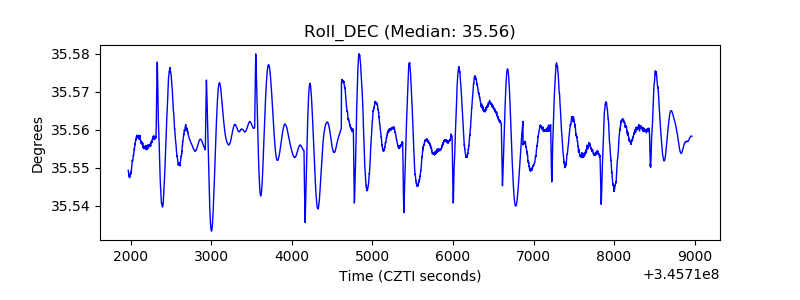 |
| _Roll_RA | 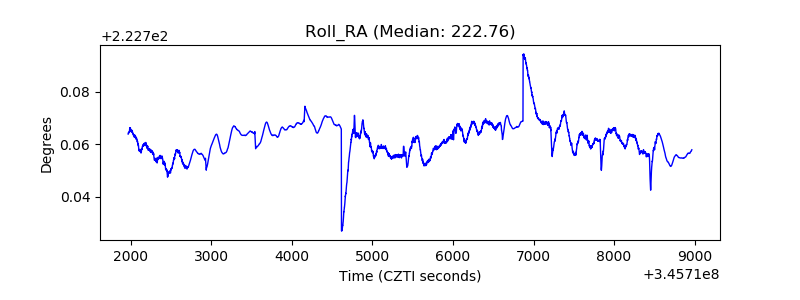 |
| Veto Counter | 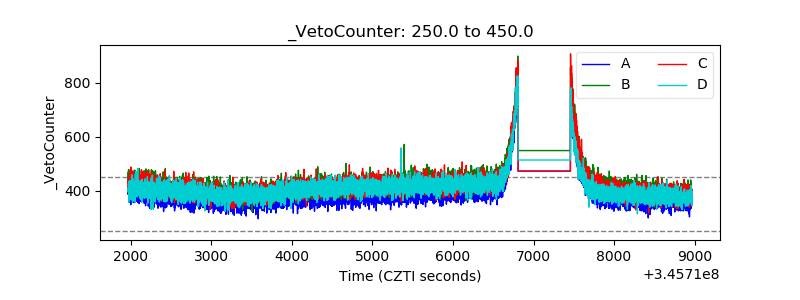 |