| Param | Original file | Final file |
|---|---|---|
| Filename | modeM0/AS1A10_045T09_9000004072_28201cztM0_level2.evt | modeM0/AS1A10_045T09_9000004072_28201cztM0_level2_quad_clean.evt |
| Size (bytes) | 589,063,680 | 103,924,800 |
| Size | 561.8 MB | 99.1 MB |
| Events in quadrant A | 3,509,992 | 670,792 |
| Events in quadrant B | 3,558,936 | 686,908 |
| Events in quadrant C | 3,799,373 | 646,299 |
| Events in quadrant D | 6,465,223 | 623,645 |
| Mode M0 | |||
|---|---|---|---|
| Quadrant | BADHDUFLAG | Total packets | Discarded packets |
| A | 0 | 15348 | 0 |
| B | 0 | 15429 | 0 |
| C | 0 | 16089 | 0 |
| D | 0 | 24228 | 0 |
| Mode M9 | |||
|---|---|---|---|
| Quadrant | BADHDUFLAG | Total packets | Discarded packets |
| A | 0 | 2 | 0 |
| B | 0 | 2 | 0 |
| C | 0 | 2 | 0 |
| D | 0 | 2 | 0 |
| Quadrant | Total seconds | Saturated seconds | Saturation percentage |
|---|---|---|---|
| A | 7463 | 100 | 1.339944% |
| B | 7464 | 141 | 1.889068% |
| C | 7463 | 227 | 3.041672% |
| D | 7463 | 688 | 9.218813% |
Noise dominated data is calculated using 1-second bins in cleaned event files. If a bin has >2000 counts, and if more than 50% of those come from <1% of pixels, then it is considered to be noise-dominated and hence unusable.
| Quadrant | # 1 sec bins | Bins with >0 counts | Bins with >2000 counts | High rate bins dominated by noise | Noise dominated (total time) | Noise dominated (detector-on time) | Marked lightcurve |
|---|---|---|---|---|---|---|---|
| A | 7698 | 7464 | 0 | 0 | 0.00% | 0.00% | 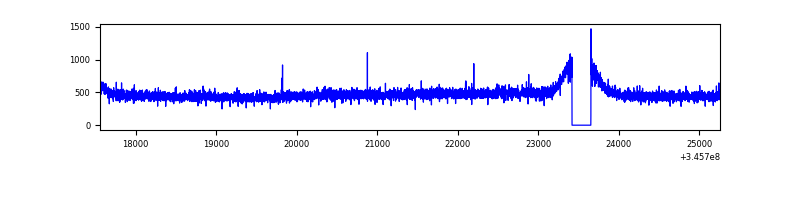 |
| B | 7699 | 7465 | 1 | 1 | 0.01% | 0.01% | 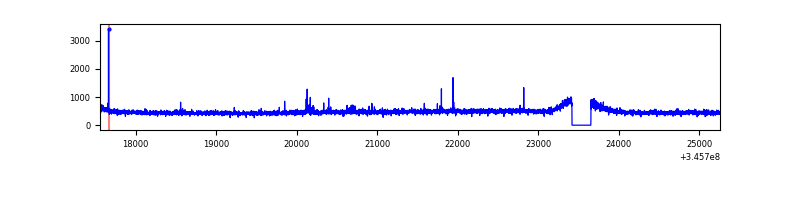 |
| C | 7698 | 7464 | 38 | 38 | 0.49% | 0.51% | 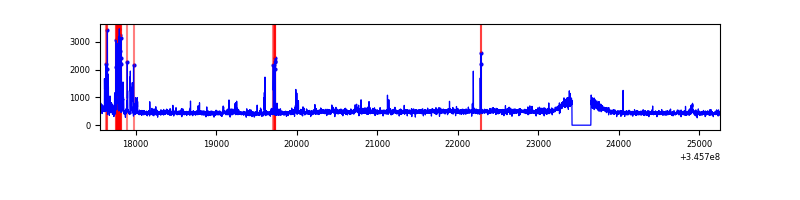 |
| D | 7698 | 7464 | 566 | 566 | 7.35% | 7.58% | 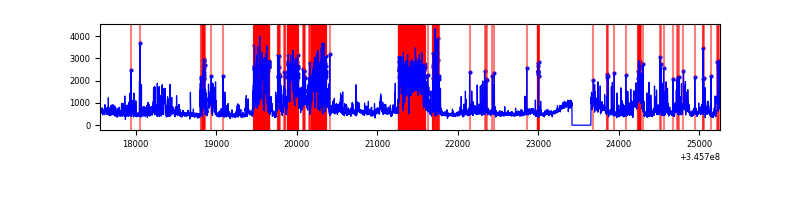 |
Top three noisy pixels from each quadrant. If the there are fewer than three noisy pixels in the level2.evt file, extra rows are filled as -1
| Pixel properties | Quadrant properties | ||||||
|---|---|---|---|---|---|---|---|
| Quadrant | DetID | PixID | Counts | Sigma | Mean | Median | Sigma |
| A | 13 | 254 | 11988 | 60.49 | 905 | 886 | 183.5 |
| A | 3 | 137 | 9254 | 45.59 | 905 | 886 | 183.5 |
| A | 6 | 16 | 7984 | 38.67 | 905 | 886 | 183.5 |
| B | 12 | 111 | 22419 | 122.56 | 895 | 870 | 175.8 |
| B | 11 | 111 | 20311 | 110.57 | 895 | 870 | 175.8 |
| B | 14 | 111 | 19224 | 104.39 | 895 | 870 | 175.8 |
| C | 15 | 208 | 234471 | 1152.48 | 860 | 867 | 202.7 |
| C | 14 | 238 | 138570 | 679.35 | 860 | 867 | 202.7 |
| C | 3 | 233 | 51740 | 250.98 | 860 | 867 | 202.7 |
| D | 1 | 52 | 2885245 | 14219.99 | 853 | 831 | 202.8 |
| D | 8 | 195 | 216470 | 1063.09 | 853 | 831 | 202.8 |
| D | 5 | 222 | 71896 | 350.35 | 853 | 831 | 202.8 |
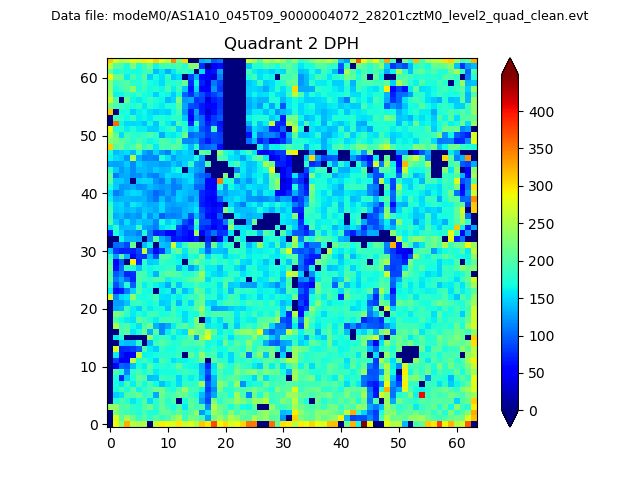
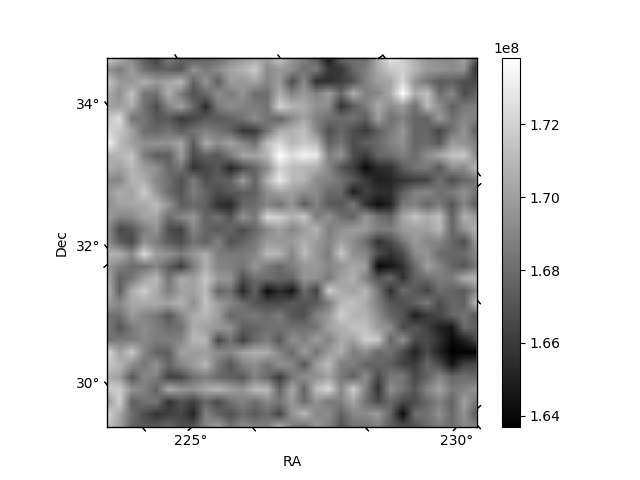
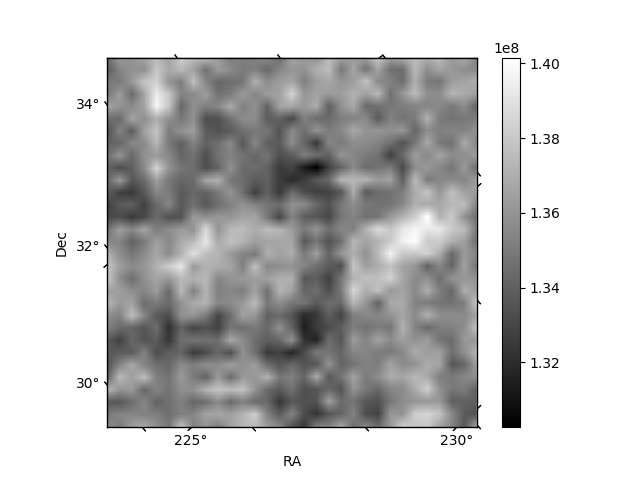
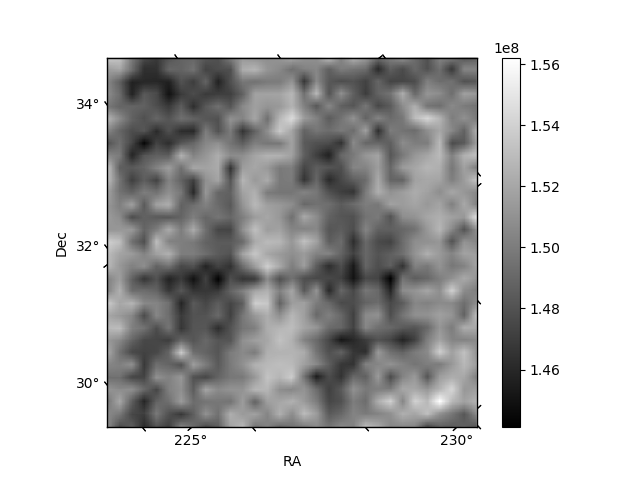
Histogram calculated using DETX and DETY for each event in the final _common_clean file
| Quadrant A | 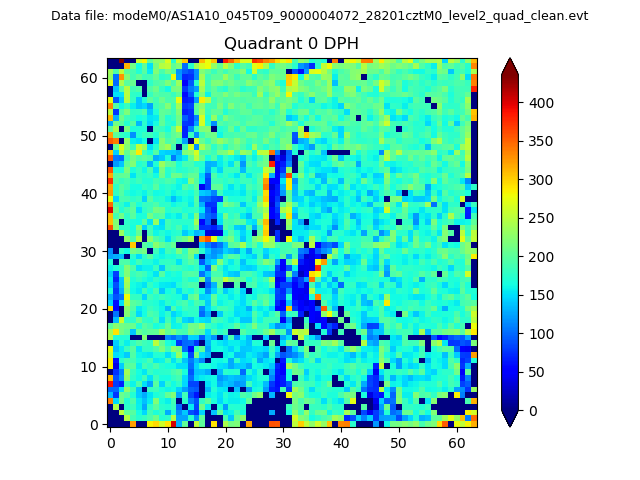 |
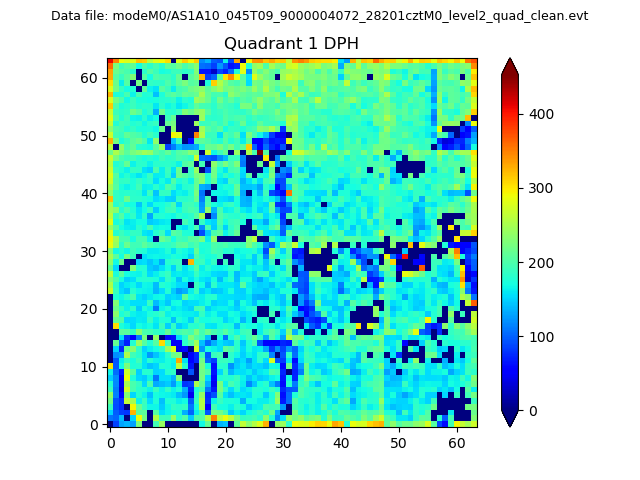 |
Quadrant B |
|---|---|---|---|
| Quadrant D | 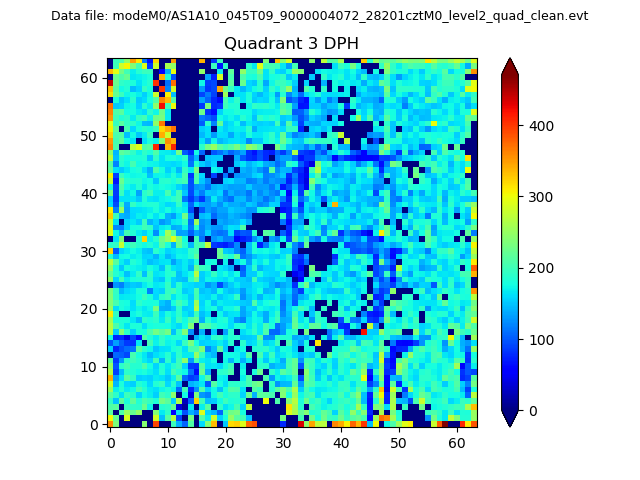 |
 |
Quadrant C |
| Plot type | Count rate plots | Images |
|---|---|---|
| Comparison with Poisson distribution Blue bars denote a histogram of data divided into 1 sec bins. Red curve is a Poisson curve with rate = median count rate of data. |
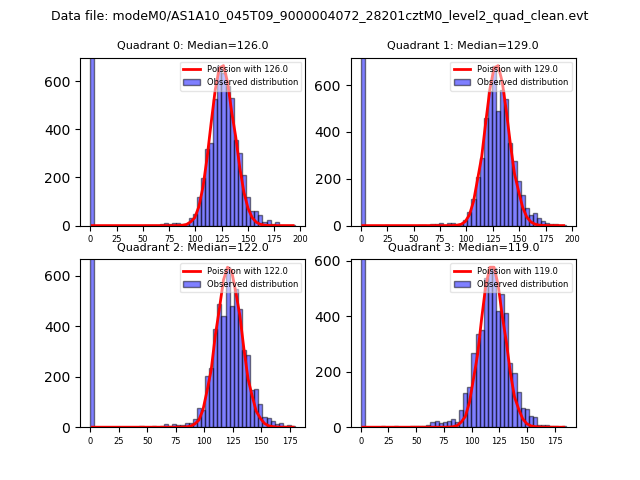 |
 |
| Quadrant-wise count rates Data is divided into 100 sec bins |
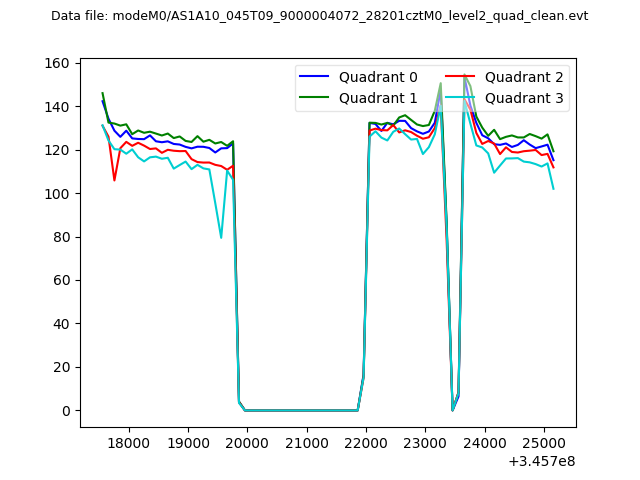 |
|
| Module-wise count rates for Quadrant A Data is divided into 100 sec bins |
 |
 |
| Module-wise count rates for Quadrant B Data is divided into 100 sec bins |
 |
 |
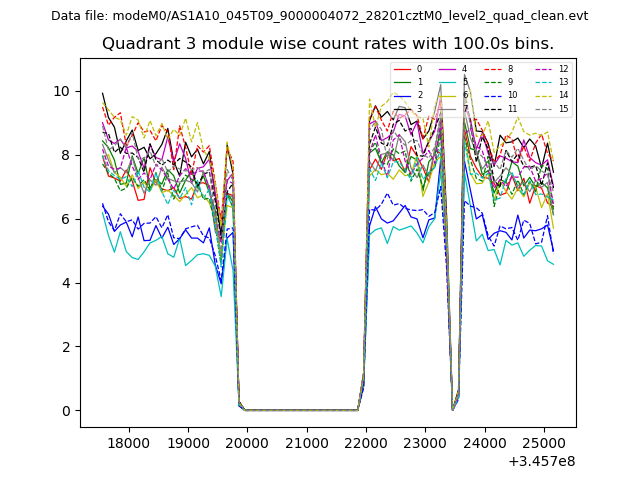
| Module-wise count rates for Quadrant C Data is divided into 100 sec bins |
 |
 |
| Module-wise count rates for Quadrant D Data is divided into 100 sec bins |
 |
 |
| Parameter | Plot |
|---|---|
| CZT HV Monitor |  |
| D_VDD | 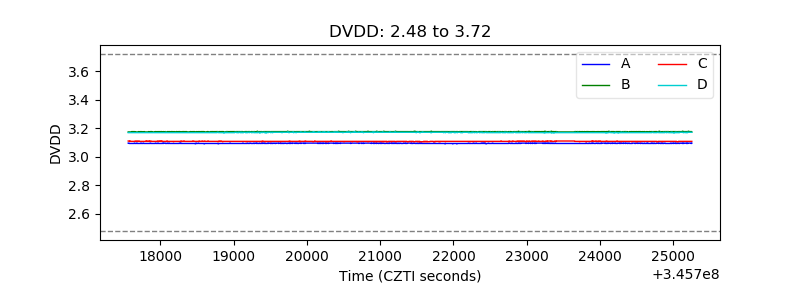 |
| Temperature 1 | 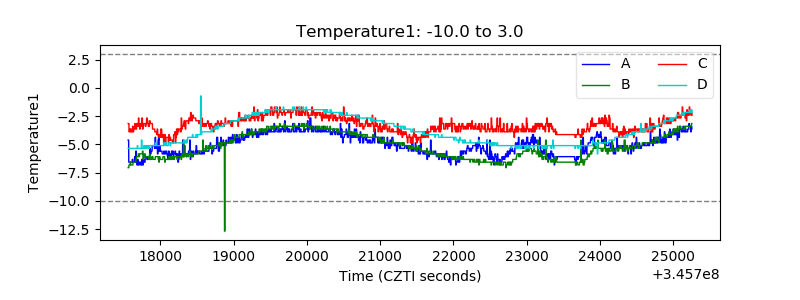 |
| Veto HV Monitor | 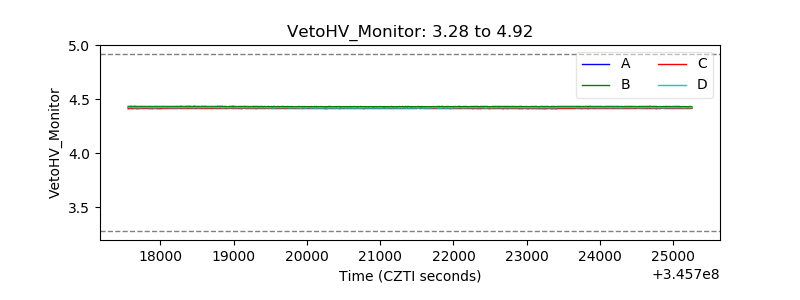 |
| Veto LLD | 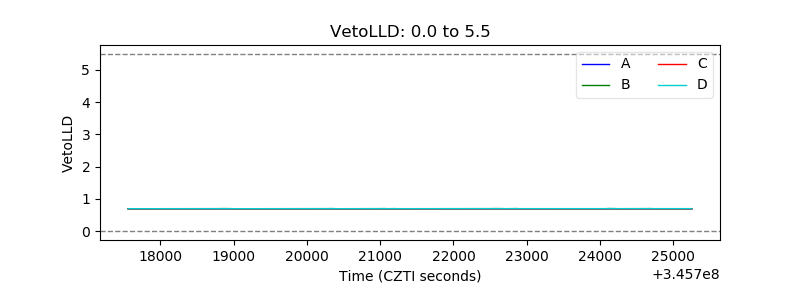 |
| Alpha Counter | 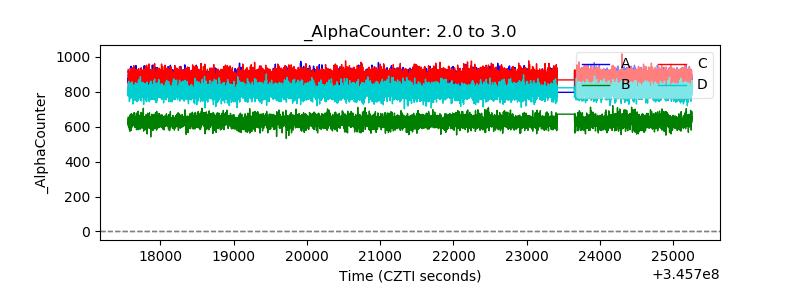 |
| _CPM_Rate | 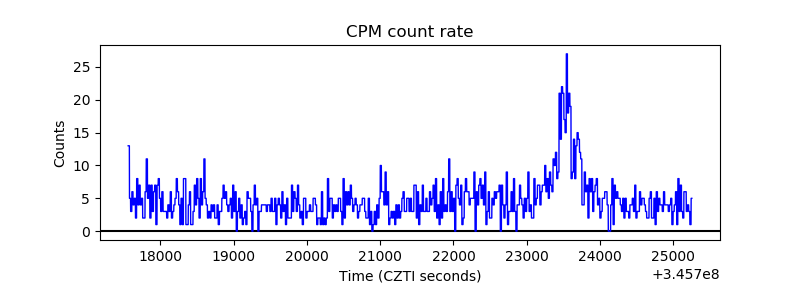 |
| CZT Counter | 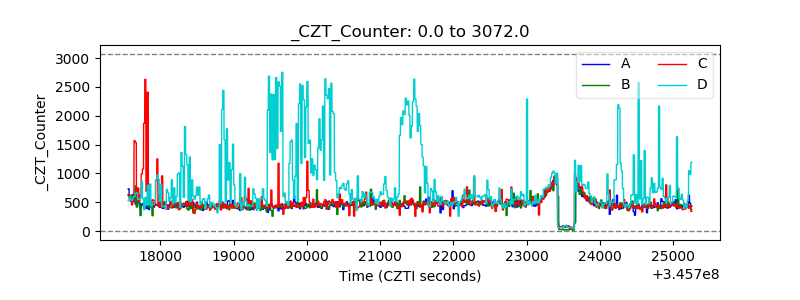 |
| +2.5 Volts monitor |  |
| +5 Volts monitor |  |
| _ROLL_ROT | 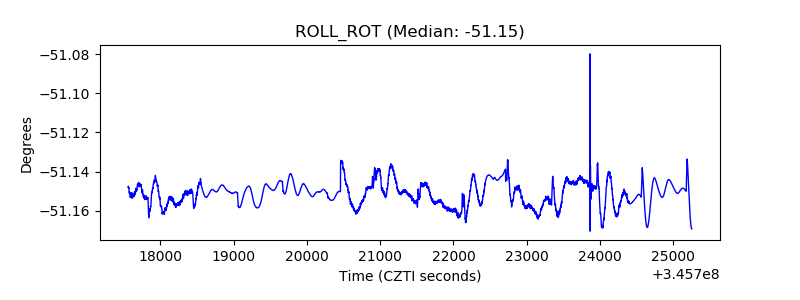 |
| _Roll_DEC | 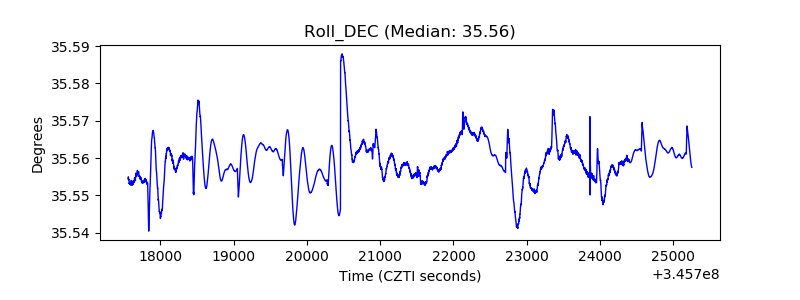 |
| _Roll_RA | 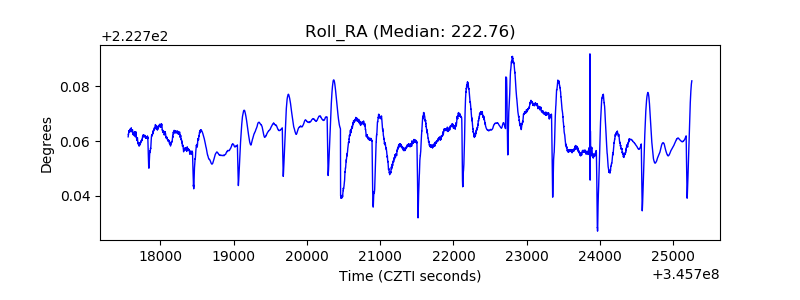 |
| Veto Counter |  |