| Param | Original file | Final file |
|---|---|---|
| Filename | modeM0/AS1A10_045T09_9000004072_28202cztM0_level2.evt | modeM0/AS1A10_045T09_9000004072_28202cztM0_level2_quad_clean.evt |
| Size (bytes) | 538,683,840 | 102,890,880 |
| Size | 513.7 MB | 98.1 MB |
| Events in quadrant A | 3,479,518 | 660,878 |
| Events in quadrant B | 3,520,877 | 675,882 |
| Events in quadrant C | 3,527,979 | 641,508 |
| Events in quadrant D | 5,281,160 | 620,243 |
| Mode M0 | |||
|---|---|---|---|
| Quadrant | BADHDUFLAG | Total packets | Discarded packets |
| A | 0 | 15245 | 0 |
| B | 0 | 15301 | 0 |
| C | 0 | 15348 | 0 |
| D | 0 | 20771 | 0 |
| Mode M9 | |||
|---|---|---|---|
| Quadrant | BADHDUFLAG | Total packets | Discarded packets |
| A | 0 | 1 | 0 |
| B | 0 | 1 | 0 |
| C | 0 | 1 | 0 |
| D | 0 | 1 | 0 |
| Quadrant | Total seconds | Saturated seconds | Saturation percentage |
|---|---|---|---|
| A | 7434 | 157 | 2.111918% |
| B | 7435 | 191 | 2.568931% |
| C | 7435 | 223 | 2.999328% |
| D | 7435 | 245 | 3.295225% |
Noise dominated data is calculated using 1-second bins in cleaned event files. If a bin has >2000 counts, and if more than 50% of those come from <1% of pixels, then it is considered to be noise-dominated and hence unusable.
| Quadrant | # 1 sec bins | Bins with >0 counts | Bins with >2000 counts | High rate bins dominated by noise | Noise dominated (total time) | Noise dominated (detector-on time) | Marked lightcurve |
|---|---|---|---|---|---|---|---|
| A | 7554 | 7434 | 0 | 0 | 0.00% | 0.00% | 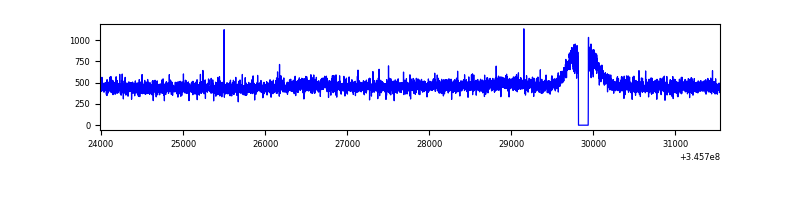 |
| B | 7555 | 7436 | 0 | 0 | 0.00% | 0.00% | 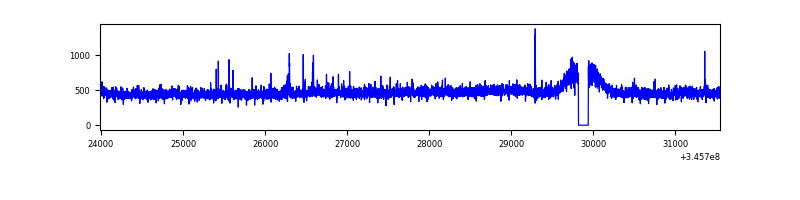 |
| C | 7555 | 7435 | 1 | 1 | 0.01% | 0.01% | 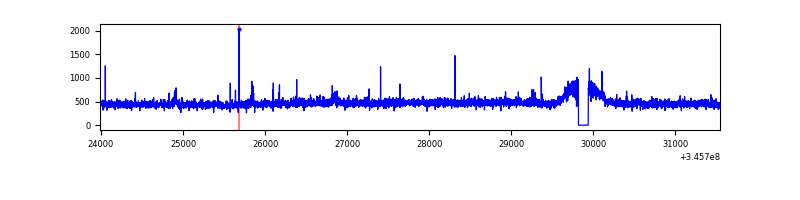 |
| D | 7555 | 7436 | 85 | 85 | 1.13% | 1.14% | 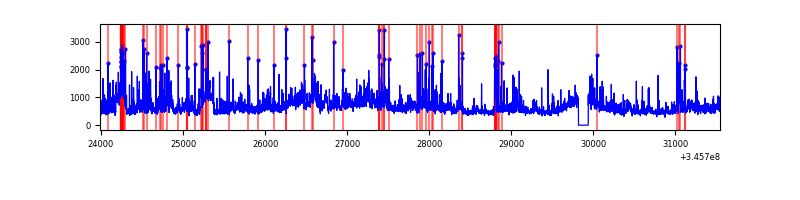 |
Top three noisy pixels from each quadrant. If the there are fewer than three noisy pixels in the level2.evt file, extra rows are filled as -1
| Pixel properties | Quadrant properties | ||||||
|---|---|---|---|---|---|---|---|
| Quadrant | DetID | PixID | Counts | Sigma | Mean | Median | Sigma |
| A | 13 | 254 | 11678 | 59.21 | 898 | 877 | 182.4 |
| A | 3 | 137 | 9203 | 45.65 | 898 | 877 | 182.4 |
| A | 12 | 16 | 9101 | 45.09 | 898 | 877 | 182.4 |
| B | 12 | 111 | 21578 | 120.29 | 885 | 861 | 172.2 |
| B | 11 | 111 | 20112 | 111.78 | 885 | 861 | 172.2 |
| B | 0 | 190 | 18946 | 105.01 | 885 | 861 | 172.2 |
| C | 14 | 238 | 136431 | 677.77 | 854 | 856 | 200.0 |
| C | 7 | 255 | 28348 | 137.44 | 854 | 856 | 200.0 |
| C | 3 | 233 | 15390 | 72.66 | 854 | 856 | 200.0 |
| D | 1 | 52 | 1638842 | 7963.55 | 860 | 832 | 205.7 |
| D | 8 | 195 | 244323 | 1183.79 | 860 | 832 | 205.7 |
| D | 12 | 250 | 40299 | 191.88 | 860 | 832 | 205.7 |
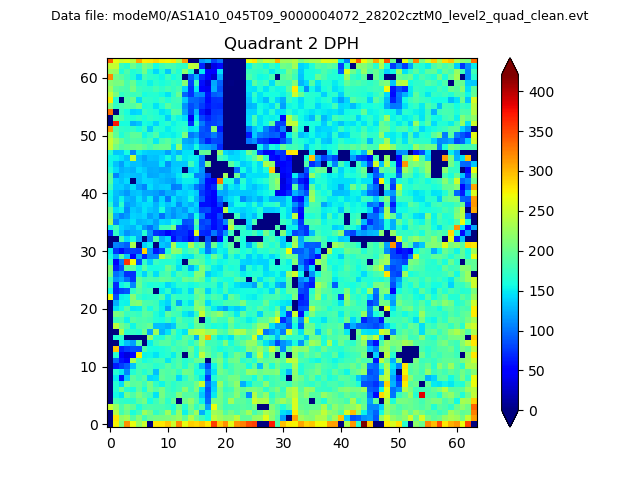
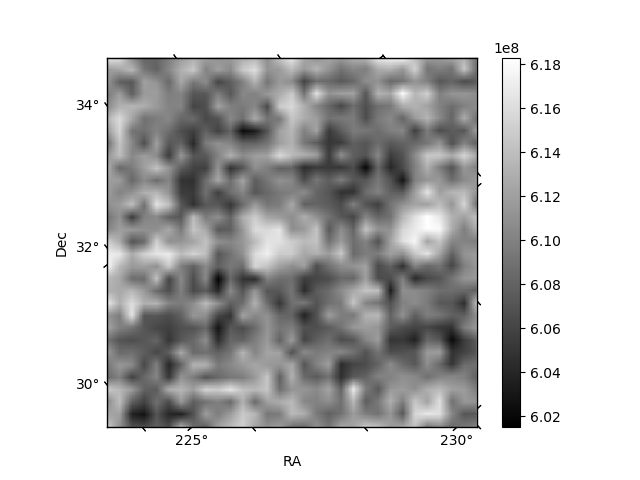
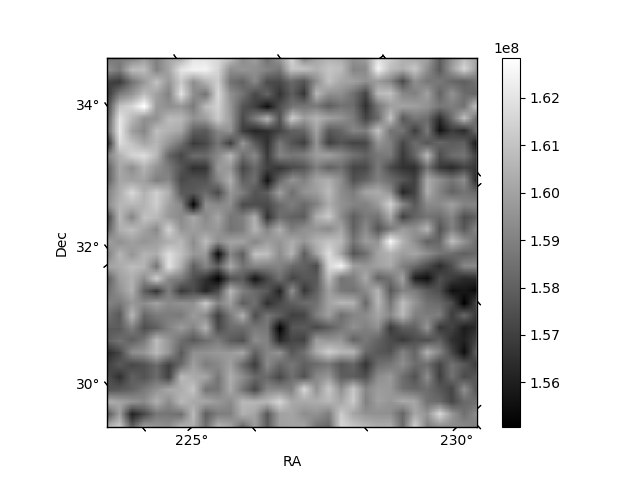
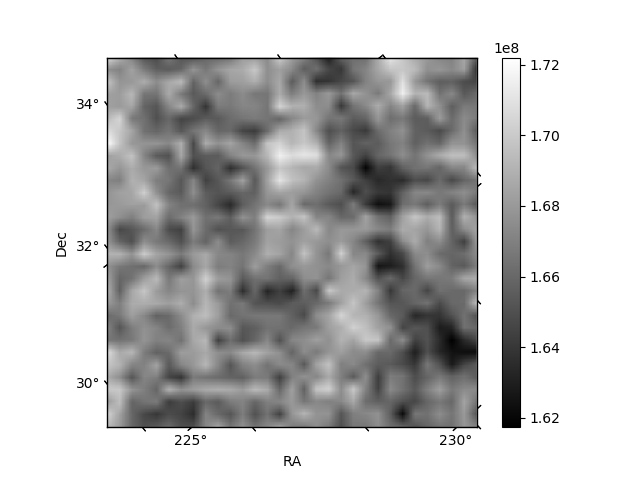
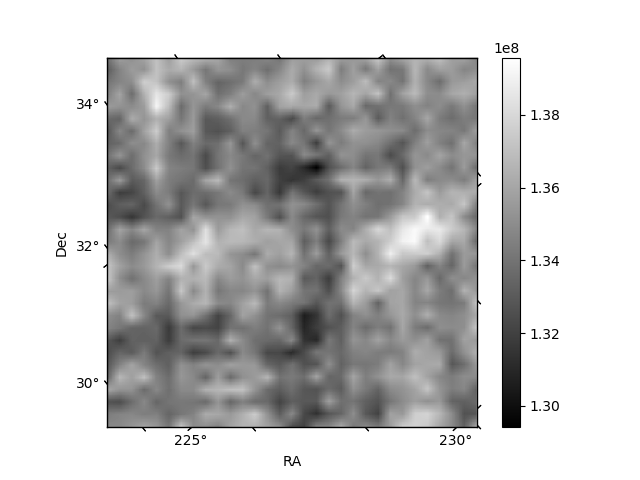
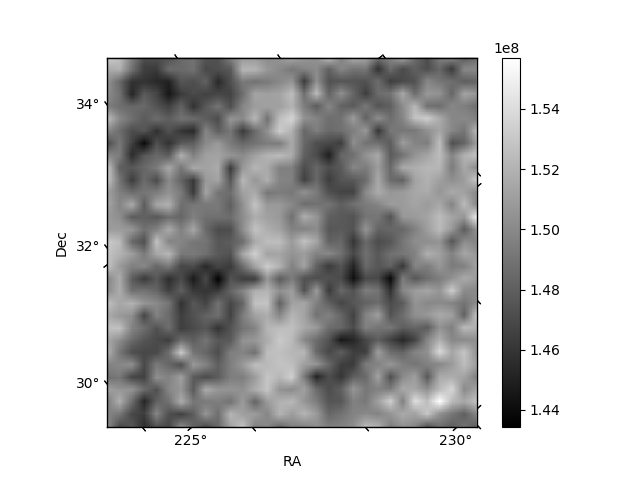
Histogram calculated using DETX and DETY for each event in the final _common_clean file
| Quadrant A | 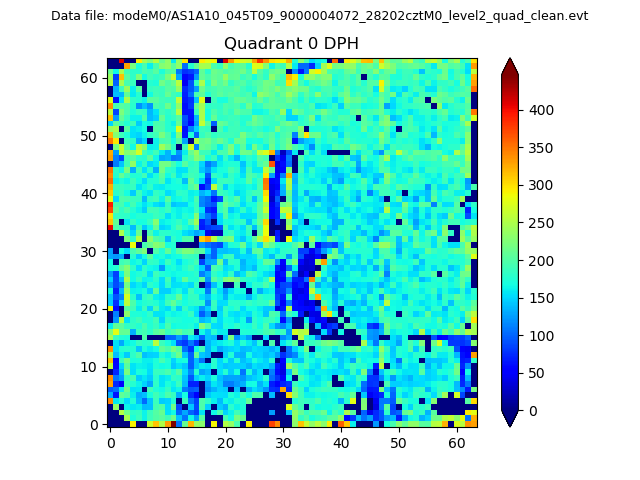 |
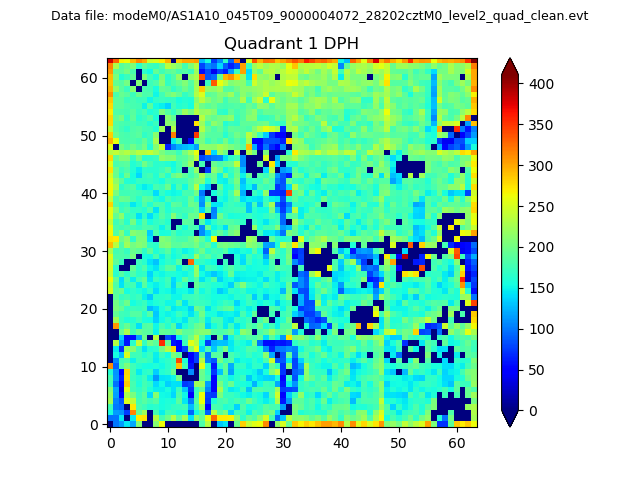 |
Quadrant B |
|---|---|---|---|
| Quadrant D | 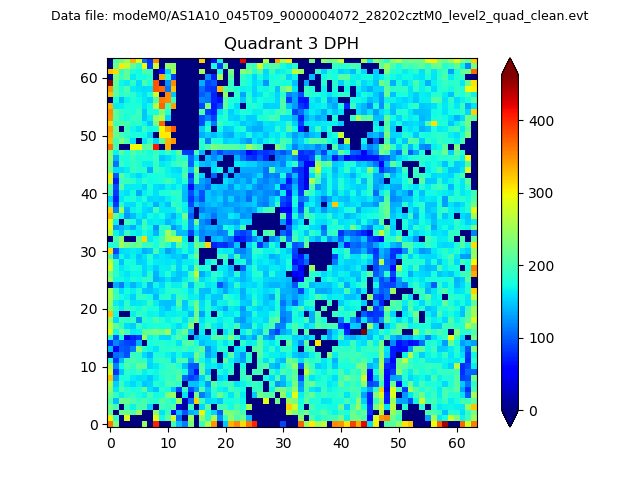 |
 |
Quadrant C |
| Plot type | Count rate plots | Images |
|---|---|---|
| Comparison with Poisson distribution Blue bars denote a histogram of data divided into 1 sec bins. Red curve is a Poisson curve with rate = median count rate of data. |
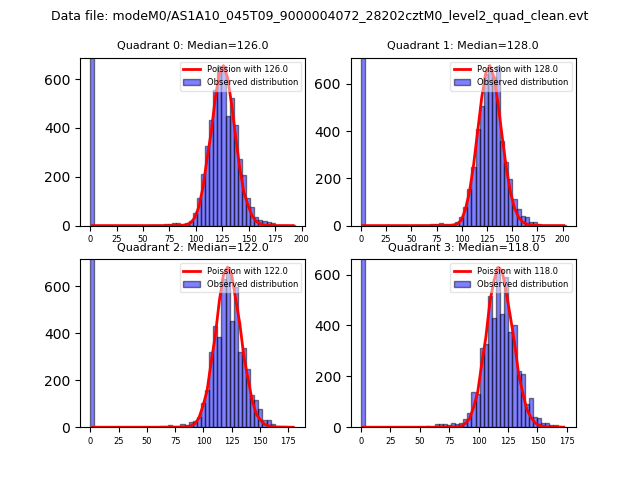 |
 |
| Quadrant-wise count rates Data is divided into 100 sec bins |
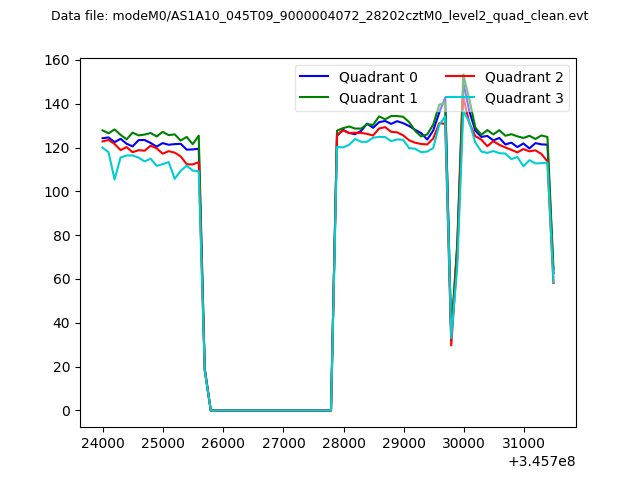 |
|
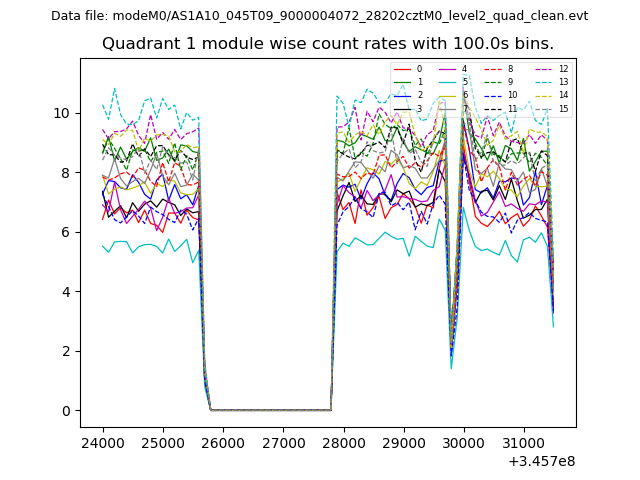
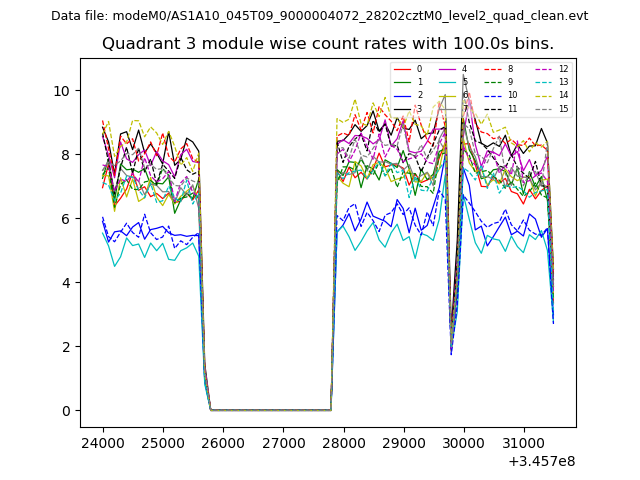
| Module-wise count rates for Quadrant A Data is divided into 100 sec bins |
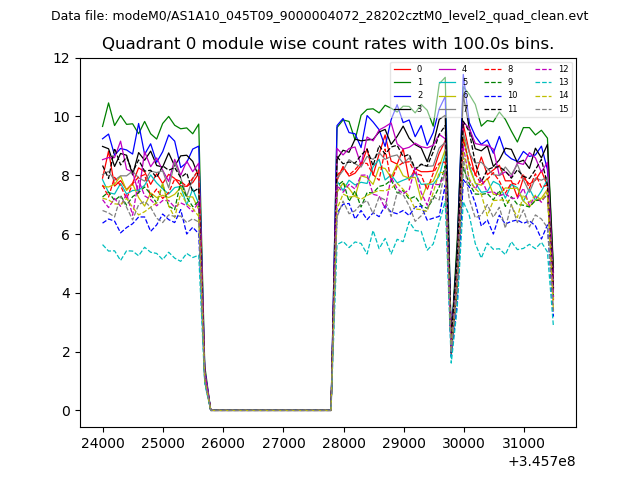 |
 |
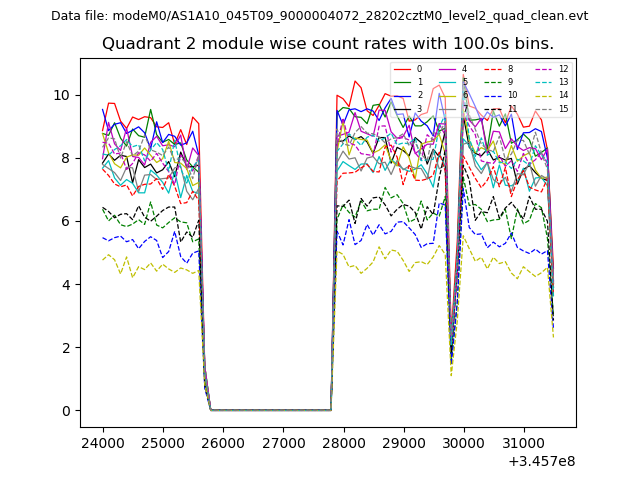
| Module-wise count rates for Quadrant B Data is divided into 100 sec bins |
 |
 |
| Module-wise count rates for Quadrant C Data is divided into 100 sec bins |
 |
 |
| Module-wise count rates for Quadrant D Data is divided into 100 sec bins |
 |
 |
| Parameter | Plot |
|---|---|
| CZT HV Monitor | 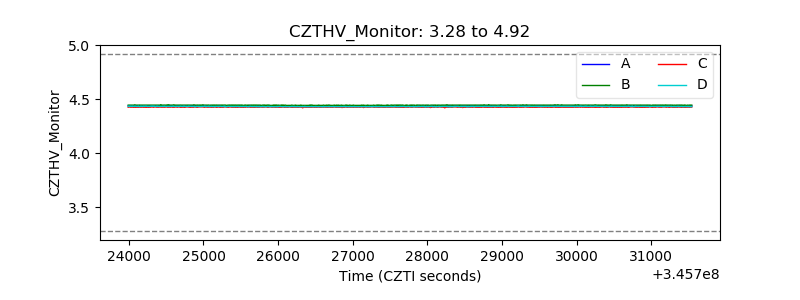 |
| D_VDD | 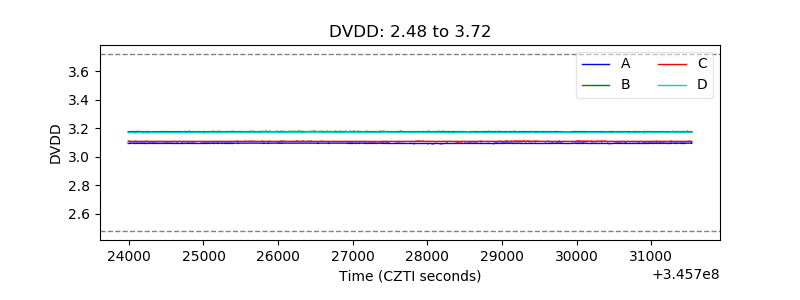 |
| Temperature 1 | 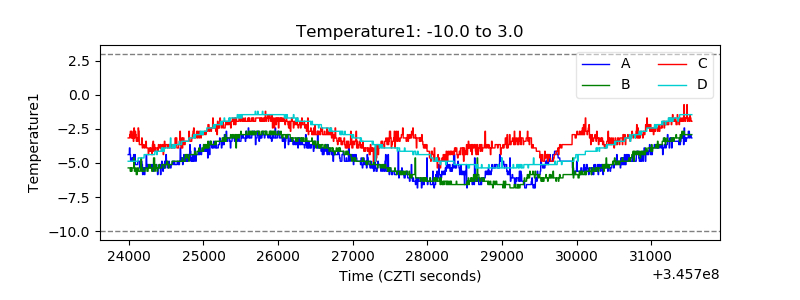 |
| Veto HV Monitor | 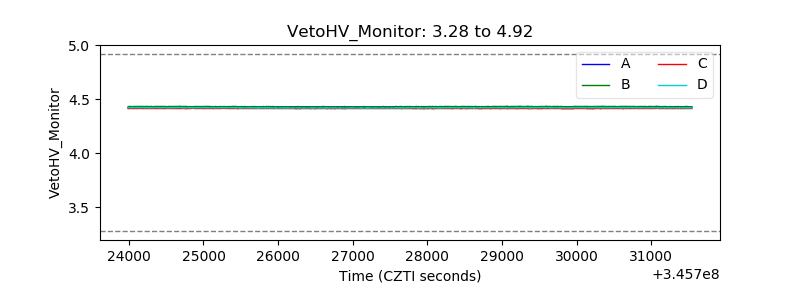 |
| Veto LLD | 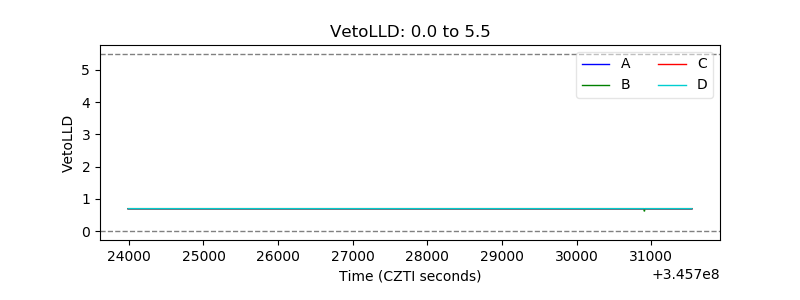 |
| Alpha Counter | 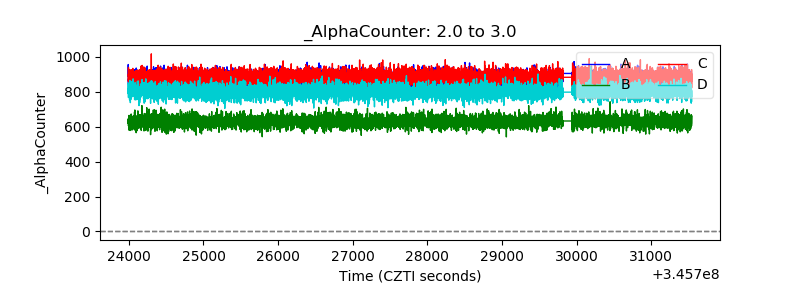 |
| _CPM_Rate | 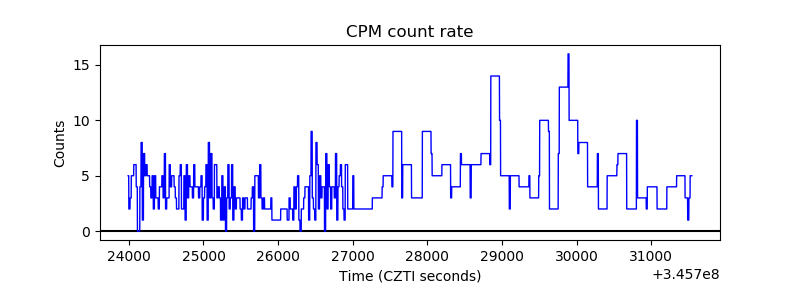 |
| CZT Counter | 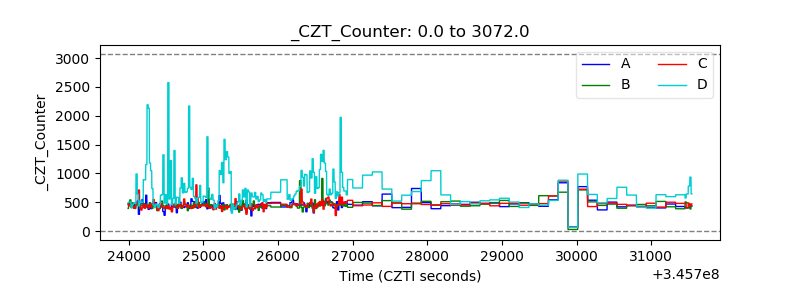 |
| +2.5 Volts monitor |  |
| +5 Volts monitor | 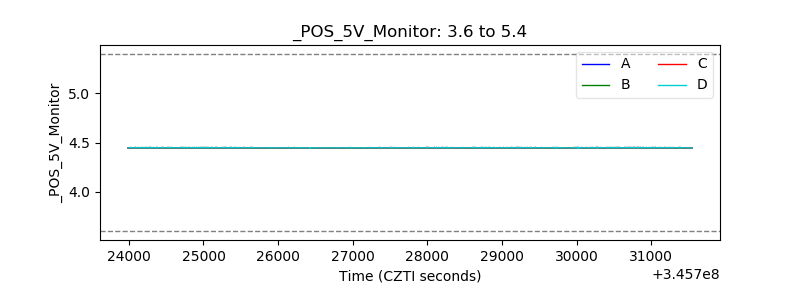 |
| _ROLL_ROT | 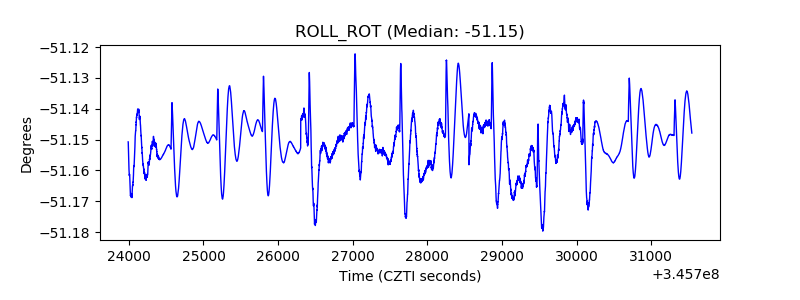 |
| _Roll_DEC | 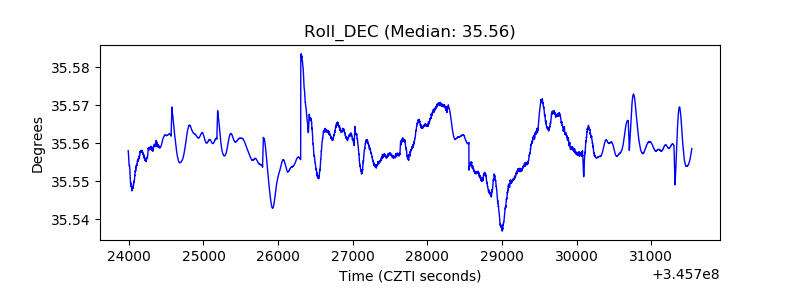 |
| _Roll_RA | 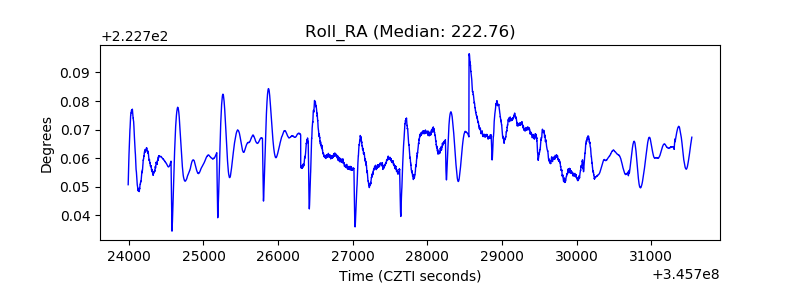 |
| Veto Counter | 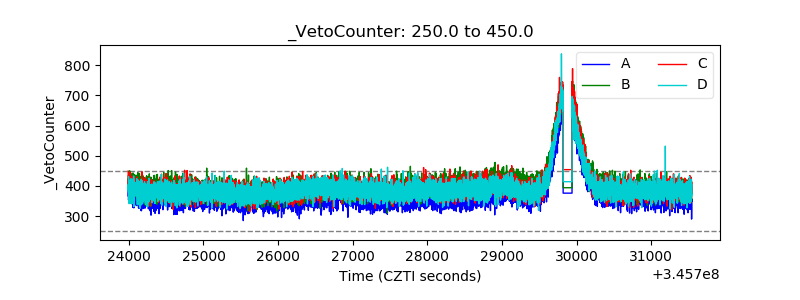 |