| Param | Original file | Final file |
|---|---|---|
| Filename | modeM0/AS1A10_045T09_9000004072_28203cztM0_level2.evt | modeM0/AS1A10_045T09_9000004072_28203cztM0_level2_quad_clean.evt |
| Size (bytes) | 579,093,120 | 86,941,440 |
| Size | 552.3 MB | 82.9 MB |
| Events in quadrant A | 3,305,617 | 547,205 |
| Events in quadrant B | 3,360,796 | 559,523 |
| Events in quadrant C | 3,533,179 | 528,624 |
| Events in quadrant D | 6,853,634 | 499,315 |
| Mode M0 | |||
|---|---|---|---|
| Quadrant | BADHDUFLAG | Total packets | Discarded packets |
| A | 0 | 14506 | 0 |
| B | 0 | 14563 | 0 |
| C | 0 | 15060 | 0 |
| D | 0 | 25386 | 0 |
| Mode M9 | |||
|---|---|---|---|
| Quadrant | BADHDUFLAG | Total packets | Discarded packets |
| A | 0 | 4 | 0 |
| B | 0 | 4 | 0 |
| C | 0 | 4 | 0 |
| D | 0 | 4 | 0 |
| Quadrant | Total seconds | Saturated seconds | Saturation percentage |
|---|---|---|---|
| A | 7145 | 67 | 0.937719% |
| B | 7145 | 73 | 1.021693% |
| C | 7146 | 121 | 1.693255% |
| D | 7146 | 713 | 9.977610% |
Noise dominated data is calculated using 1-second bins in cleaned event files. If a bin has >2000 counts, and if more than 50% of those come from <1% of pixels, then it is considered to be noise-dominated and hence unusable.
| Quadrant | # 1 sec bins | Bins with >0 counts | Bins with >2000 counts | High rate bins dominated by noise | Noise dominated (total time) | Noise dominated (detector-on time) | Marked lightcurve |
|---|---|---|---|---|---|---|---|
| A | 7555 | 7145 | 0 | 0 | 0.00% | 0.00% |  |
| B | 7555 | 7145 | 2 | 2 | 0.03% | 0.03% |  |
| C | 7556 | 7146 | 14 | 14 | 0.19% | 0.20% |  |
| D | 7556 | 7146 | 639 | 639 | 8.46% | 8.94% |  |
Top three noisy pixels from each quadrant. If the there are fewer than three noisy pixels in the level2.evt file, extra rows are filled as -1
| Pixel properties | Quadrant properties | ||||||
|---|---|---|---|---|---|---|---|
| Quadrant | DetID | PixID | Counts | Sigma | Mean | Median | Sigma |
| A | 13 | 254 | 10840 | 57.76 | 853 | 833 | 173.3 |
| A | 3 | 137 | 8658 | 45.16 | 853 | 833 | 173.3 |
| A | 0 | 226 | 7288 | 37.26 | 853 | 833 | 173.3 |
| B | 12 | 111 | 20757 | 121.0 | 842 | 819 | 164.8 |
| B | 11 | 111 | 18956 | 110.07 | 842 | 819 | 164.8 |
| B | 0 | 183 | 18270 | 105.91 | 842 | 819 | 164.8 |
| C | 3 | 233 | 191617 | 996.47 | 812 | 816 | 191.5 |
| C | 14 | 238 | 129927 | 674.29 | 812 | 816 | 191.5 |
| C | 7 | 255 | 18886 | 94.37 | 812 | 816 | 191.5 |
| D | 1 | 52 | 3354470 | 17547.78 | 798 | 776 | 191.1 |
| D | 8 | 195 | 172097 | 896.42 | 798 | 776 | 191.1 |
| D | 5 | 222 | 101241 | 525.67 | 798 | 776 | 191.1 |
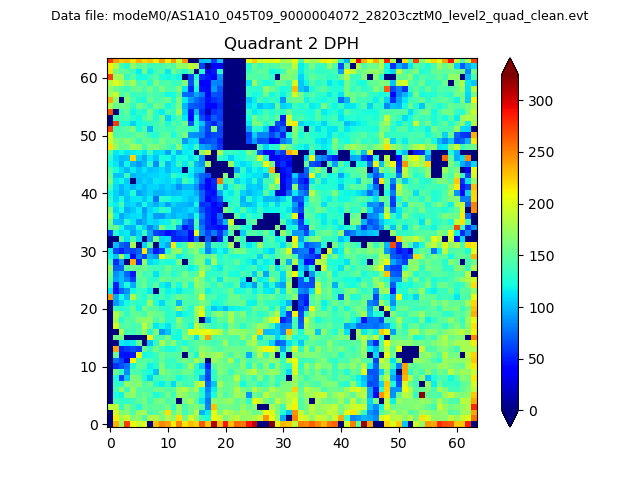
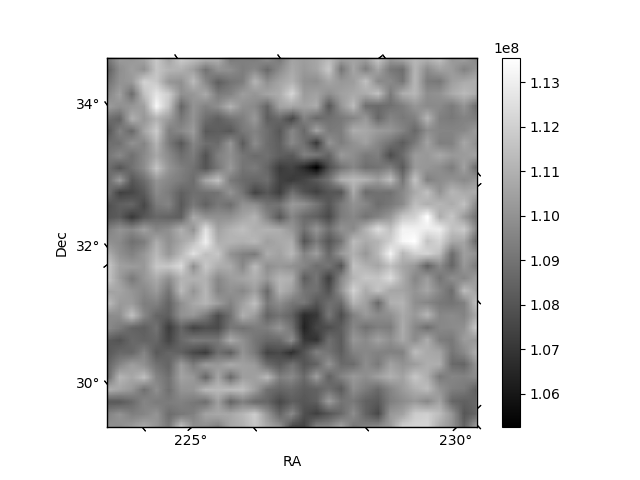
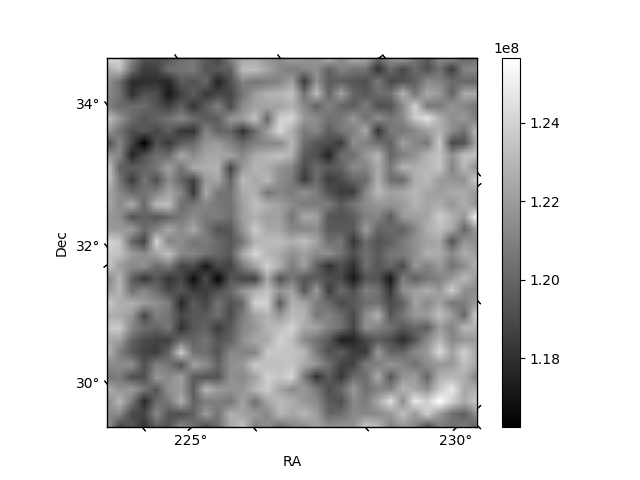
Histogram calculated using DETX and DETY for each event in the final _common_clean file
| Quadrant A | 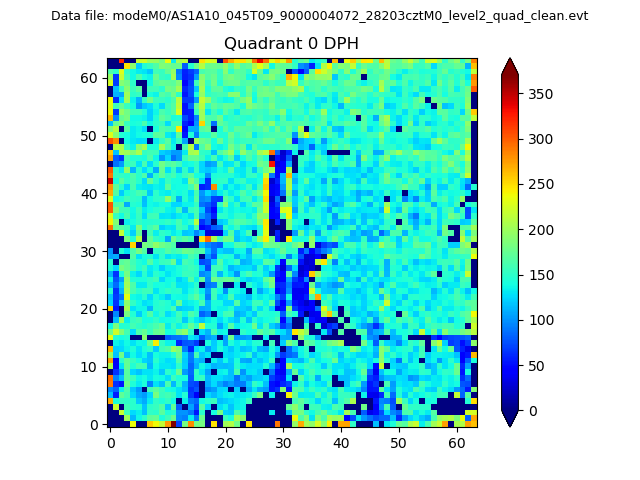 |
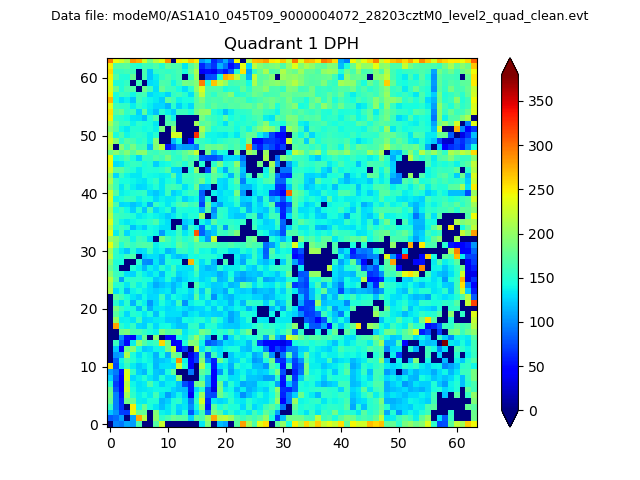 |
Quadrant B |
|---|---|---|---|
| Quadrant D | 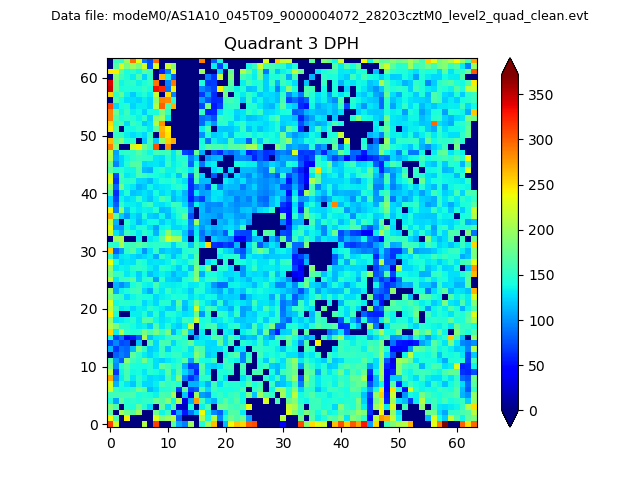 |
 |
Quadrant C |
| Plot type | Count rate plots | Images |
|---|---|---|
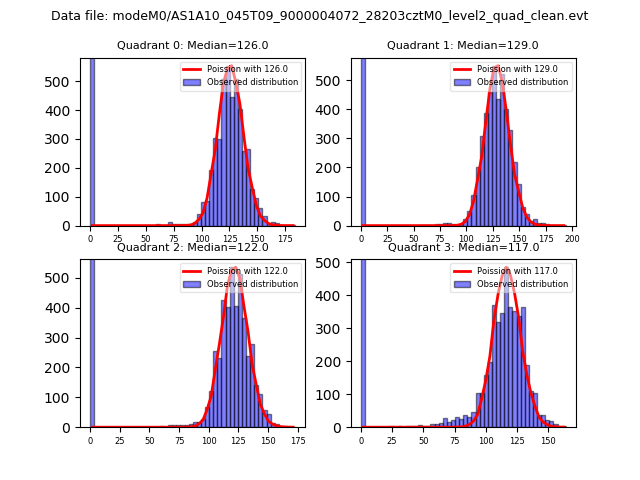
| Comparison with Poisson distribution Blue bars denote a histogram of data divided into 1 sec bins. Red curve is a Poisson curve with rate = median count rate of data. |
 |
 |
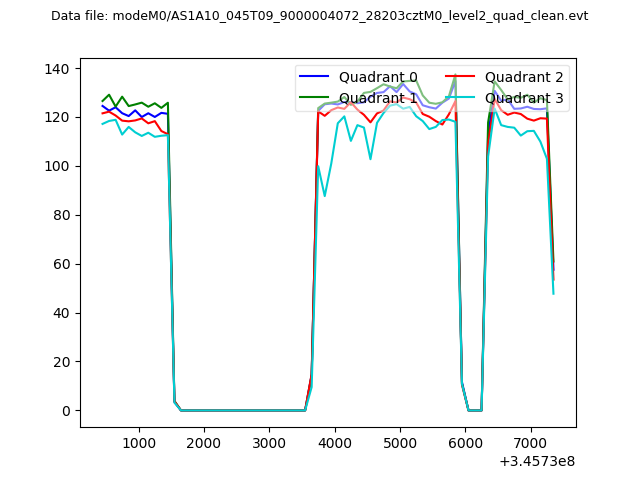
| Quadrant-wise count rates Data is divided into 100 sec bins |
 |
|
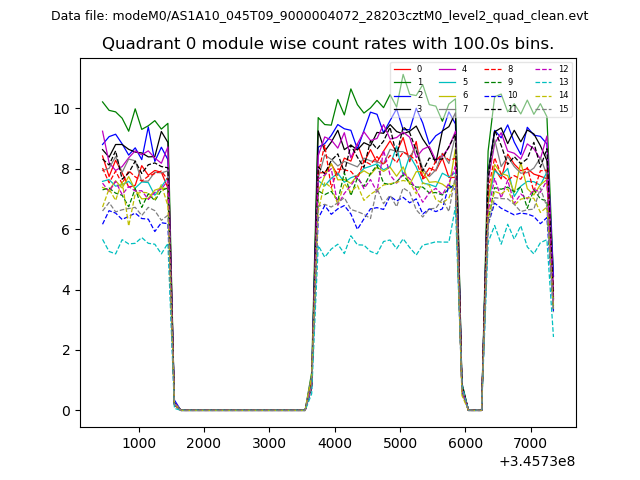
| Module-wise count rates for Quadrant A Data is divided into 100 sec bins |
 |
 |
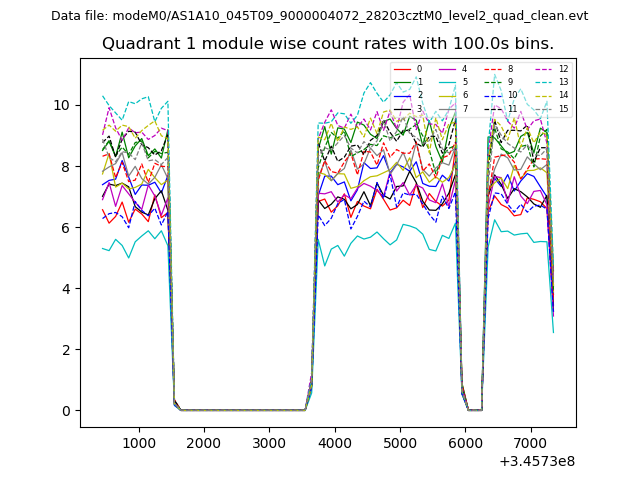
| Module-wise count rates for Quadrant B Data is divided into 100 sec bins |
 |
 |
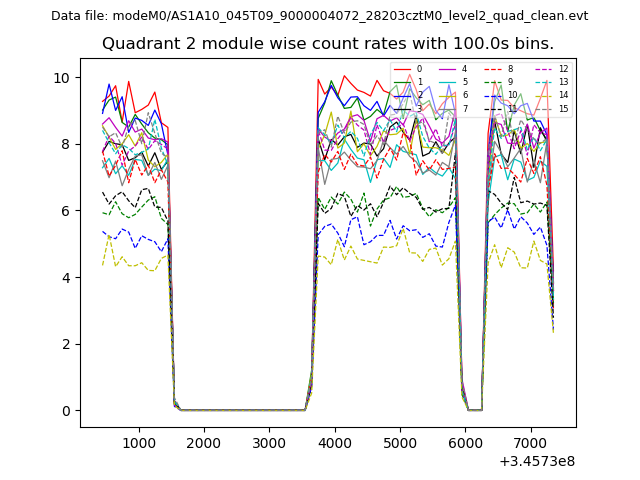
| Module-wise count rates for Quadrant C Data is divided into 100 sec bins |
 |
 |
| Module-wise count rates for Quadrant D Data is divided into 100 sec bins |
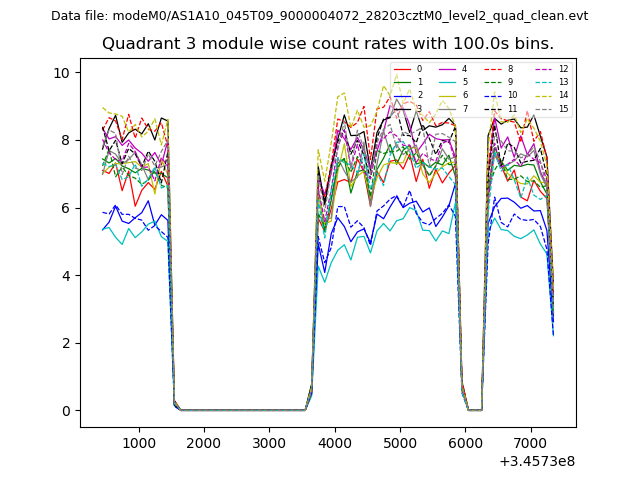 |
 |
| Parameter | Plot |
|---|---|
| CZT HV Monitor | 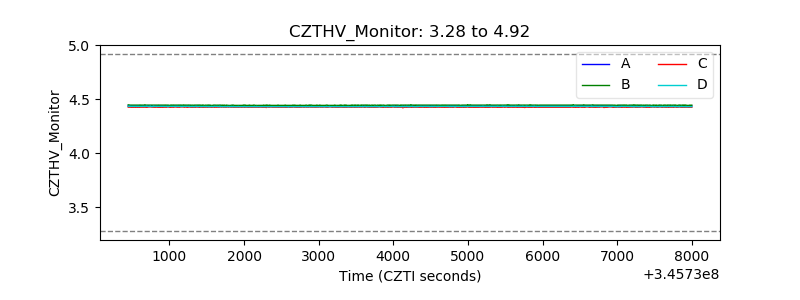 |
| D_VDD | 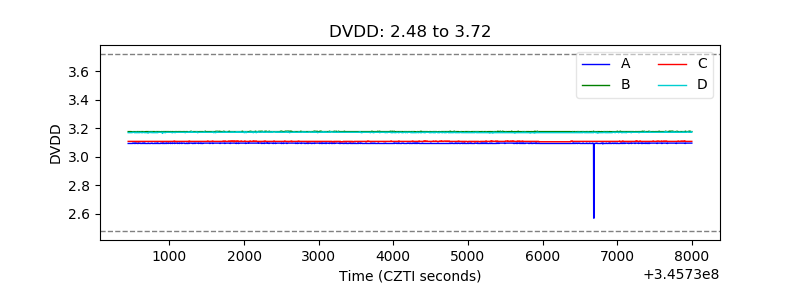 |
| Temperature 1 |  |
| Veto HV Monitor | 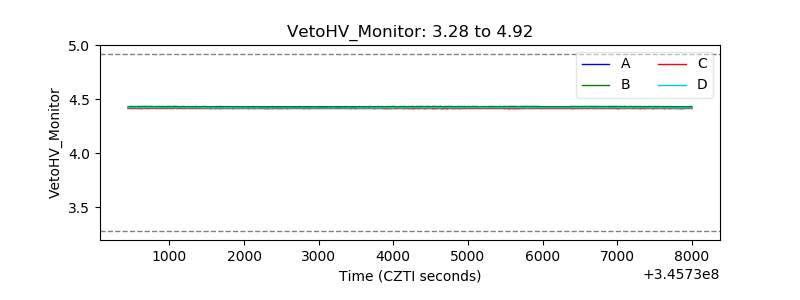 |
| Veto LLD | 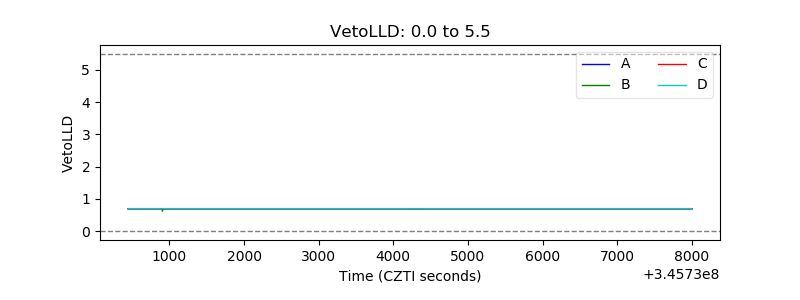 |
| Alpha Counter | 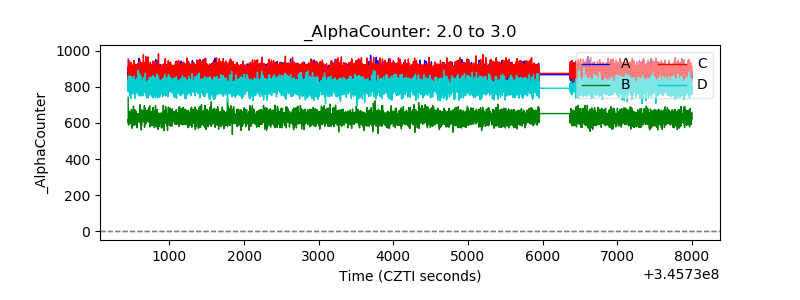 |
| _CPM_Rate | 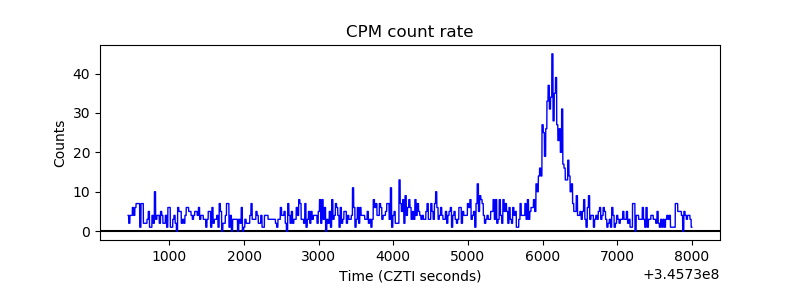 |
| CZT Counter | 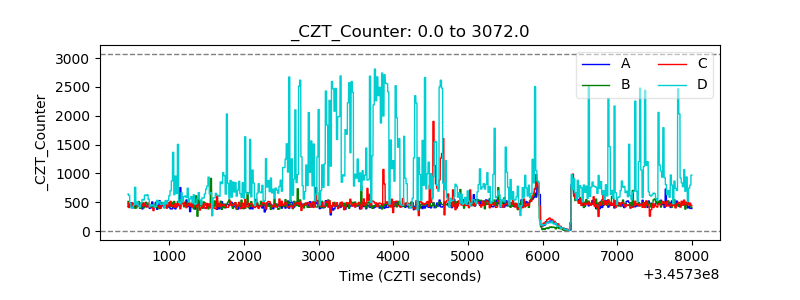 |
| +2.5 Volts monitor |  |
| +5 Volts monitor |  |
| _ROLL_ROT | 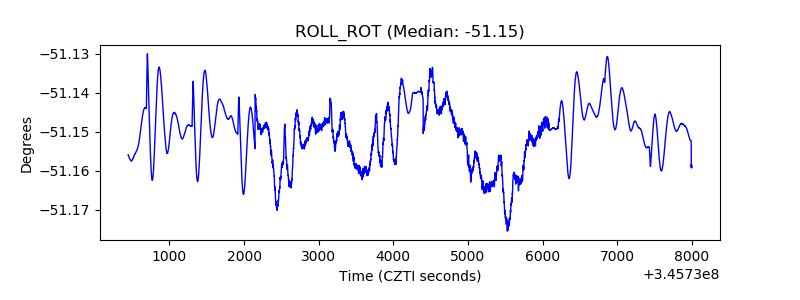 |
| _Roll_DEC | 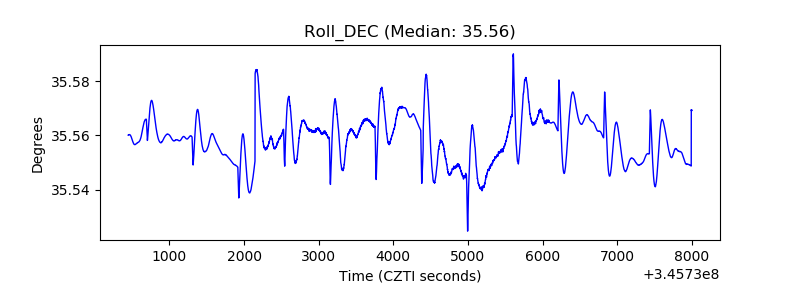 |
| _Roll_RA | 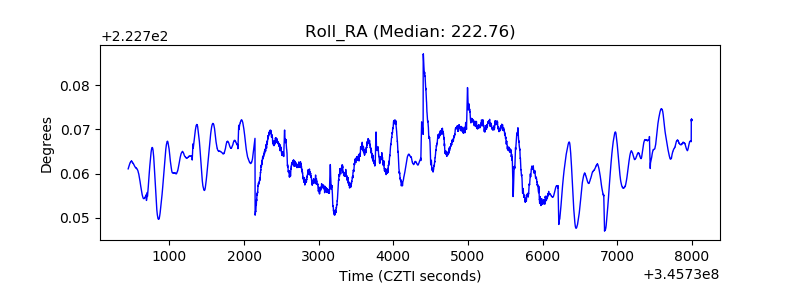 |
| Veto Counter | 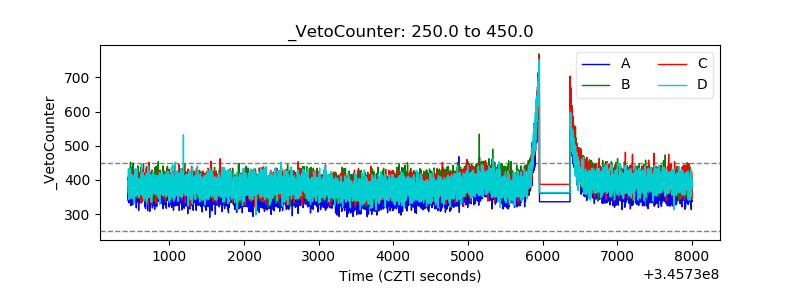 |