| Param | Original file | Final file |
|---|---|---|
| Filename | modeM0/AS1A10_045T09_9000004072_28205cztM0_level2.evt | modeM0/AS1A10_045T09_9000004072_28205cztM0_level2_quad_clean.evt |
| Size (bytes) | 981,175,680 | 136,359,360 |
| Size | 935.7 MB | 130.0 MB |
| Events in quadrant A | 5,848,876 | 833,790 |
| Events in quadrant B | 5,977,235 | 841,725 |
| Events in quadrant C | 6,024,334 | 808,226 |
| Events in quadrant D | 11,021,520 | 783,437 |
| Mode M0 | |||
|---|---|---|---|
| Quadrant | BADHDUFLAG | Total packets | Discarded packets |
| A | 0 | 25418 | 0 |
| B | 0 | 25649 | 0 |
| C | 0 | 25750 | 0 |
| D | 0 | 41350 | 0 |
| Mode M9 | |||
|---|---|---|---|
| Quadrant | BADHDUFLAG | Total packets | Discarded packets |
| A | 0 | 13 | 0 |
| B | 0 | 13 | 0 |
| C | 0 | 13 | 0 |
| D | 0 | 13 | 0 |
| Quadrant | Total seconds | Saturated seconds | Saturation percentage |
|---|---|---|---|
| A | 12470 | 114 | 0.914194% |
| B | 12471 | 136 | 1.090530% |
| C | 12471 | 202 | 1.619758% |
| D | 12471 | 926 | 7.425227% |
Noise dominated data is calculated using 1-second bins in cleaned event files. If a bin has >2000 counts, and if more than 50% of those come from <1% of pixels, then it is considered to be noise-dominated and hence unusable.
| Quadrant | # 1 sec bins | Bins with >0 counts | Bins with >2000 counts | High rate bins dominated by noise | Noise dominated (total time) | Noise dominated (detector-on time) | Marked lightcurve |
|---|---|---|---|---|---|---|---|
| A | 13780 | 12471 | 0 | 0 | 0.00% | 0.00% | 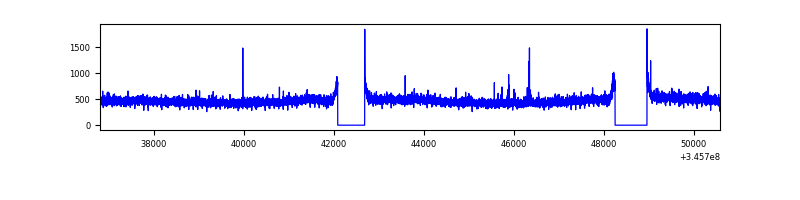 |
| B | 13781 | 12471 | 3 | 3 | 0.02% | 0.02% | 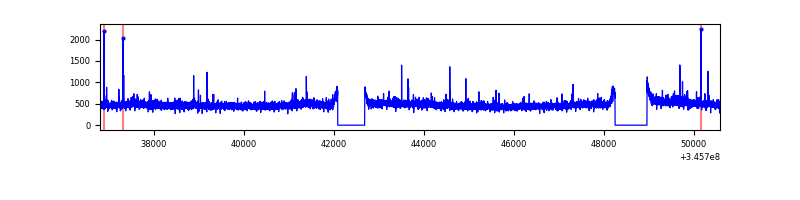 |
| C | 13781 | 12471 | 8 | 8 | 0.06% | 0.06% | 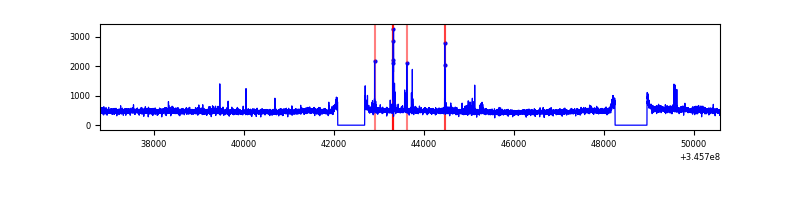 |
| D | 13781 | 12471 | 734 | 734 | 5.33% | 5.89% | 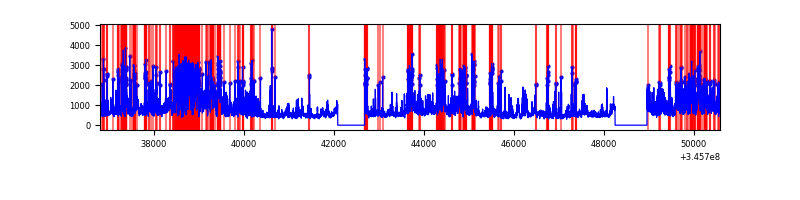 |
Top three noisy pixels from each quadrant. If the there are fewer than three noisy pixels in the level2.evt file, extra rows are filled as -1
| Pixel properties | Quadrant properties | ||||||
|---|---|---|---|---|---|---|---|
| Quadrant | DetID | PixID | Counts | Sigma | Mean | Median | Sigma |
| A | 13 | 254 | 17749 | 53.52 | 1507 | 1473 | 304.1 |
| A | 12 | 96 | 16540 | 49.54 | 1507 | 1473 | 304.1 |
| A | 3 | 137 | 15607 | 46.47 | 1507 | 1473 | 304.1 |
| B | 0 | 183 | 45687 | 154.32 | 1488 | 1449 | 286.7 |
| B | 0 | 230 | 40846 | 137.44 | 1488 | 1449 | 286.7 |
| B | 12 | 111 | 36524 | 122.36 | 1488 | 1449 | 286.7 |
| C | 14 | 238 | 230093 | 675.05 | 1442 | 1451 | 338.7 |
| C | 15 | 208 | 98219 | 285.7 | 1442 | 1451 | 338.7 |
| C | 3 | 233 | 44653 | 127.55 | 1442 | 1451 | 338.7 |
| D | 1 | 52 | 5023572 | 14800.39 | 1429 | 1393 | 339.3 |
| D | 2 | 250 | 175604 | 513.4 | 1429 | 1393 | 339.3 |
| D | 8 | 195 | 164148 | 479.64 | 1429 | 1393 | 339.3 |
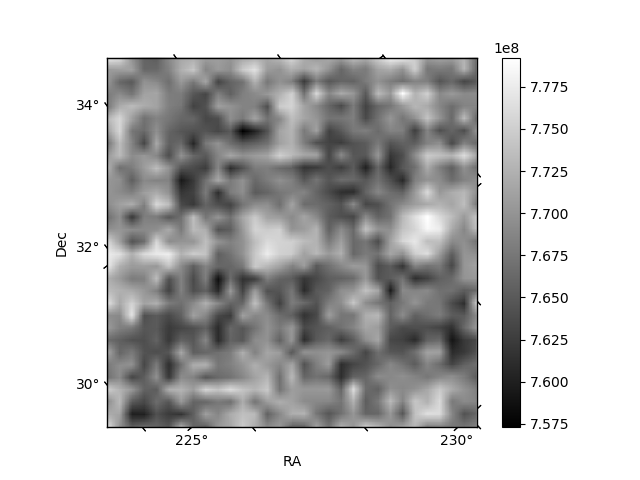
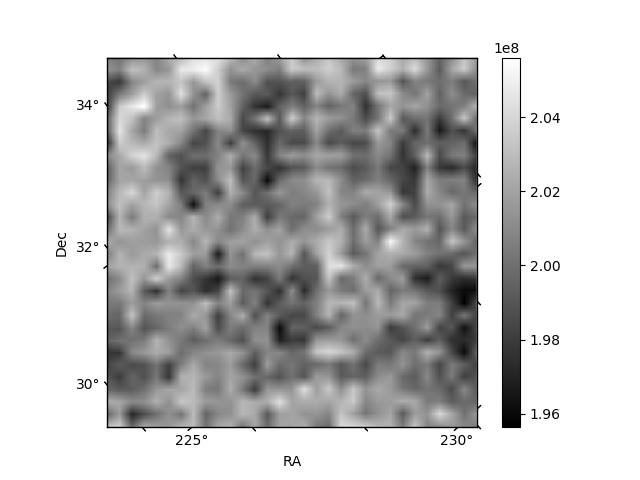
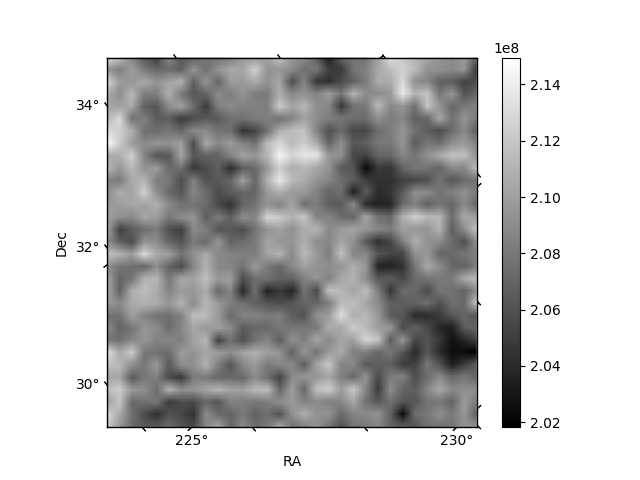
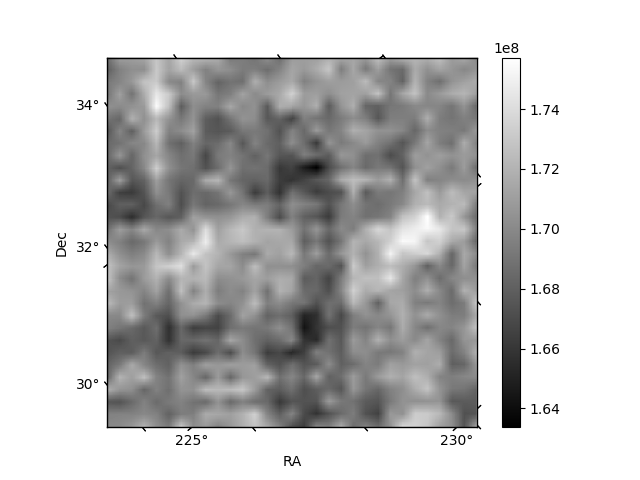
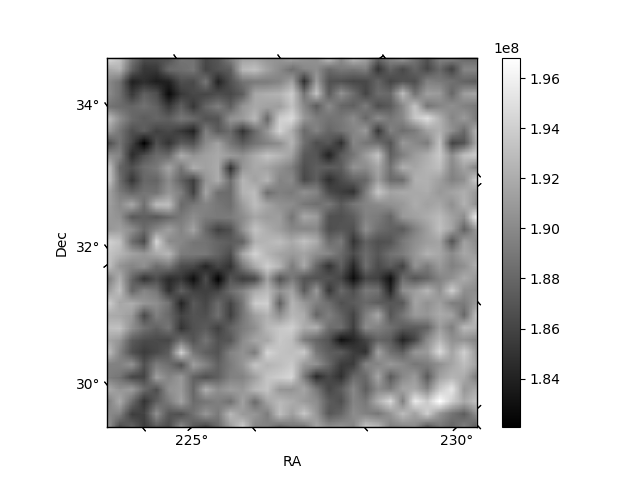
Histogram calculated using DETX and DETY for each event in the final _common_clean file
| Quadrant A | 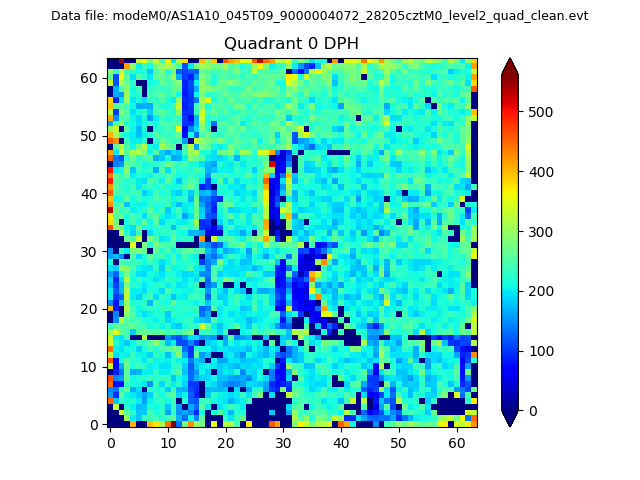 |
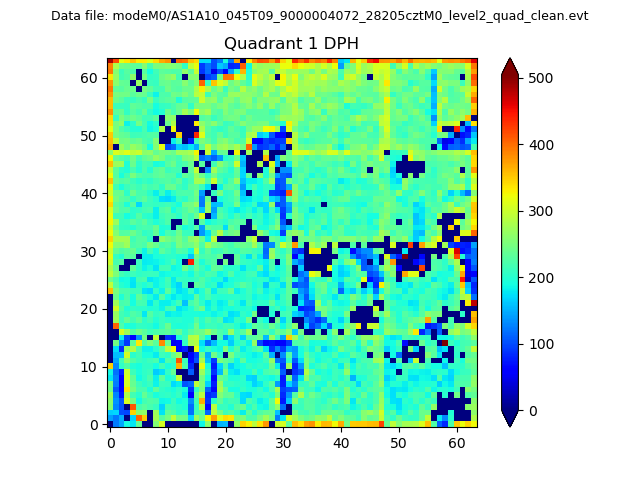 |
Quadrant B |
|---|---|---|---|
| Quadrant D |  |
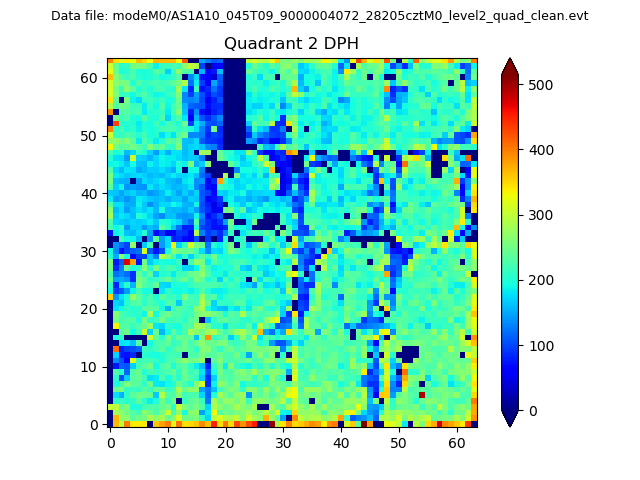 |
Quadrant C |
| Plot type | Count rate plots | Images |
|---|---|---|
| Comparison with Poisson distribution Blue bars denote a histogram of data divided into 1 sec bins. Red curve is a Poisson curve with rate = median count rate of data. |
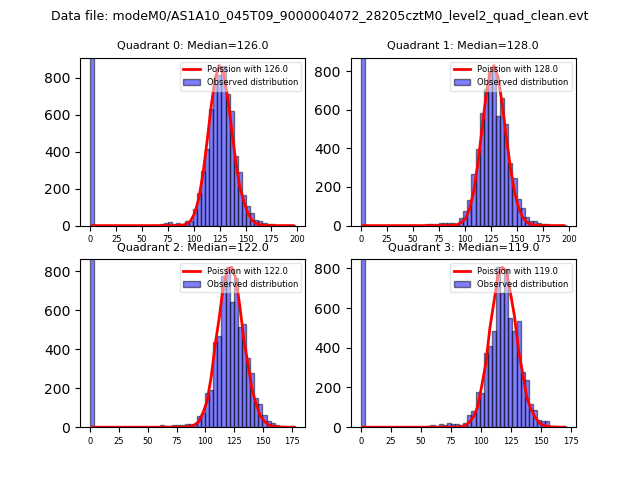 |
 |
| Quadrant-wise count rates Data is divided into 100 sec bins |
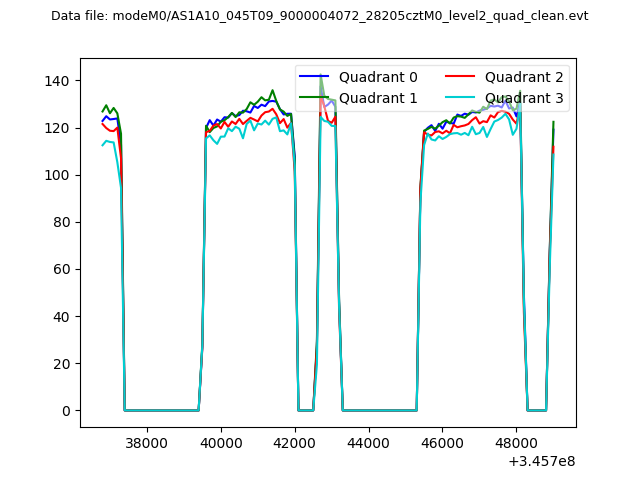 |
|
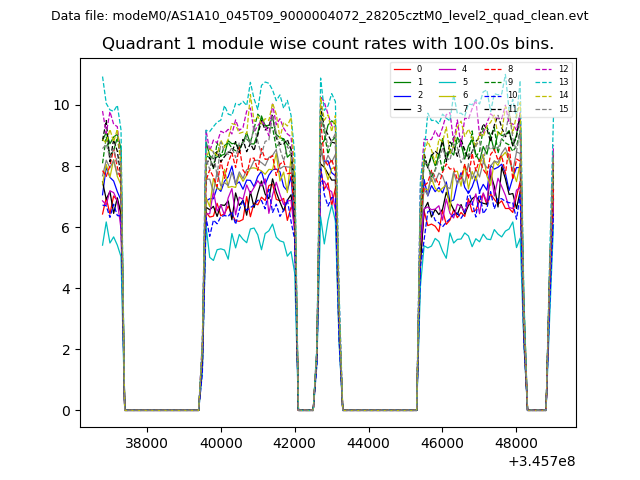
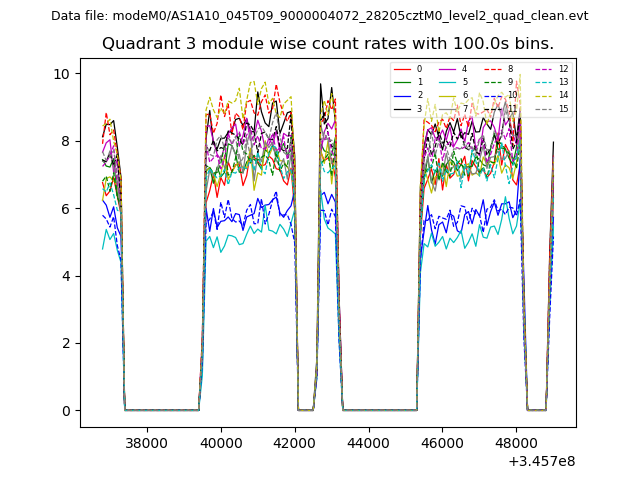
| Module-wise count rates for Quadrant A Data is divided into 100 sec bins |
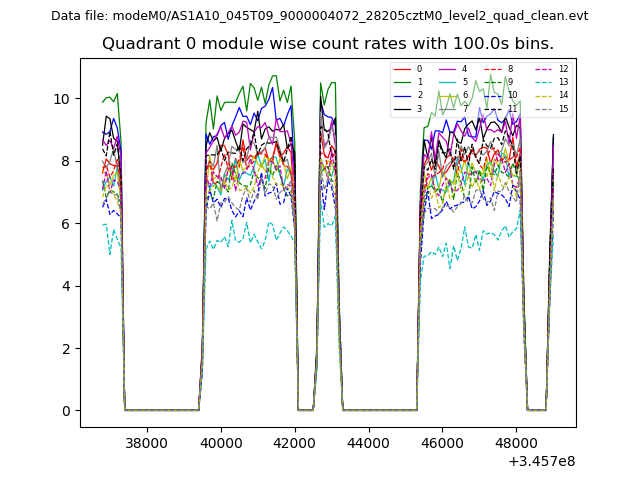 |
 |
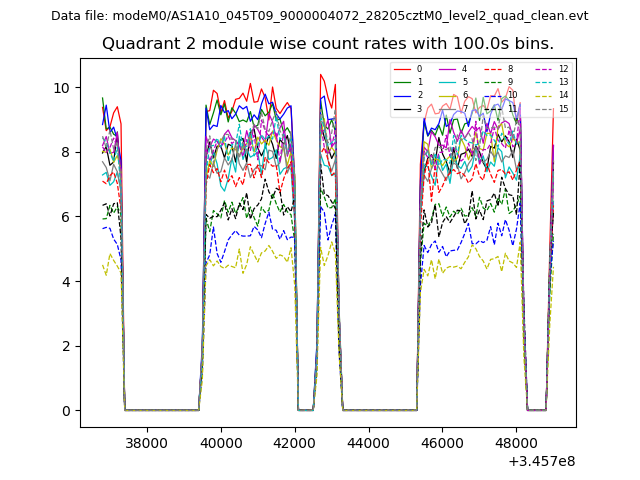
| Module-wise count rates for Quadrant B Data is divided into 100 sec bins |
 |
 |
| Module-wise count rates for Quadrant C Data is divided into 100 sec bins |
 |
 |
| Module-wise count rates for Quadrant D Data is divided into 100 sec bins |
 |
 |
| Parameter | Plot |
|---|---|
| CZT HV Monitor | 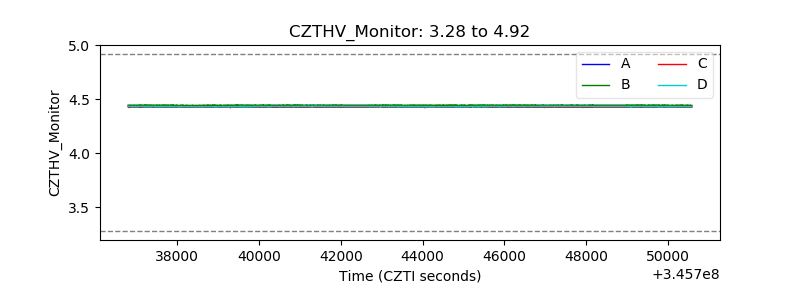 |
| D_VDD | 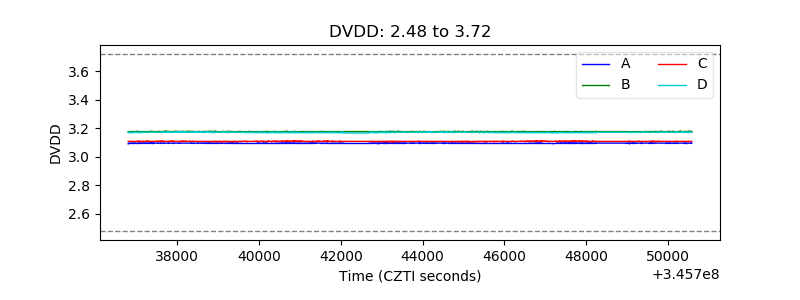 |
| Temperature 1 | 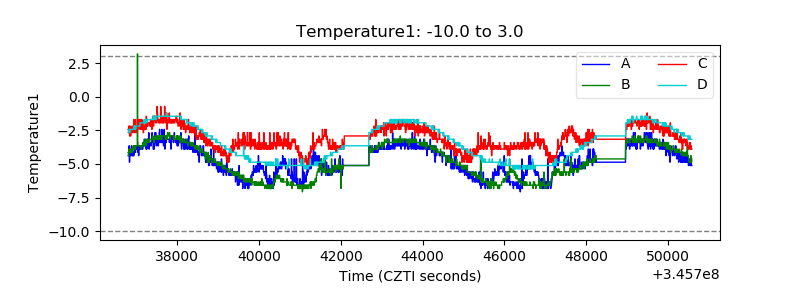 |
| Veto HV Monitor |  |
| Veto LLD | 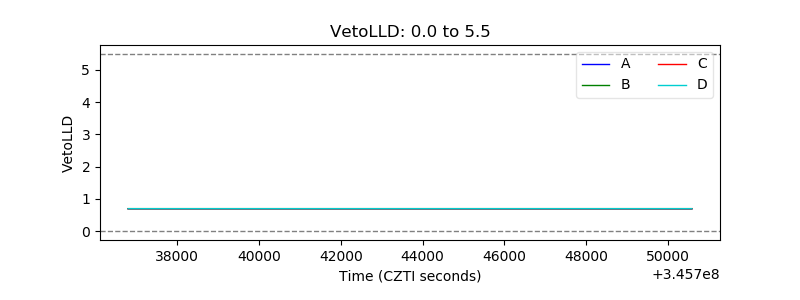 |
| Alpha Counter | 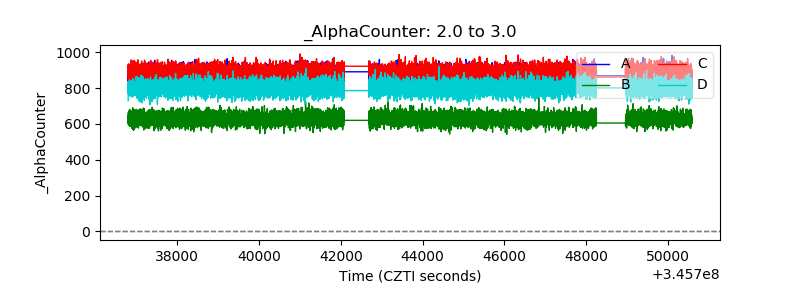 |
| _CPM_Rate | 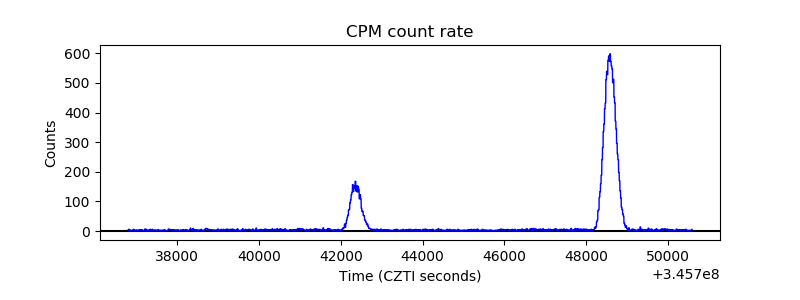 |
| CZT Counter |  |
| +2.5 Volts monitor |  |
| +5 Volts monitor |  |
| _ROLL_ROT | 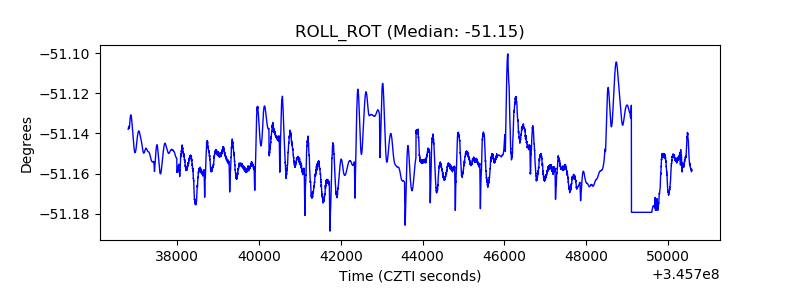 |
| _Roll_DEC | 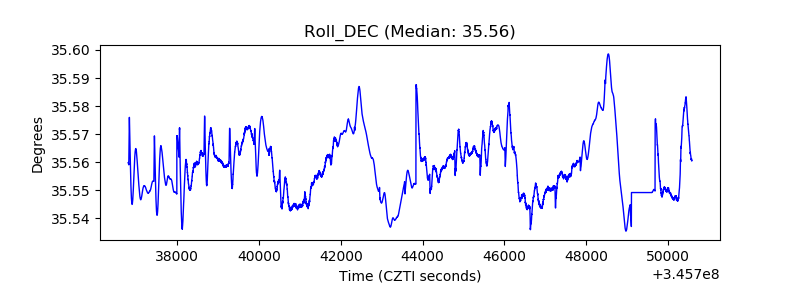 |
| _Roll_RA | 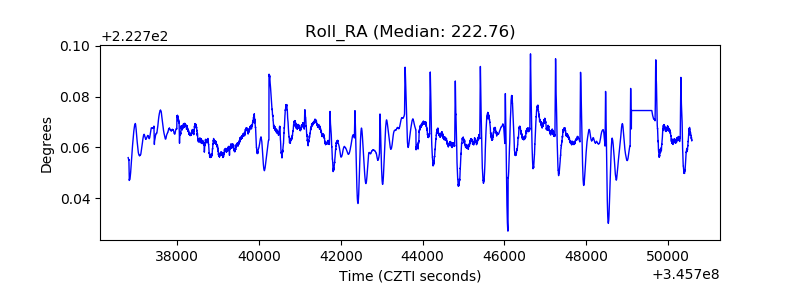 |
| Veto Counter | 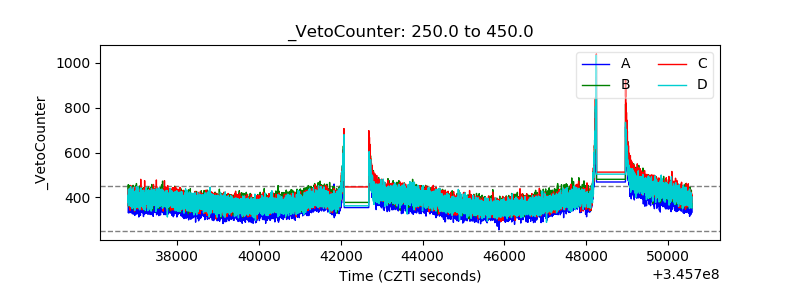 |