| Param | Original file | Final file |
|---|---|---|
| Filename | modeM0/AS1A10_045T09_9000004072_28206cztM0_level2.evt | modeM0/AS1A10_045T09_9000004072_28206cztM0_level2_quad_clean.evt |
| Size (bytes) | 514,843,200 | 68,397,120 |
| Size | 491.0 MB | 65.2 MB |
| Events in quadrant A | 3,352,054 | 405,518 |
| Events in quadrant B | 3,351,394 | 410,198 |
| Events in quadrant C | 3,364,009 | 394,605 |
| Events in quadrant D | 5,066,980 | 390,353 |
| Mode M0 | |||
|---|---|---|---|
| Quadrant | BADHDUFLAG | Total packets | Discarded packets |
| A | 0 | 14324 | 0 |
| B | 0 | 14271 | 0 |
| C | 0 | 14235 | 0 |
| D | 0 | 19774 | 0 |
| Mode M9 | |||
|---|---|---|---|
| Quadrant | BADHDUFLAG | Total packets | Discarded packets |
| A | 0 | 9 | 0 |
| B | 0 | 10 | 0 |
| C | 0 | 10 | 0 |
| D | 0 | 10 | 0 |
| Quadrant | Total seconds | Saturated seconds | Saturation percentage |
|---|---|---|---|
| A | 6743 | 64 | 0.949132% |
| B | 6742 | 73 | 1.082765% |
| C | 6742 | 119 | 1.765055% |
| D | 6742 | 282 | 4.182735% |
Noise dominated data is calculated using 1-second bins in cleaned event files. If a bin has >2000 counts, and if more than 50% of those come from <1% of pixels, then it is considered to be noise-dominated and hence unusable.
| Quadrant | # 1 sec bins | Bins with >0 counts | Bins with >2000 counts | High rate bins dominated by noise | Noise dominated (total time) | Noise dominated (detector-on time) | Marked lightcurve |
|---|---|---|---|---|---|---|---|
| A | 7653 | 6743 | 2 | 2 | 0.03% | 0.03% | 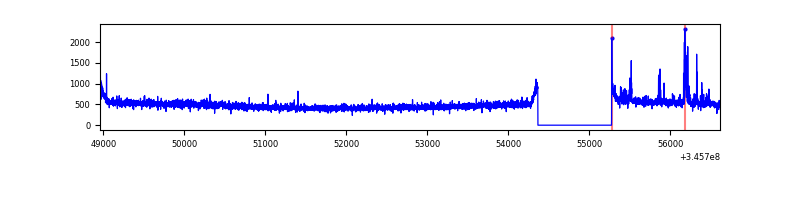 |
| B | 7652 | 6742 | 2 | 2 | 0.03% | 0.03% | 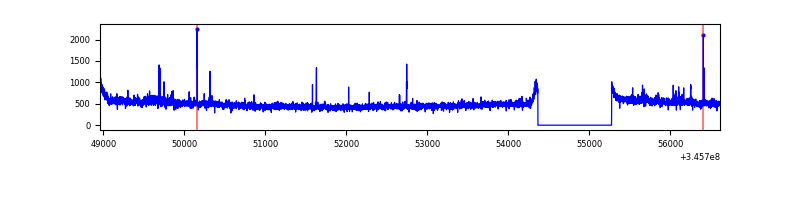 |
| C | 7652 | 6742 | 1 | 1 | 0.01% | 0.01% | 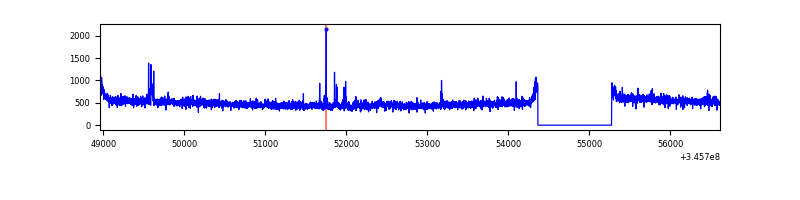 |
| D | 7652 | 6742 | 148 | 148 | 1.93% | 2.20% | 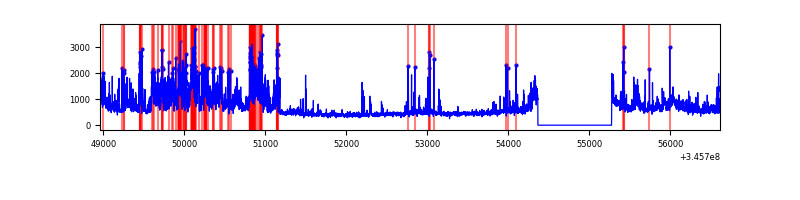 |
Top three noisy pixels from each quadrant. If the there are fewer than three noisy pixels in the level2.evt file, extra rows are filled as -1
| Pixel properties | Quadrant properties | ||||||
|---|---|---|---|---|---|---|---|
| Quadrant | DetID | PixID | Counts | Sigma | Mean | Median | Sigma |
| A | 12 | 16 | 79325 | 459.95 | 841 | 823 | 170.7 |
| A | 12 | 194 | 18638 | 104.38 | 841 | 823 | 170.7 |
| A | 13 | 254 | 10014 | 53.85 | 841 | 823 | 170.7 |
| B | 0 | 183 | 36210 | 221.21 | 831 | 810 | 160.0 |
| B | 12 | 111 | 20233 | 121.37 | 831 | 810 | 160.0 |
| B | 0 | 230 | 19146 | 114.58 | 831 | 810 | 160.0 |
| C | 14 | 238 | 131333 | 686.07 | 810 | 813 | 190.2 |
| C | 2 | 16 | 25387 | 129.17 | 810 | 813 | 190.2 |
| C | 15 | 208 | 24765 | 125.9 | 810 | 813 | 190.2 |
| D | 1 | 52 | 1579412 | 8162.94 | 811 | 789 | 193.4 |
| D | 2 | 250 | 125187 | 643.25 | 811 | 789 | 193.4 |
| D | 8 | 195 | 105980 | 543.93 | 811 | 789 | 193.4 |
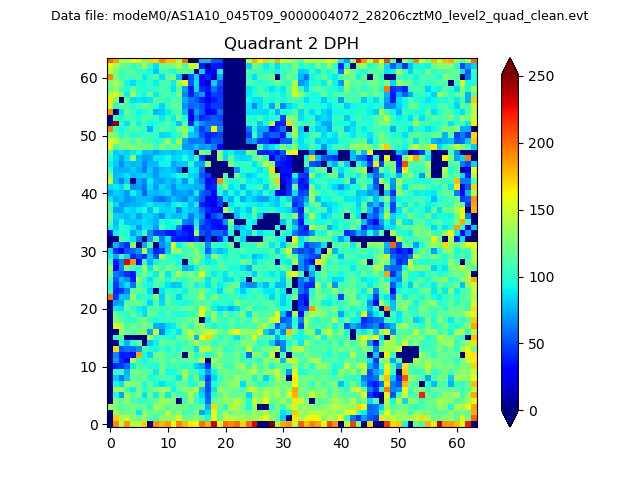
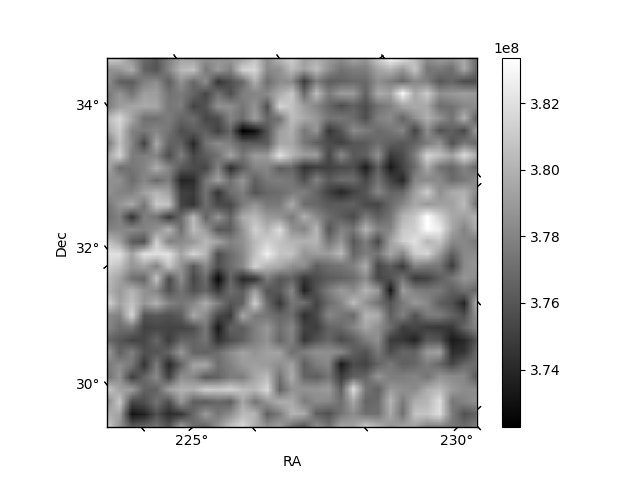
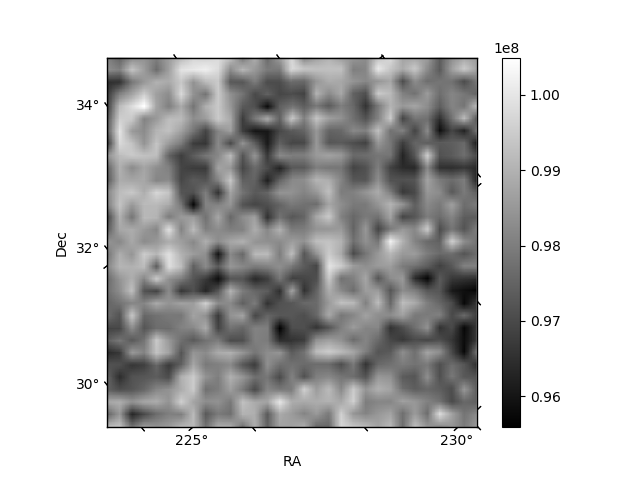
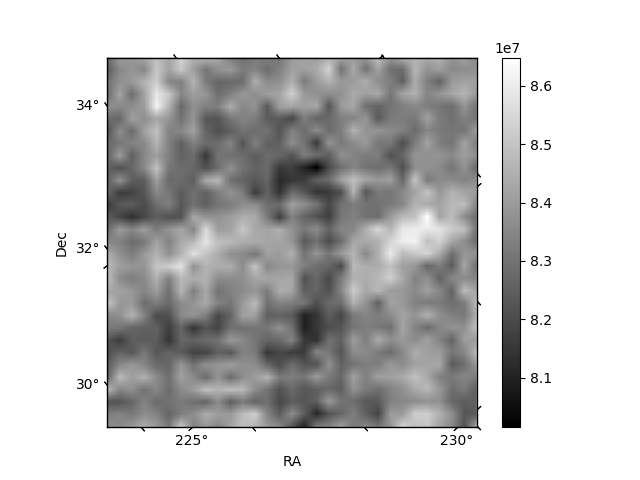
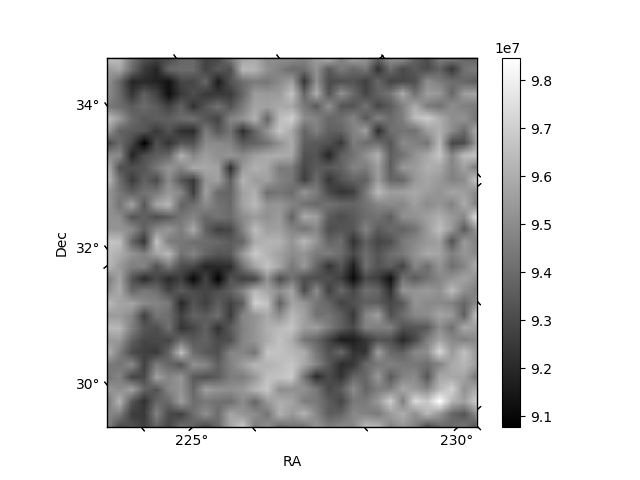
Histogram calculated using DETX and DETY for each event in the final _common_clean file
| Quadrant A | 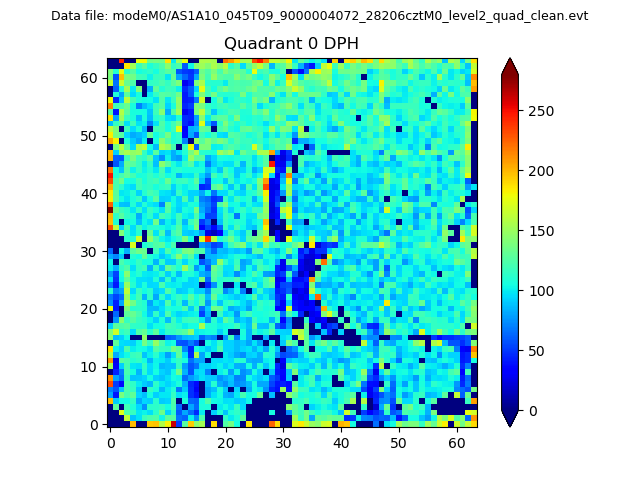 |
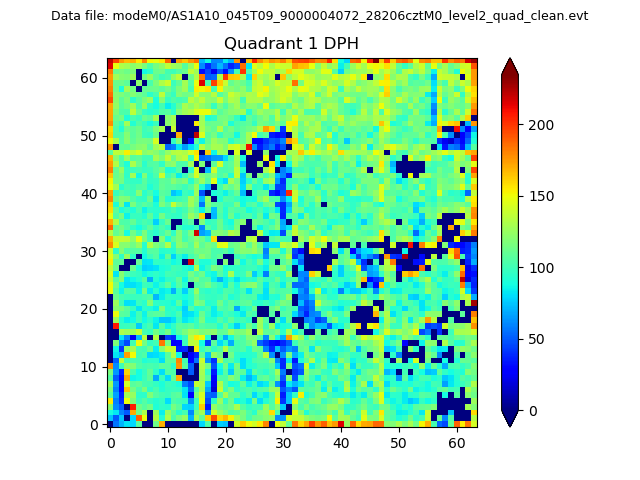 |
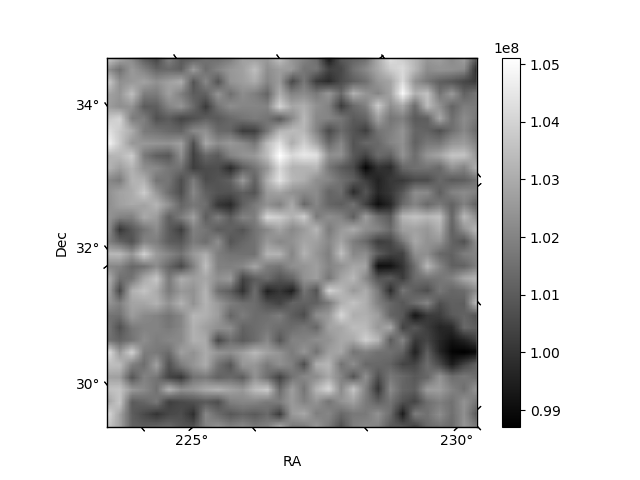
Quadrant B |
|---|---|---|---|
| Quadrant D | 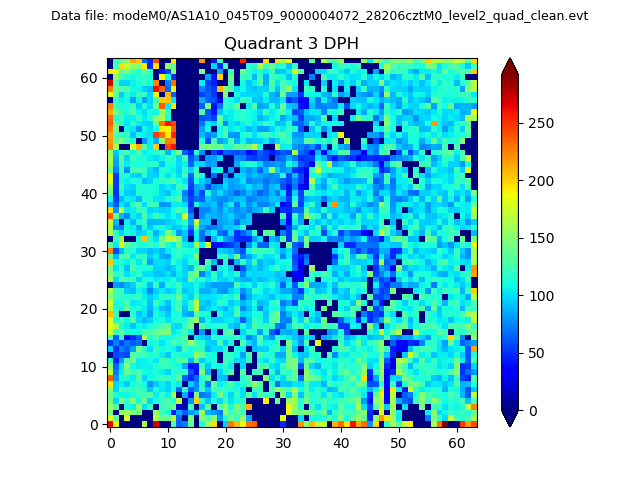 |
 |
Quadrant C |
| Plot type | Count rate plots | Images |
|---|---|---|
| Comparison with Poisson distribution Blue bars denote a histogram of data divided into 1 sec bins. Red curve is a Poisson curve with rate = median count rate of data. |
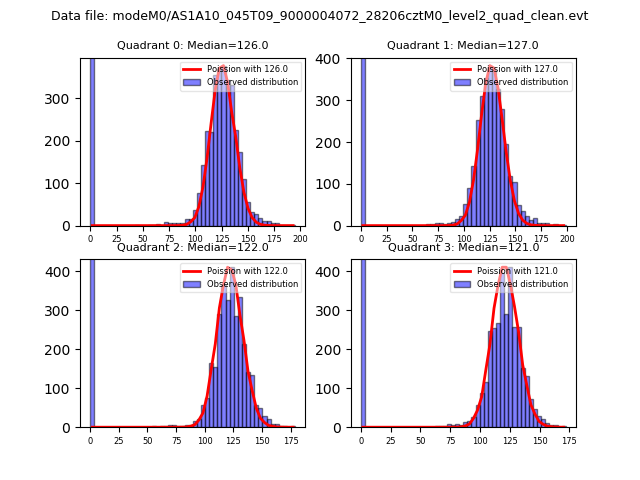 |
 |
| Quadrant-wise count rates Data is divided into 100 sec bins |
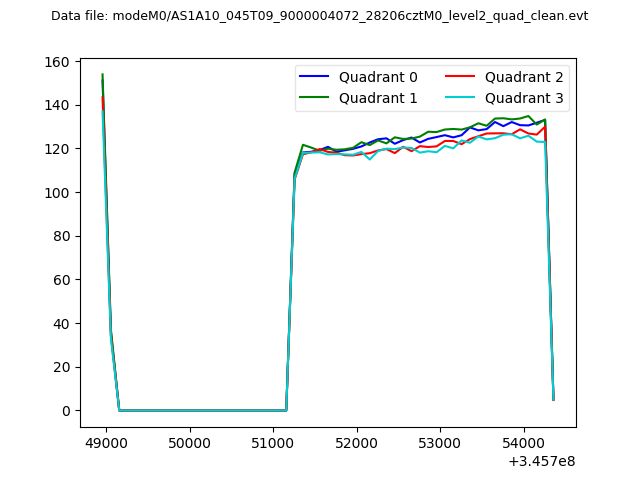 |
|
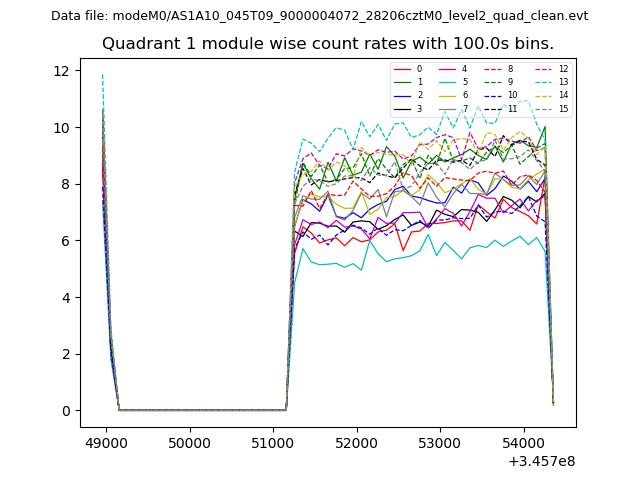
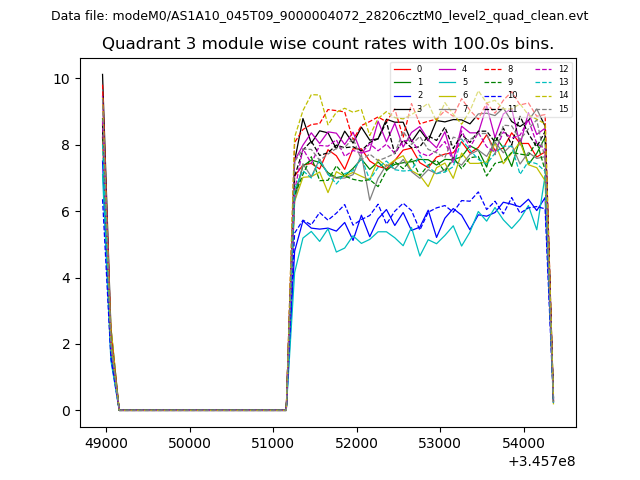
| Module-wise count rates for Quadrant A Data is divided into 100 sec bins |
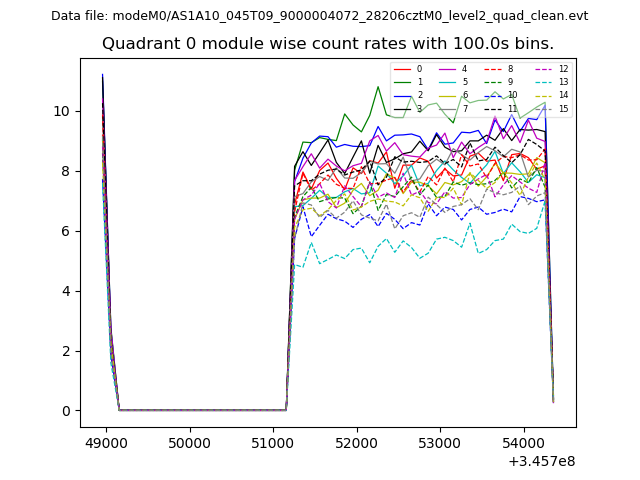 |
 |
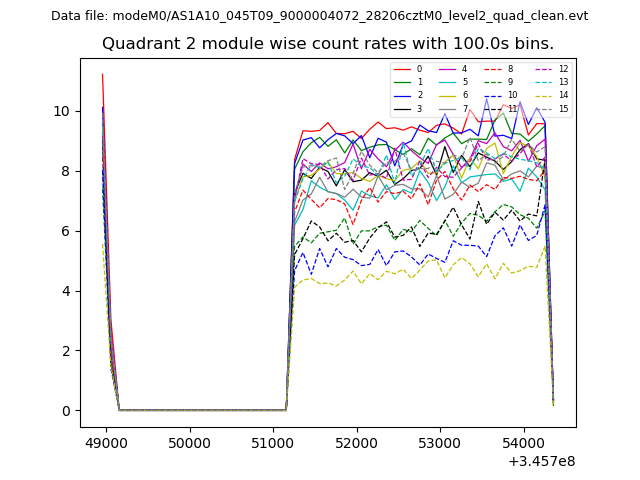
| Module-wise count rates for Quadrant B Data is divided into 100 sec bins |
 |
 |
| Module-wise count rates for Quadrant C Data is divided into 100 sec bins |
 |
 |
| Module-wise count rates for Quadrant D Data is divided into 100 sec bins |
 |
 |
| Parameter | Plot |
|---|---|
| CZT HV Monitor | 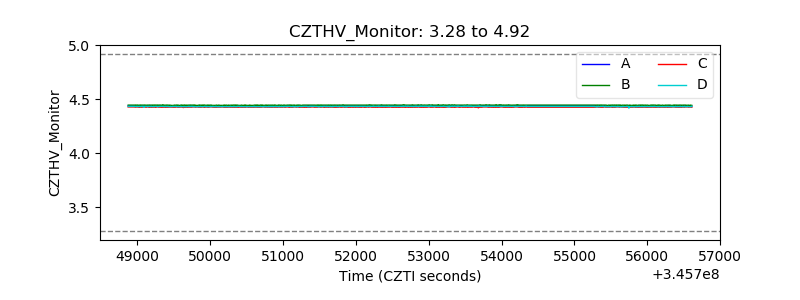 |
| D_VDD | 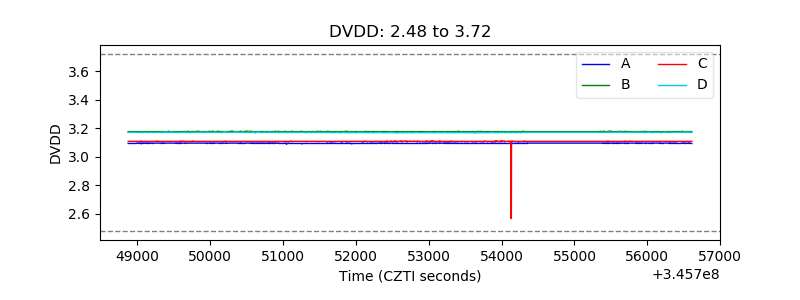 |
| Temperature 1 | 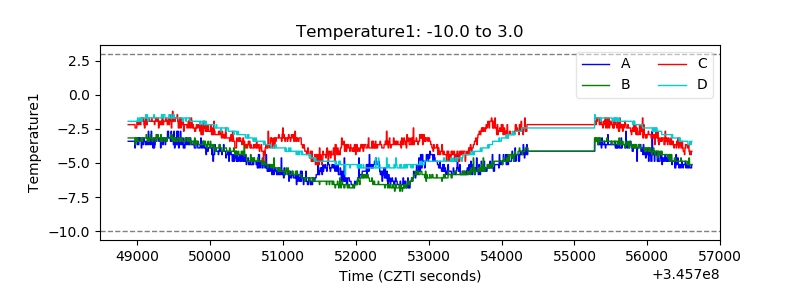 |
| Veto HV Monitor | 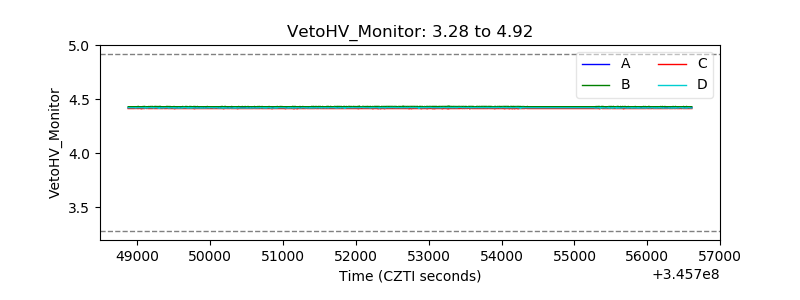 |
| Veto LLD | 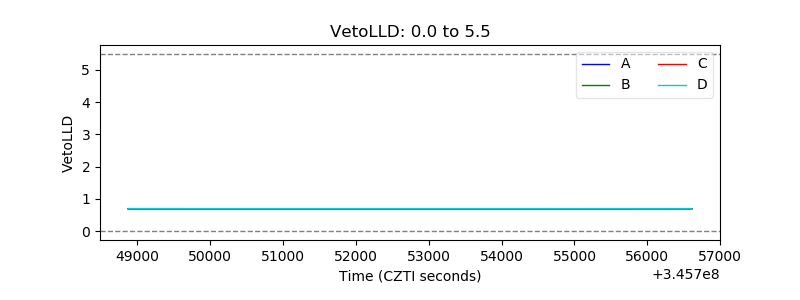 |
| Alpha Counter | 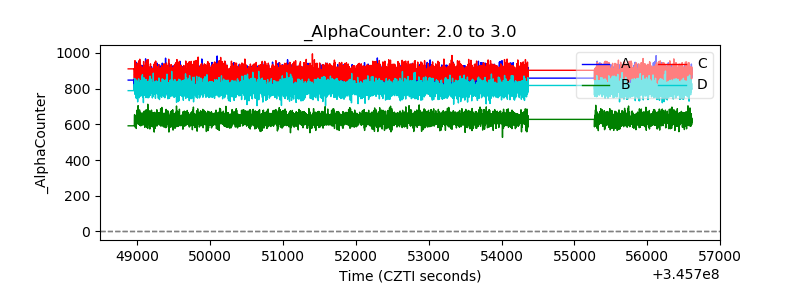 |
| _CPM_Rate | 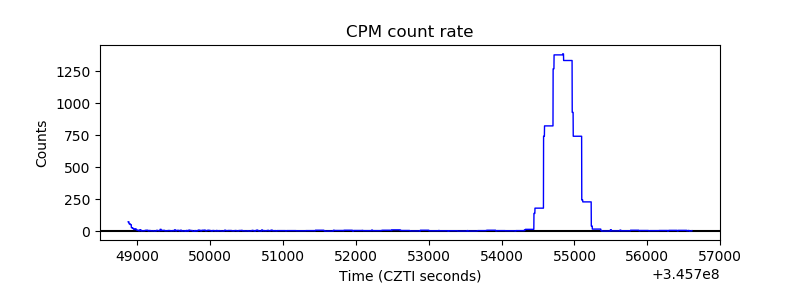 |
| CZT Counter | 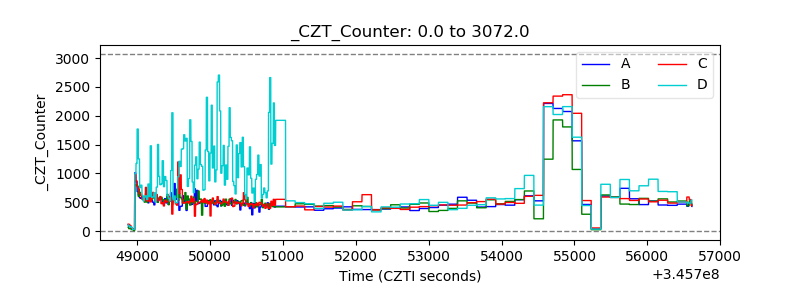 |
| +2.5 Volts monitor |  |
| +5 Volts monitor |  |
| _ROLL_ROT | 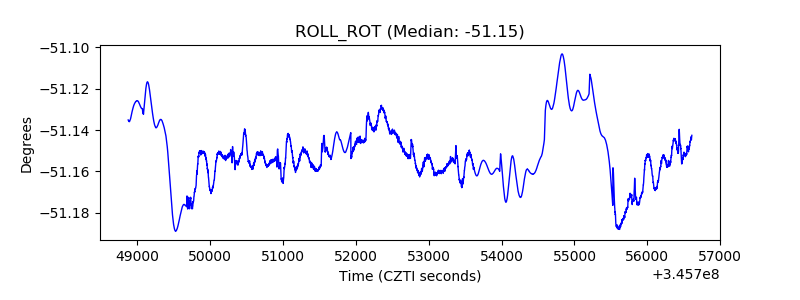 |
| _Roll_DEC | 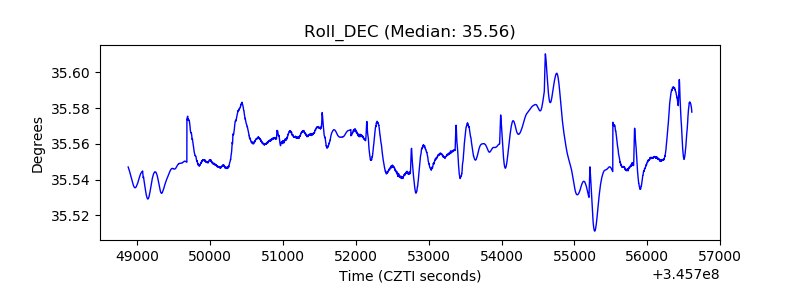 |
| _Roll_RA | 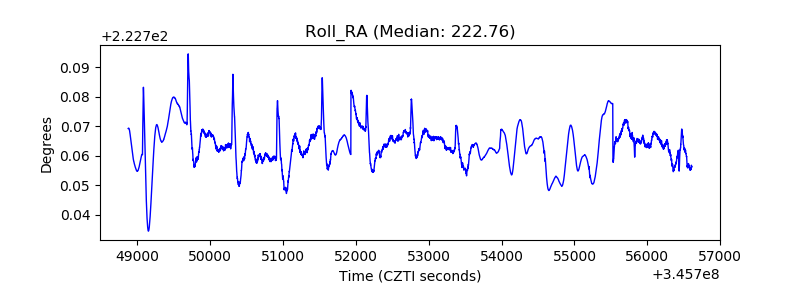 |
| Veto Counter | 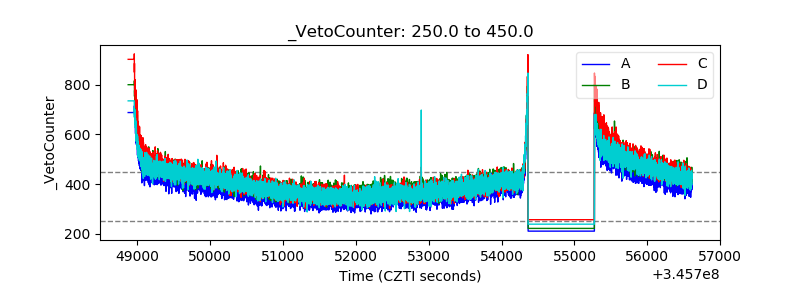 |