| Param | Original file | Final file |
|---|---|---|
| Filename | modeM0/AS1A10_045T09_9000004072_28207cztM0_level2.evt | modeM0/AS1A10_045T09_9000004072_28207cztM0_level2_quad_clean.evt |
| Size (bytes) | 489,179,520 | 71,605,440 |
| Size | 466.5 MB | 68.3 MB |
| Events in quadrant A | 3,363,307 | 431,990 |
| Events in quadrant B | 3,355,224 | 436,395 |
| Events in quadrant C | 3,421,797 | 422,004 |
| Events in quadrant D | 4,223,641 | 414,624 |
| Mode M0 | |||
|---|---|---|---|
| Quadrant | BADHDUFLAG | Total packets | Discarded packets |
| A | 0 | 14368 | 0 |
| B | 0 | 14284 | 0 |
| C | 0 | 14433 | 0 |
| D | 0 | 17084 | 0 |
| Mode M9 | |||
|---|---|---|---|
| Quadrant | BADHDUFLAG | Total packets | Discarded packets |
| A | 0 | 15 | 0 |
| B | 0 | 16 | 0 |
| C | 0 | 16 | 0 |
| D | 0 | 16 | 0 |
| Quadrant | Total seconds | Saturated seconds | Saturation percentage |
|---|---|---|---|
| A | 6632 | 36 | 0.542823% |
| B | 6632 | 63 | 0.949940% |
| C | 6632 | 97 | 1.462606% |
| D | 6632 | 148 | 2.231604% |
Noise dominated data is calculated using 1-second bins in cleaned event files. If a bin has >2000 counts, and if more than 50% of those come from <1% of pixels, then it is considered to be noise-dominated and hence unusable.
| Quadrant | # 1 sec bins | Bins with >0 counts | Bins with >2000 counts | High rate bins dominated by noise | Noise dominated (total time) | Noise dominated (detector-on time) | Marked lightcurve |
|---|---|---|---|---|---|---|---|
| A | 7702 | 6633 | 2 | 2 | 0.03% | 0.03% | 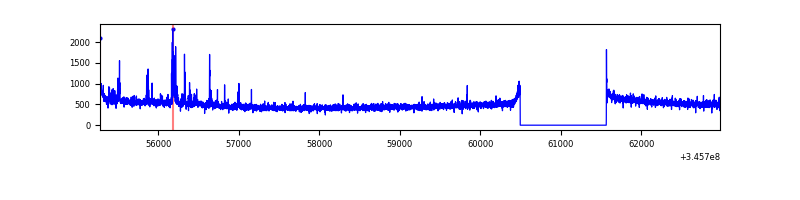 |
| B | 7702 | 6632 | 2 | 2 | 0.03% | 0.03% | 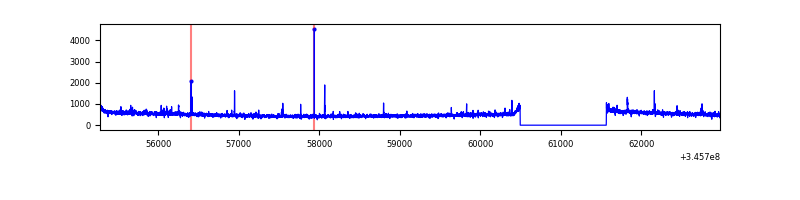 |
| C | 7702 | 6633 | 0 | 0 | 0.00% | 0.00% | 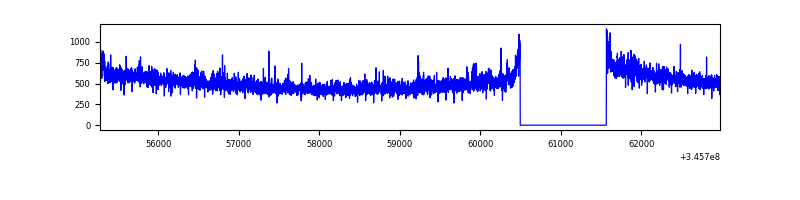 |
| D | 7702 | 6632 | 74 | 74 | 0.96% | 1.12% | 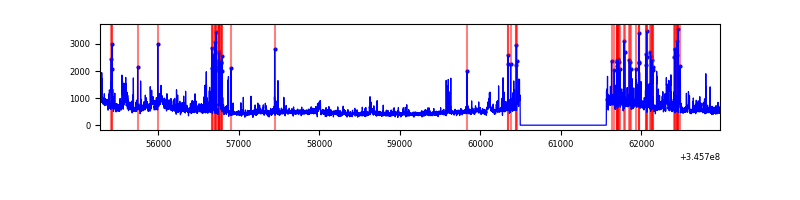 |
Top three noisy pixels from each quadrant. If the there are fewer than three noisy pixels in the level2.evt file, extra rows are filled as -1
| Pixel properties | Quadrant properties | ||||||
|---|---|---|---|---|---|---|---|
| Quadrant | DetID | PixID | Counts | Sigma | Mean | Median | Sigma |
| A | 12 | 16 | 94898 | 556.45 | 840 | 823 | 169.1 |
| A | 12 | 194 | 21164 | 120.32 | 840 | 823 | 169.1 |
| A | 13 | 254 | 9751 | 52.81 | 840 | 823 | 169.1 |
| B | 0 | 183 | 30460 | 187.18 | 832 | 811 | 158.4 |
| B | 12 | 111 | 19932 | 120.71 | 832 | 811 | 158.4 |
| B | 11 | 111 | 18215 | 109.87 | 832 | 811 | 158.4 |
| C | 14 | 238 | 130692 | 688.96 | 812 | 817 | 188.5 |
| C | 3 | 233 | 109640 | 577.29 | 812 | 817 | 188.5 |
| C | 15 | 208 | 8410 | 40.28 | 812 | 817 | 188.5 |
| D | 1 | 52 | 674294 | 3496.12 | 812 | 789 | 192.6 |
| D | 8 | 195 | 197942 | 1023.41 | 812 | 789 | 192.6 |
| D | 2 | 250 | 76059 | 390.72 | 812 | 789 | 192.6 |
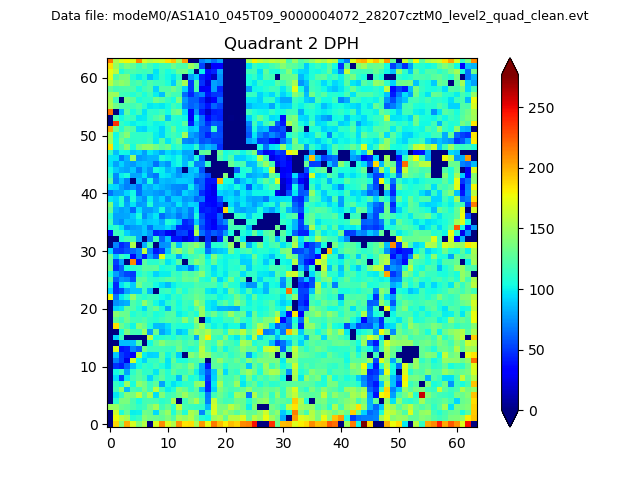
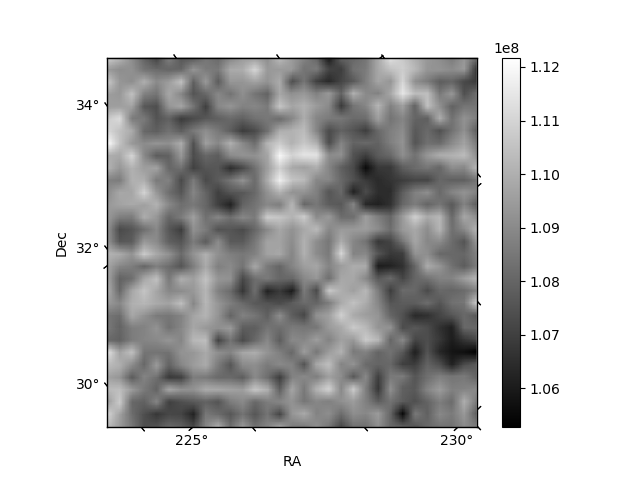
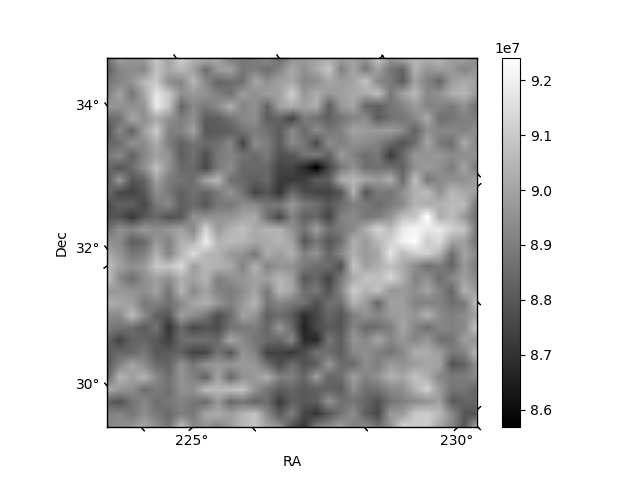
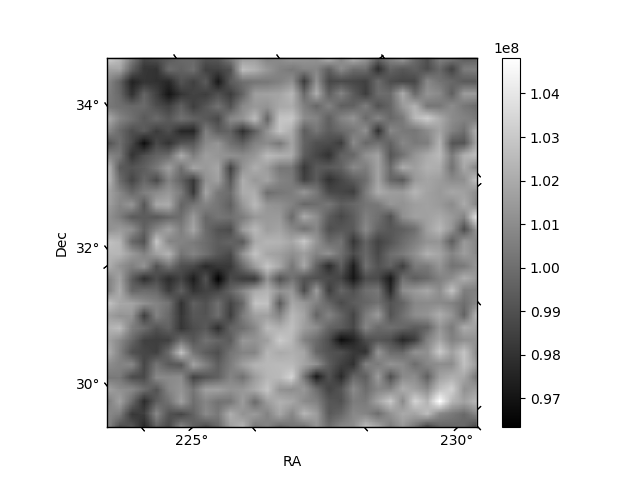
Histogram calculated using DETX and DETY for each event in the final _common_clean file
| Quadrant A |  |
 |
Quadrant B |
|---|---|---|---|
| Quadrant D |  |
 |
Quadrant C |
| Plot type | Count rate plots | Images |
|---|---|---|
| Comparison with Poisson distribution Blue bars denote a histogram of data divided into 1 sec bins. Red curve is a Poisson curve with rate = median count rate of data. |
 |
 |
| Quadrant-wise count rates Data is divided into 100 sec bins |
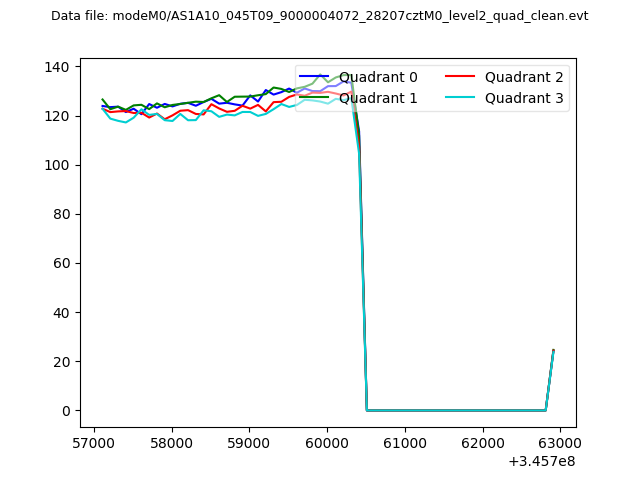 |
|
| Module-wise count rates for Quadrant A Data is divided into 100 sec bins |
 |
 |
| Module-wise count rates for Quadrant B Data is divided into 100 sec bins |
 |
 |
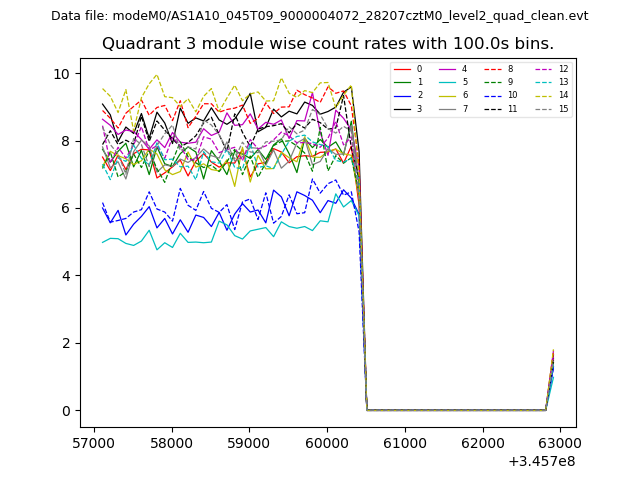
| Module-wise count rates for Quadrant C Data is divided into 100 sec bins |
 |
 |
| Module-wise count rates for Quadrant D Data is divided into 100 sec bins |
 |
 |
| Parameter | Plot |
|---|---|
| CZT HV Monitor |  |
| D_VDD | 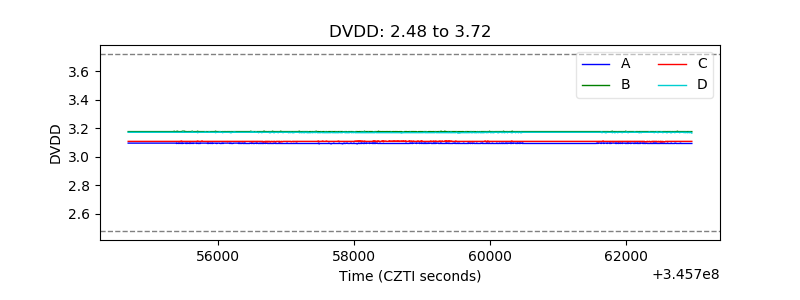 |
| Temperature 1 | 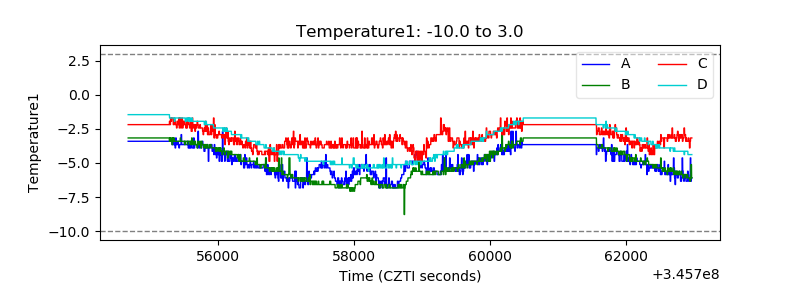 |
| Veto HV Monitor | 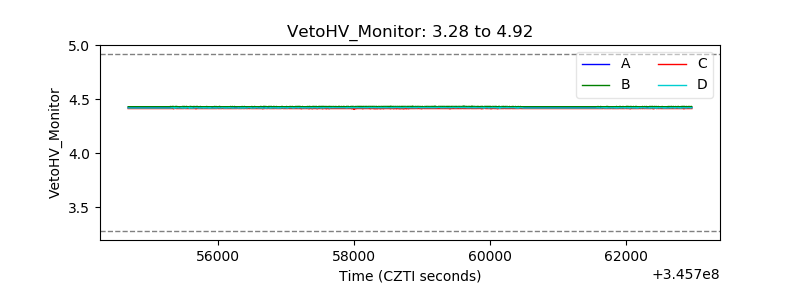 |
| Veto LLD | 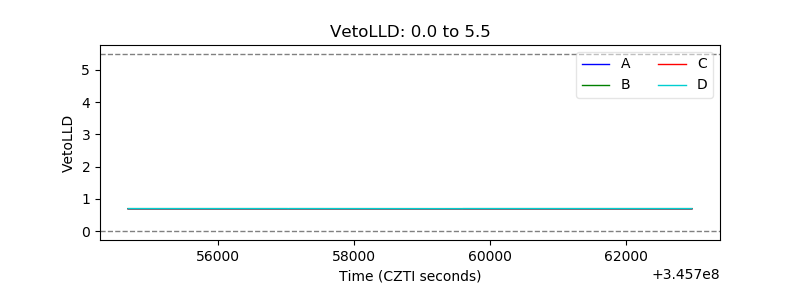 |
| Alpha Counter | 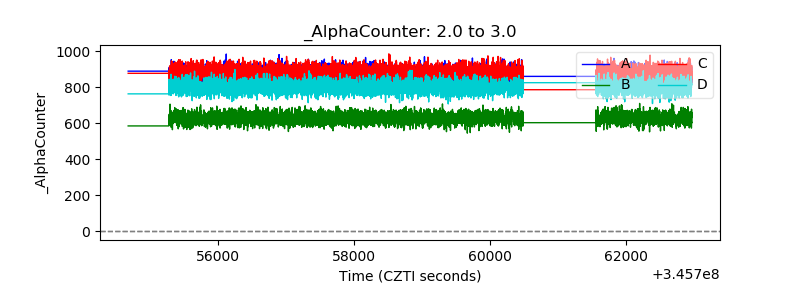 |
| _CPM_Rate | 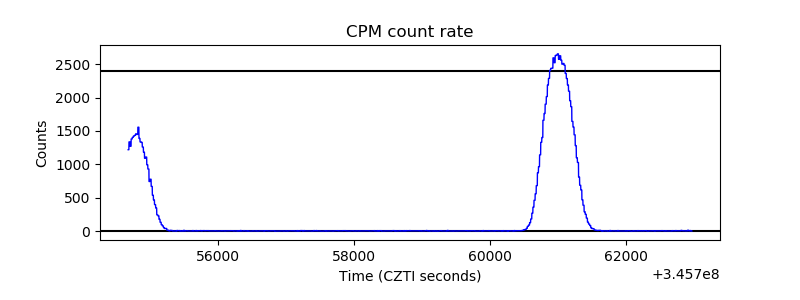 |
| CZT Counter | 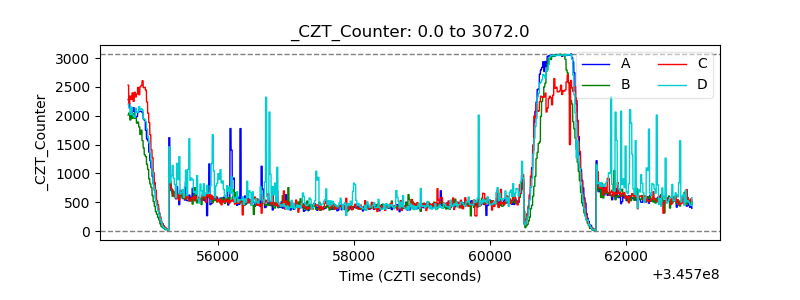 |
| +2.5 Volts monitor |  |
| +5 Volts monitor |  |
| _ROLL_ROT | 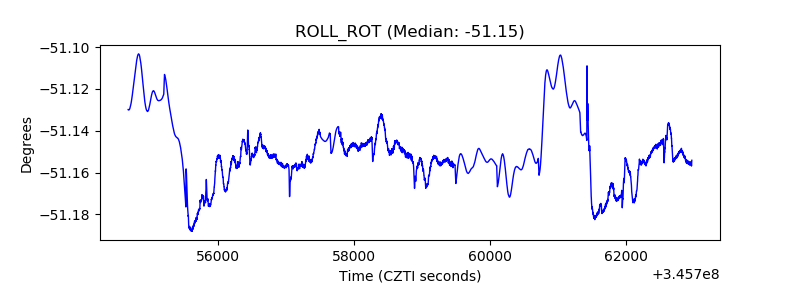 |
| _Roll_DEC | 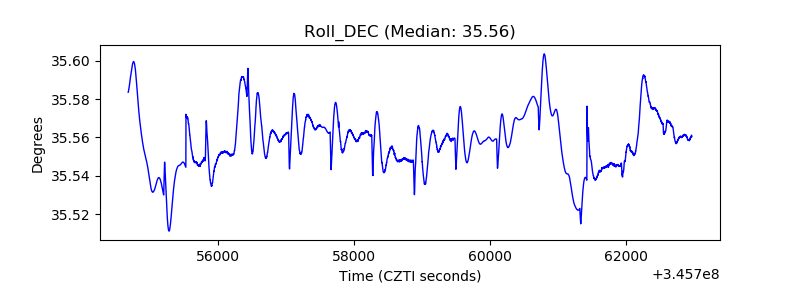 |
| _Roll_RA | 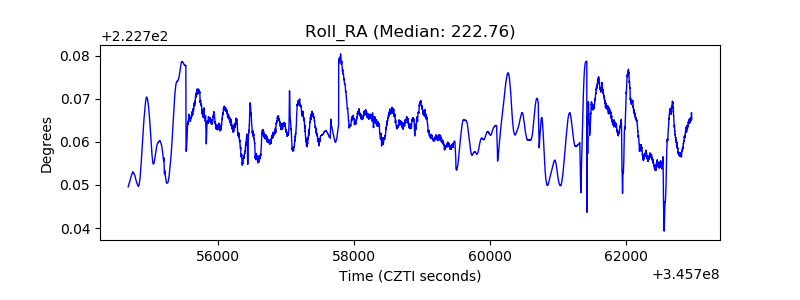 |
| Veto Counter | 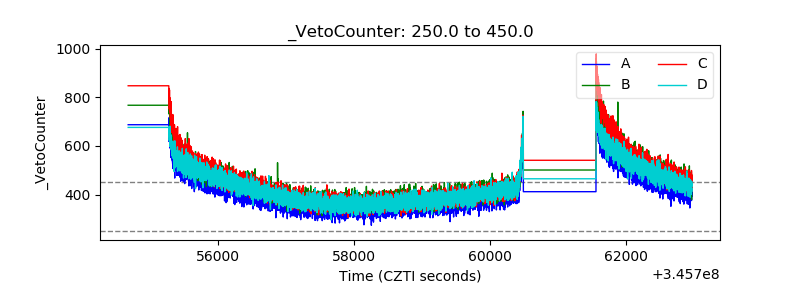 |