| Param | Original file | Final file |
|---|---|---|
| Filename | modeM0/AS1A10_045T09_9000004072_28209cztM0_level2.evt | modeM0/AS1A10_045T09_9000004072_28209cztM0_level2_quad_clean.evt |
| Size (bytes) | 512,493,120 | 88,427,520 |
| Size | 488.8 MB | 84.3 MB |
| Events in quadrant A | 3,342,290 | 560,773 |
| Events in quadrant B | 3,407,462 | 572,296 |
| Events in quadrant C | 3,486,617 | 551,871 |
| Events in quadrant D | 4,836,115 | 531,938 |
| Mode M0 | |||
|---|---|---|---|
| Quadrant | BADHDUFLAG | Total packets | Discarded packets |
| A | 0 | 14265 | 0 |
| B | 0 | 14469 | 0 |
| C | 0 | 14694 | 0 |
| D | 0 | 18950 | 0 |
| Mode M9 | |||
|---|---|---|---|
| Quadrant | BADHDUFLAG | Total packets | Discarded packets |
| A | 0 | 22 | 0 |
| B | 0 | 22 | 0 |
| C | 0 | 22 | 0 |
| D | 0 | 22 | 0 |
| Quadrant | Total seconds | Saturated seconds | Saturation percentage |
|---|---|---|---|
| A | 6605 | 60 | 0.908403% |
| B | 6605 | 83 | 1.256624% |
| C | 6605 | 129 | 1.953066% |
| D | 6605 | 196 | 2.967449% |
Noise dominated data is calculated using 1-second bins in cleaned event files. If a bin has >2000 counts, and if more than 50% of those come from <1% of pixels, then it is considered to be noise-dominated and hence unusable.
| Quadrant | # 1 sec bins | Bins with >0 counts | Bins with >2000 counts | High rate bins dominated by noise | Noise dominated (total time) | Noise dominated (detector-on time) | Marked lightcurve |
|---|---|---|---|---|---|---|---|
| A | 8855 | 6606 | 0 | 0 | 0.00% | 0.00% | 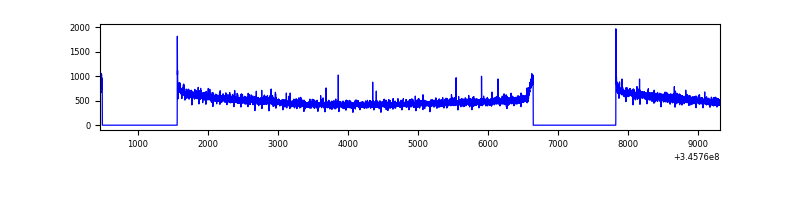 |
| B | 8855 | 6605 | 2 | 2 | 0.02% | 0.03% | 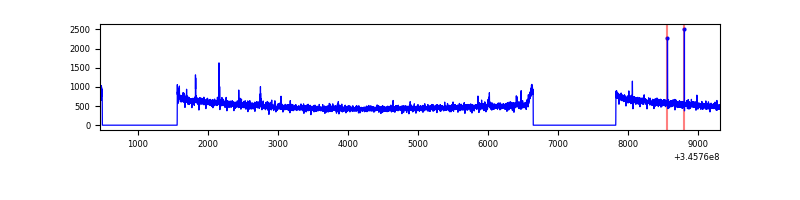 |
| C | 8855 | 6606 | 0 | 0 | 0.00% | 0.00% | 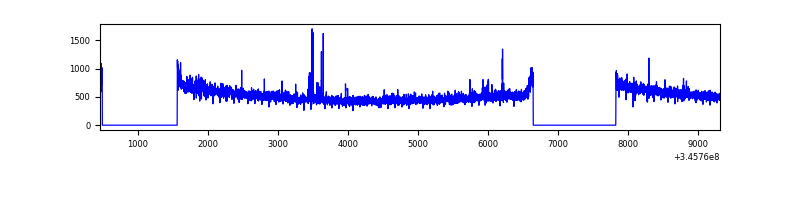 |
| D | 8855 | 6605 | 104 | 104 | 1.17% | 1.57% | 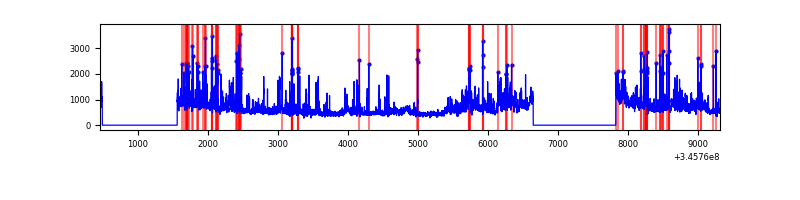 |
Top three noisy pixels from each quadrant. If the there are fewer than three noisy pixels in the level2.evt file, extra rows are filled as -1
| Pixel properties | Quadrant properties | ||||||
|---|---|---|---|---|---|---|---|
| Quadrant | DetID | PixID | Counts | Sigma | Mean | Median | Sigma |
| A | 8 | 192 | 9093 | 47.76 | 861 | 846 | 172.7 |
| A | 13 | 254 | 9046 | 47.49 | 861 | 846 | 172.7 |
| A | 3 | 137 | 8352 | 43.47 | 861 | 846 | 172.7 |
| B | 12 | 111 | 19996 | 118.31 | 858 | 837 | 161.9 |
| B | 11 | 111 | 18442 | 108.72 | 858 | 837 | 161.9 |
| B | 14 | 111 | 17588 | 103.44 | 858 | 837 | 161.9 |
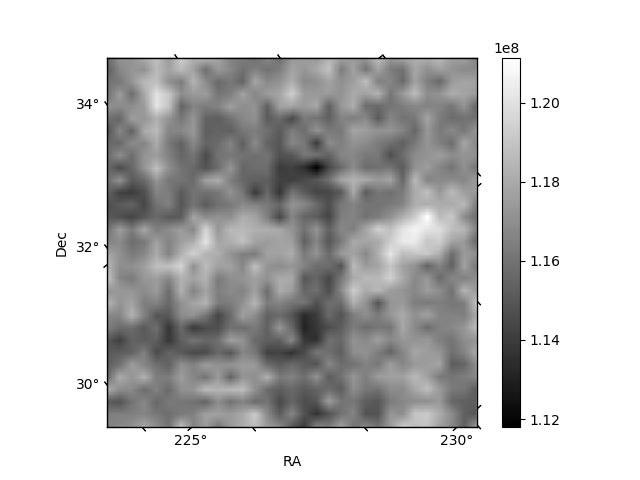
| C | 14 | 238 | 135931 | 697.02 | 834 | 840 | 193.8 |
| C | 3 | 233 | 92716 | 474.04 | 834 | 840 | 193.8 |
| C | 13 | 61 | 5649 | 24.81 | 834 | 840 | 193.8 |
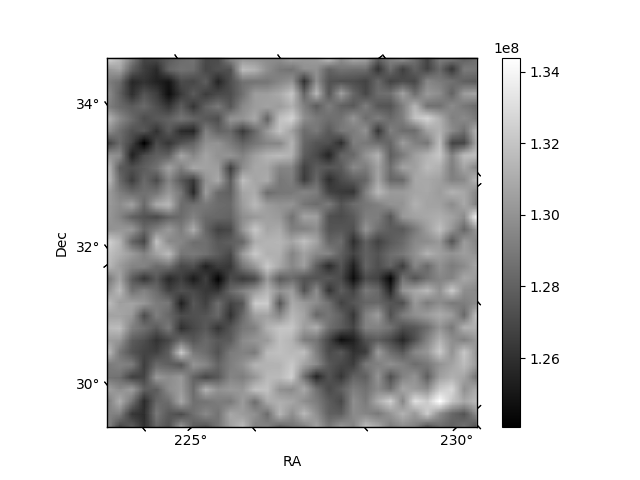
| D | 1 | 52 | 1392720 | 7100.55 | 830 | 807 | 196.0 |
| D | 8 | 195 | 191755 | 974.08 | 830 | 807 | 196.0 |
| D | 12 | 250 | 30601 | 151.99 | 830 | 807 | 196.0 |
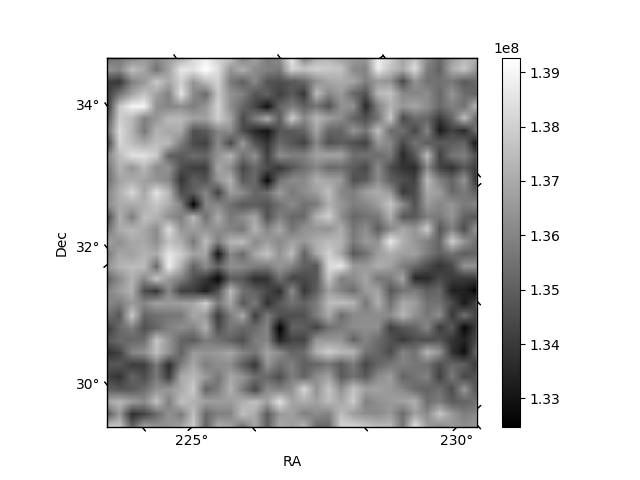
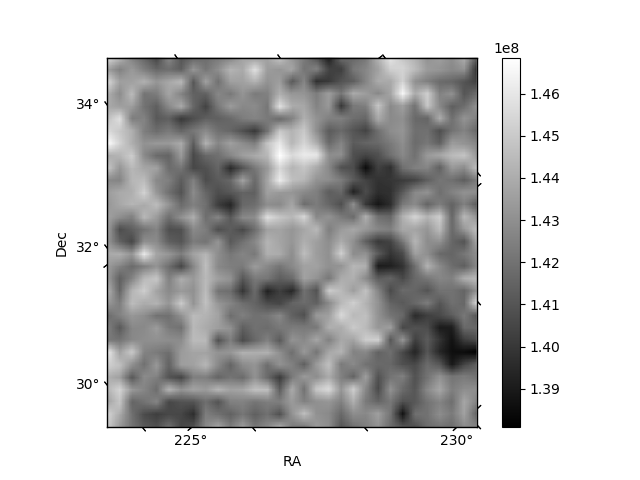
Histogram calculated using DETX and DETY for each event in the final _common_clean file
| Quadrant A |  |
 |
Quadrant B |
|---|---|---|---|
| Quadrant D | 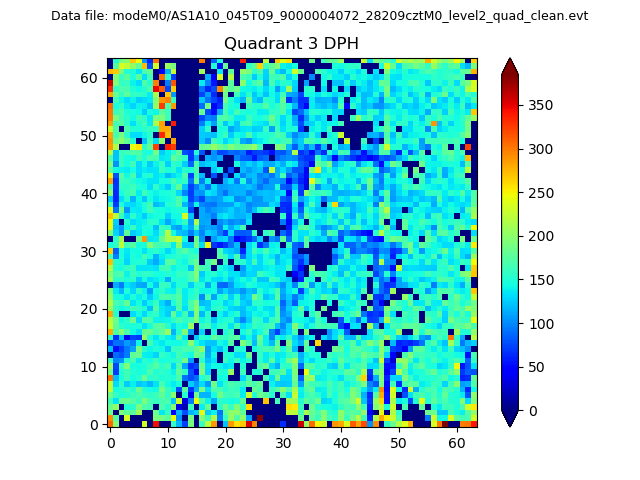 |
 |
Quadrant C |
| Plot type | Count rate plots | Images |
|---|---|---|
| Comparison with Poisson distribution Blue bars denote a histogram of data divided into 1 sec bins. Red curve is a Poisson curve with rate = median count rate of data. |
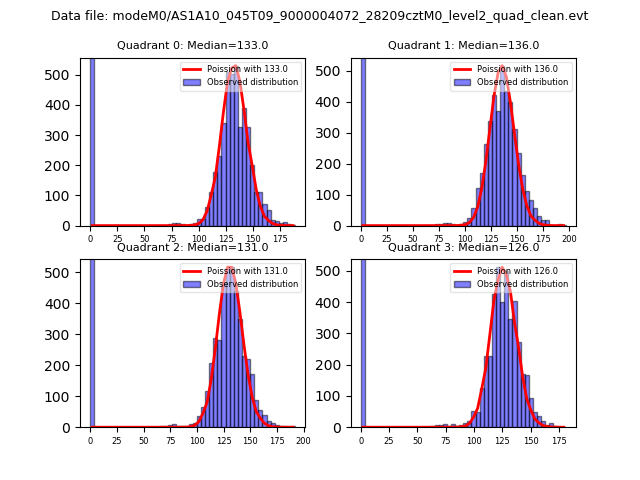 |
 |
| Quadrant-wise count rates Data is divided into 100 sec bins |
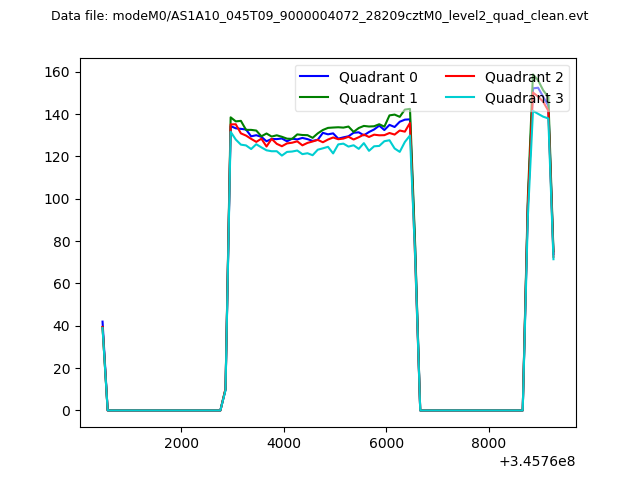 |
|
| Module-wise count rates for Quadrant A Data is divided into 100 sec bins |
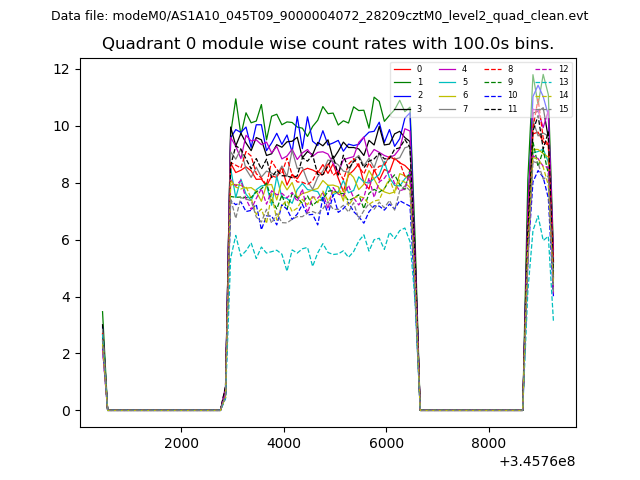 |
 |
| Module-wise count rates for Quadrant B Data is divided into 100 sec bins |
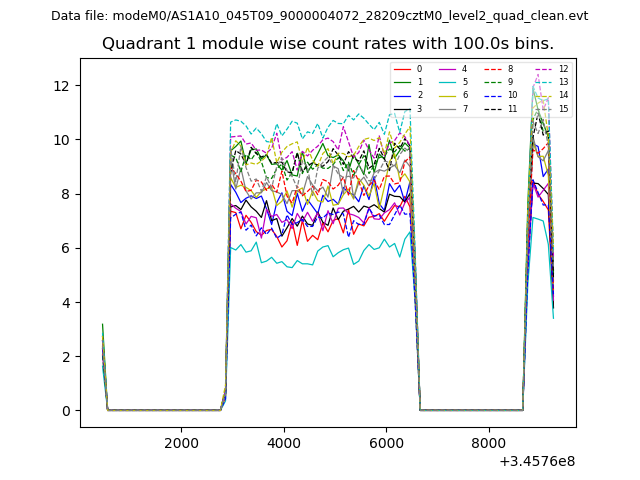 |
 |
| Module-wise count rates for Quadrant C Data is divided into 100 sec bins |
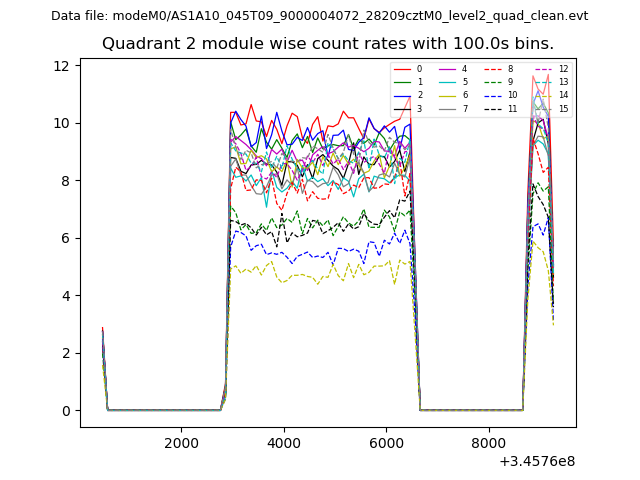 |
 |
| Module-wise count rates for Quadrant D Data is divided into 100 sec bins |
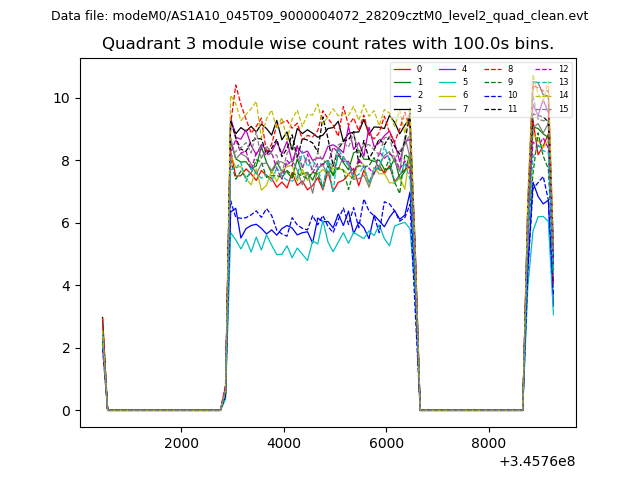 |
 |
| Parameter | Plot |
|---|---|
| CZT HV Monitor |  |
| D_VDD | 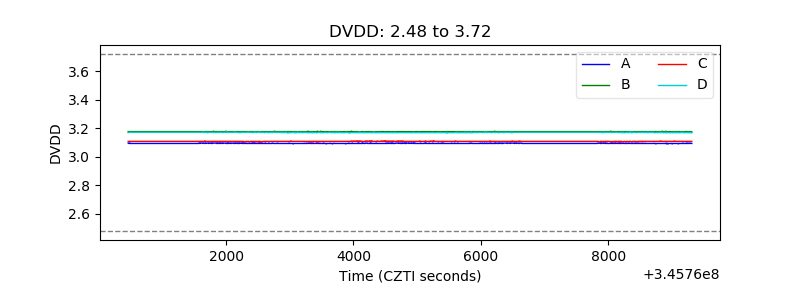 |
| Temperature 1 | 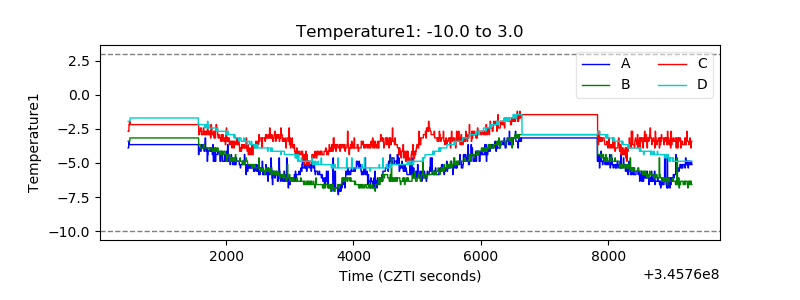 |
| Veto HV Monitor | 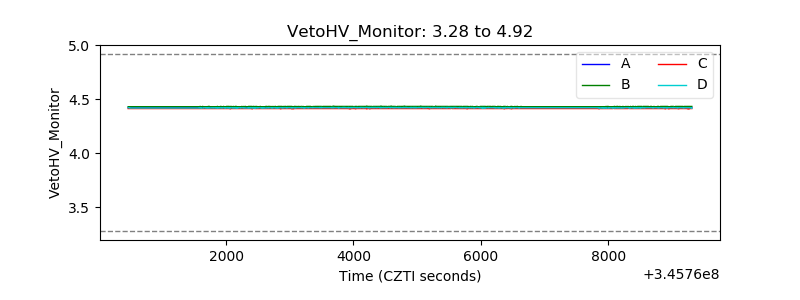 |
| Veto LLD | 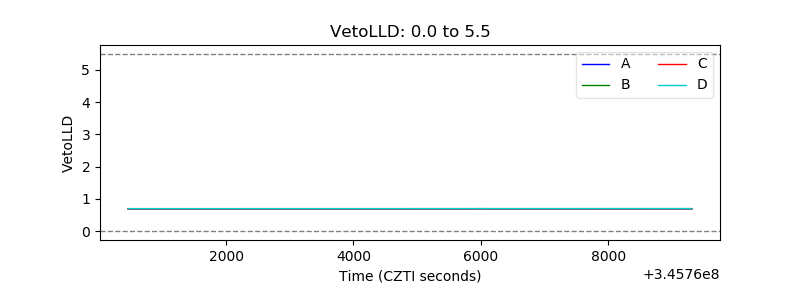 |
| Alpha Counter | 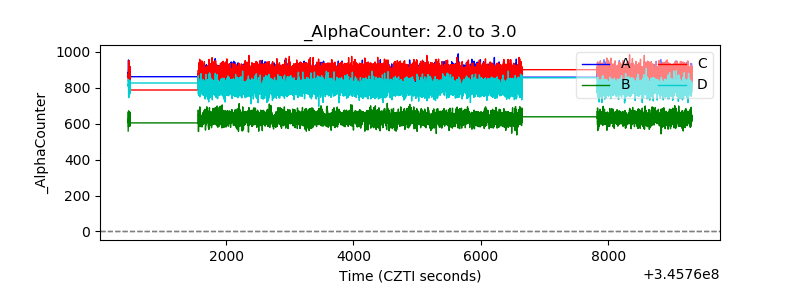 |
| _CPM_Rate | 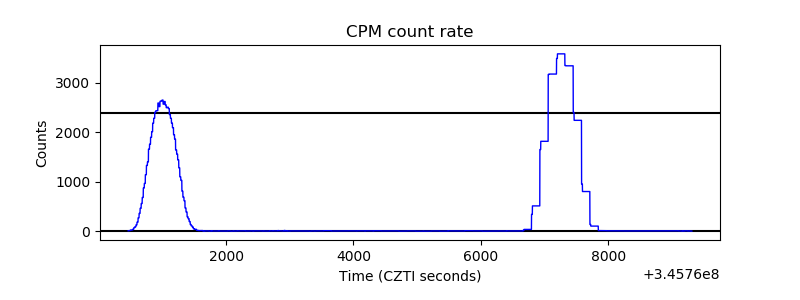 |
| CZT Counter | 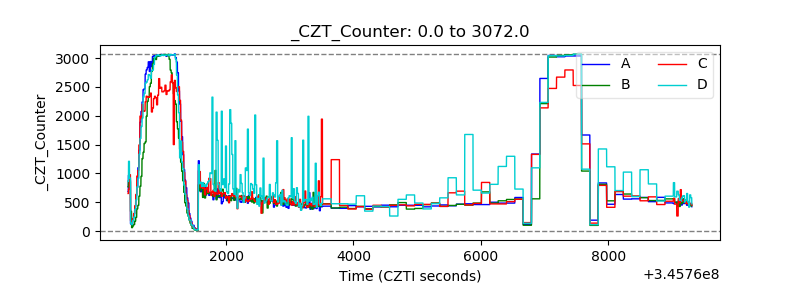 |
| +2.5 Volts monitor |  |
| +5 Volts monitor |  |
| _ROLL_ROT | 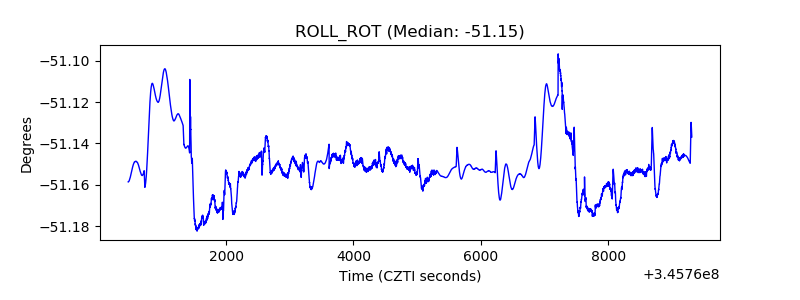 |
| _Roll_DEC | 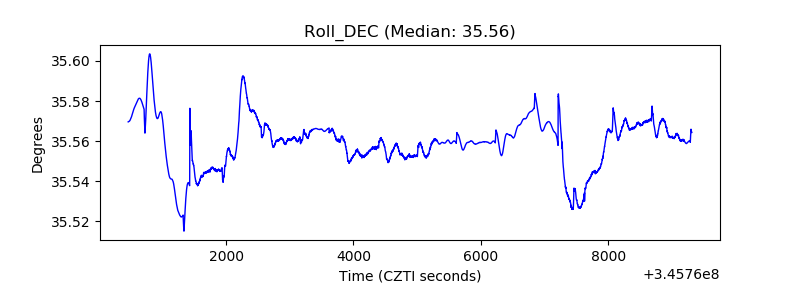 |
| _Roll_RA | 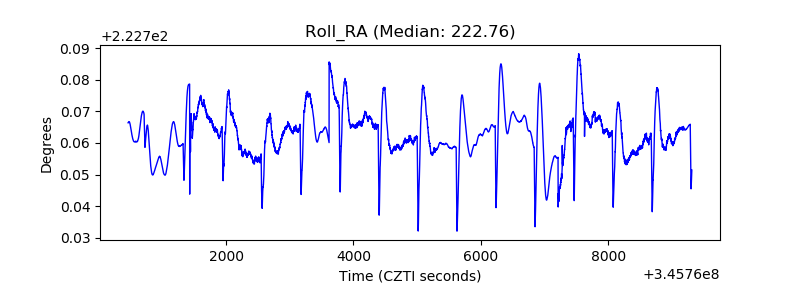 |
| Veto Counter | 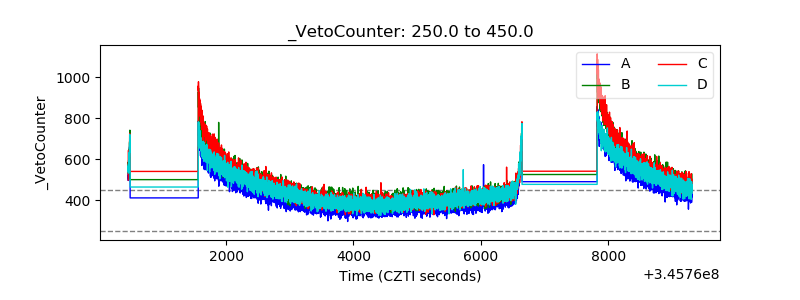 |