| Param | Original file | Final file |
|---|---|---|
| Filename | modeM0/AS1A10_045T09_9000004072_28210cztM0_level2.evt | modeM0/AS1A10_045T09_9000004072_28210cztM0_level2_quad_clean.evt |
| Size (bytes) | 477,800,640 | 95,100,480 |
| Size | 455.7 MB | 90.7 MB |
| Events in quadrant A | 3,242,172 | 620,001 |
| Events in quadrant B | 3,299,653 | 635,443 |
| Events in quadrant C | 3,361,988 | 605,517 |
| Events in quadrant D | 4,142,316 | 582,878 |
| Mode M0 | |||
|---|---|---|---|
| Quadrant | BADHDUFLAG | Total packets | Discarded packets |
| A | 0 | 13669 | 0 |
| B | 0 | 13869 | 0 |
| C | 0 | 14116 | 0 |
| D | 0 | 16571 | 0 |
| Mode M9 | |||
|---|---|---|---|
| Quadrant | BADHDUFLAG | Total packets | Discarded packets |
| A | 0 | 15 | 0 |
| B | 0 | 16 | 0 |
| C | 0 | 16 | 0 |
| D | 0 | 16 | 0 |
| Quadrant | Total seconds | Saturated seconds | Saturation percentage |
|---|---|---|---|
| A | 6254 | 53 | 0.847458% |
| B | 6254 | 62 | 0.991366% |
| C | 6254 | 101 | 1.614966% |
| D | 6254 | 121 | 1.934762% |
Noise dominated data is calculated using 1-second bins in cleaned event files. If a bin has >2000 counts, and if more than 50% of those come from <1% of pixels, then it is considered to be noise-dominated and hence unusable.
| Quadrant | # 1 sec bins | Bins with >0 counts | Bins with >2000 counts | High rate bins dominated by noise | Noise dominated (total time) | Noise dominated (detector-on time) | Marked lightcurve |
|---|---|---|---|---|---|---|---|
| A | 7529 | 6254 | 1 | 1 | 0.01% | 0.02% | 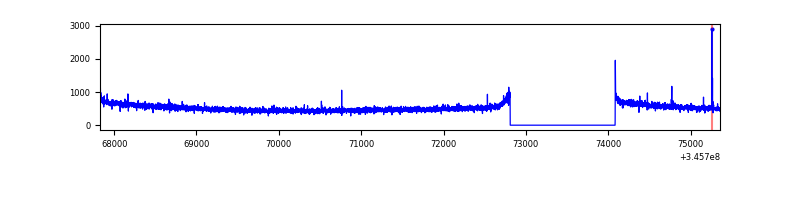 |
| B | 7529 | 6254 | 4 | 4 | 0.05% | 0.06% | 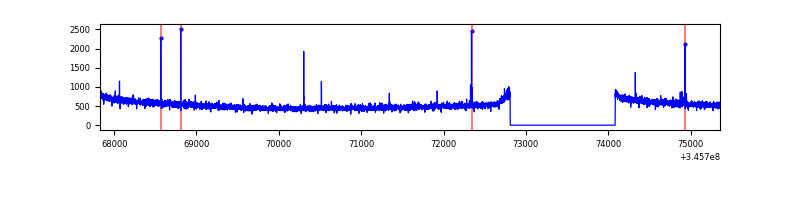 |
| C | 7529 | 6255 | 0 | 0 | 0.00% | 0.00% | 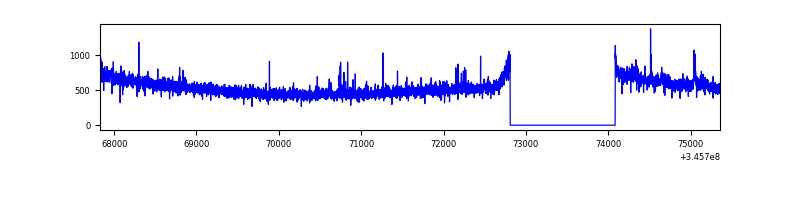 |
| D | 7529 | 6254 | 68 | 68 | 0.90% | 1.09% | 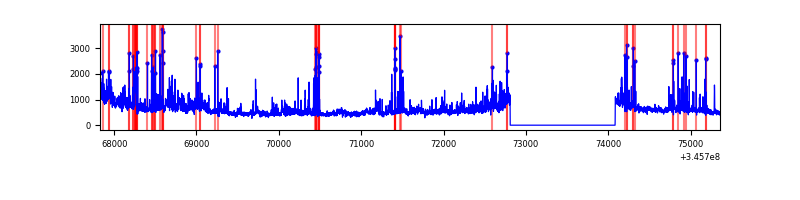 |
Top three noisy pixels from each quadrant. If the there are fewer than three noisy pixels in the level2.evt file, extra rows are filled as -1
| Pixel properties | Quadrant properties | ||||||
|---|---|---|---|---|---|---|---|
| Quadrant | DetID | PixID | Counts | Sigma | Mean | Median | Sigma |
| A | 12 | 96 | 10836 | 59.81 | 835 | 821 | 167.4 |
| A | 8 | 192 | 9889 | 54.16 | 835 | 821 | 167.4 |
| A | 13 | 254 | 8715 | 47.14 | 835 | 821 | 167.4 |
| B | 12 | 111 | 19070 | 116.19 | 834 | 816 | 157.1 |
| B | 11 | 111 | 17386 | 105.47 | 834 | 816 | 157.1 |
| B | 14 | 111 | 16616 | 100.57 | 834 | 816 | 157.1 |
| C | 14 | 238 | 132691 | 707.71 | 804 | 811 | 186.3 |
| C | 3 | 233 | 74431 | 395.07 | 804 | 811 | 186.3 |
| C | 2 | 16 | 16287 | 83.05 | 804 | 811 | 186.3 |
| D | 1 | 52 | 789557 | 4184.03 | 797 | 776 | 188.5 |
| D | 8 | 195 | 165994 | 876.39 | 797 | 776 | 188.5 |
| D | 5 | 222 | 68262 | 357.97 | 797 | 776 | 188.5 |
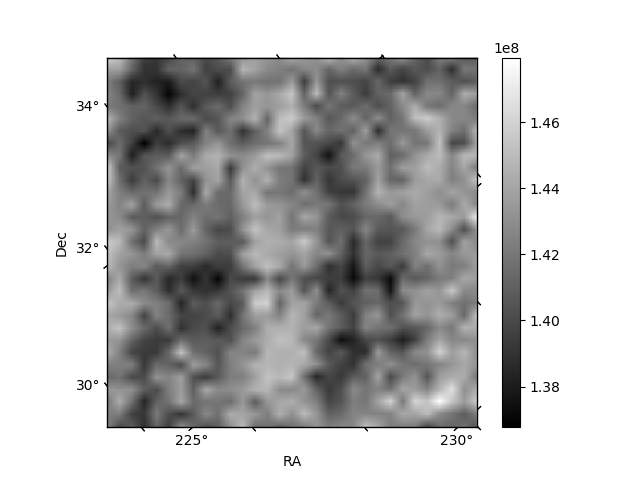
Histogram calculated using DETX and DETY for each event in the final _common_clean file
| Quadrant A | 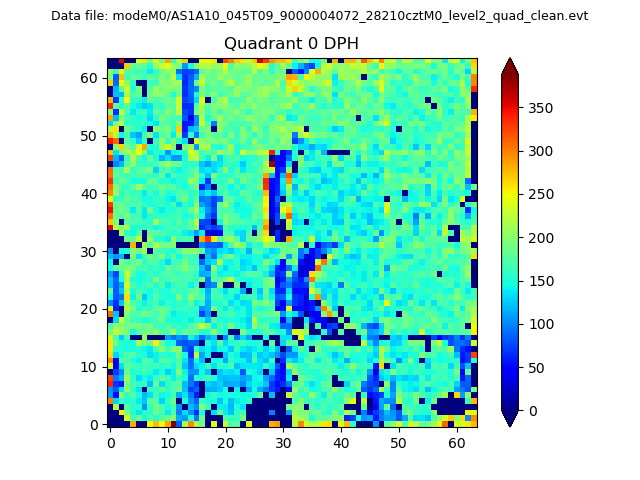 |
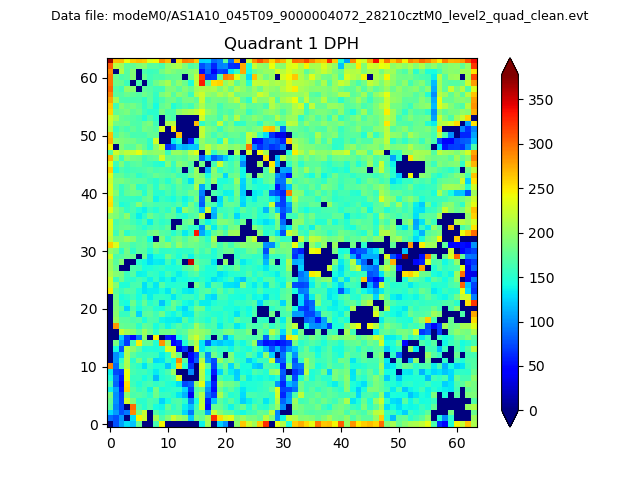 |
Quadrant B |
|---|---|---|---|
| Quadrant D | 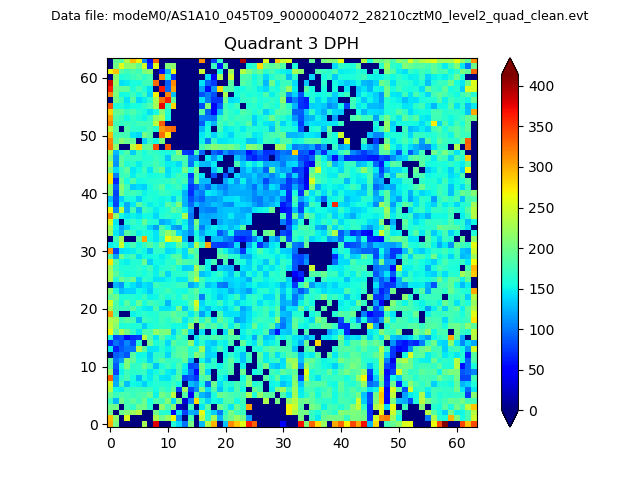 |
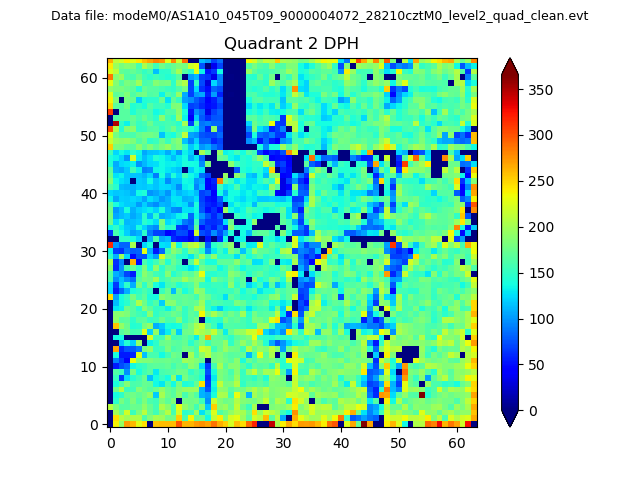 |
Quadrant C |
| Plot type | Count rate plots | Images |
|---|---|---|
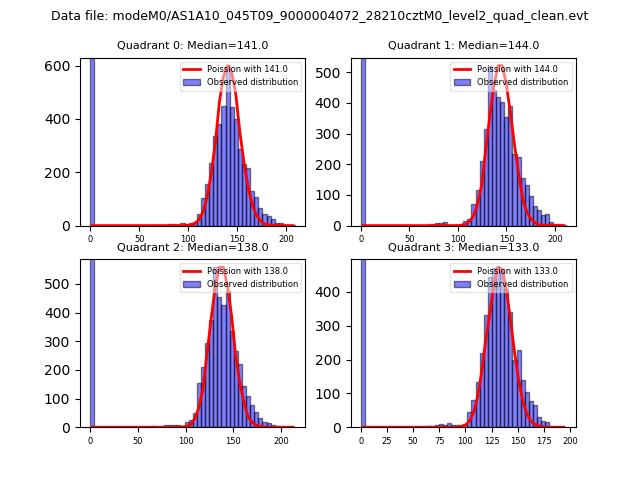
| Comparison with Poisson distribution Blue bars denote a histogram of data divided into 1 sec bins. Red curve is a Poisson curve with rate = median count rate of data. |
 |
 |
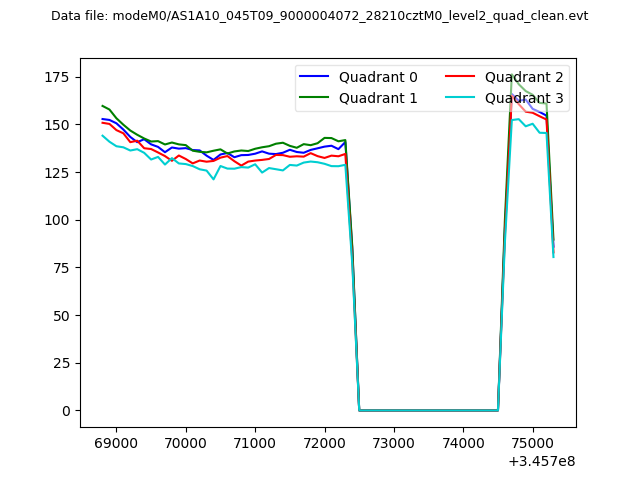
| Quadrant-wise count rates Data is divided into 100 sec bins |
 |
|
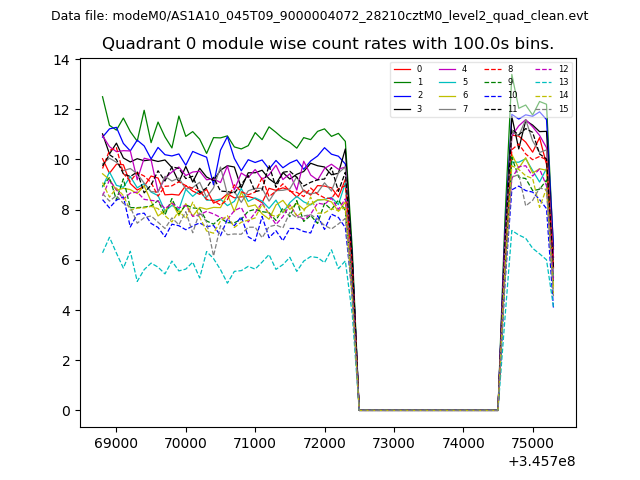
| Module-wise count rates for Quadrant A Data is divided into 100 sec bins |
 |
 |
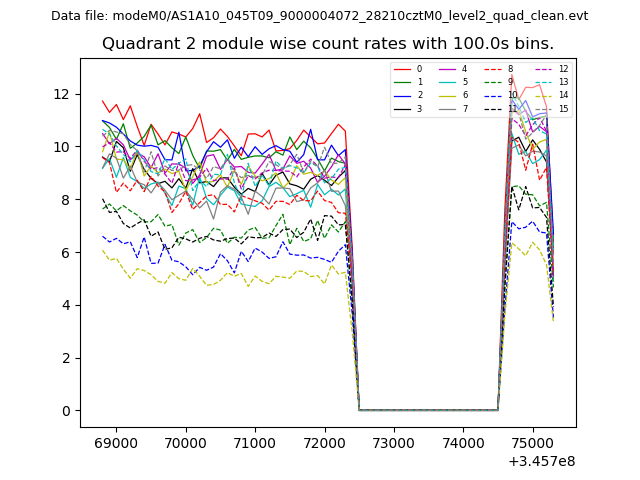
| Module-wise count rates for Quadrant B Data is divided into 100 sec bins |
 |
 |
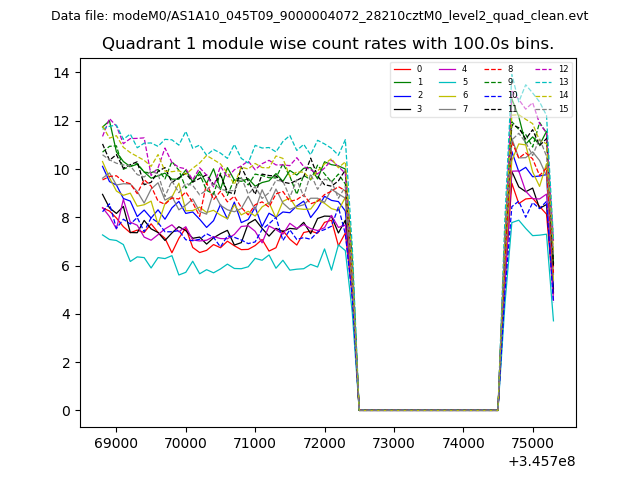
| Module-wise count rates for Quadrant C Data is divided into 100 sec bins |
 |
 |
| Module-wise count rates for Quadrant D Data is divided into 100 sec bins |
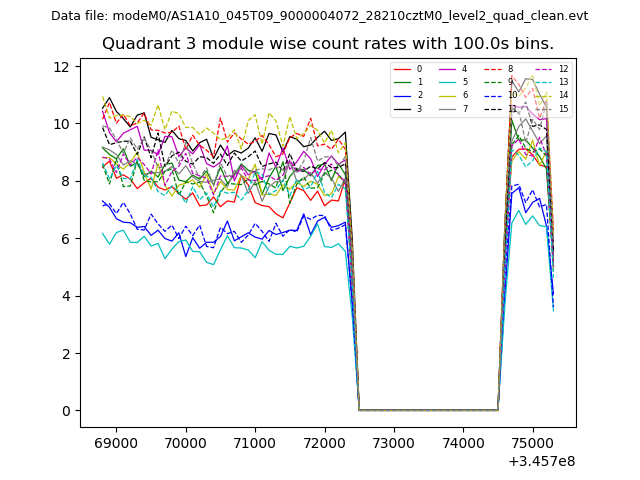 |
 |
| Parameter | Plot |
|---|---|
| CZT HV Monitor | 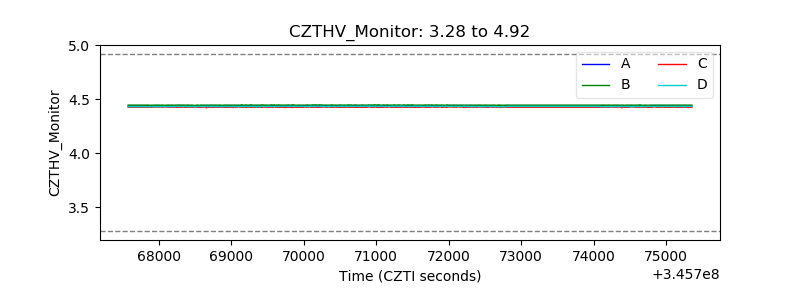 |
| D_VDD | 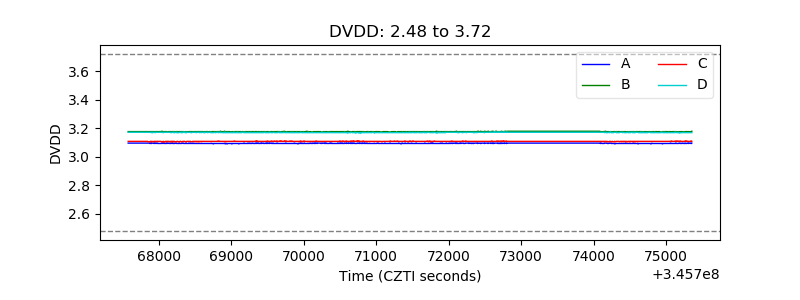 |
| Temperature 1 | 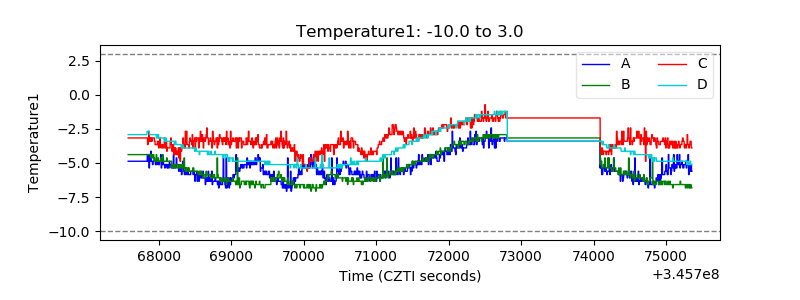 |
| Veto HV Monitor | 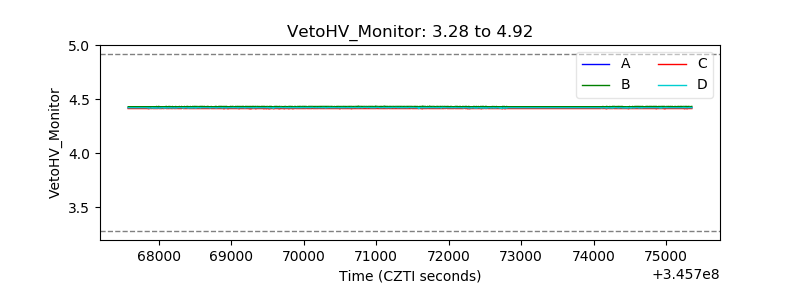 |
| Veto LLD | 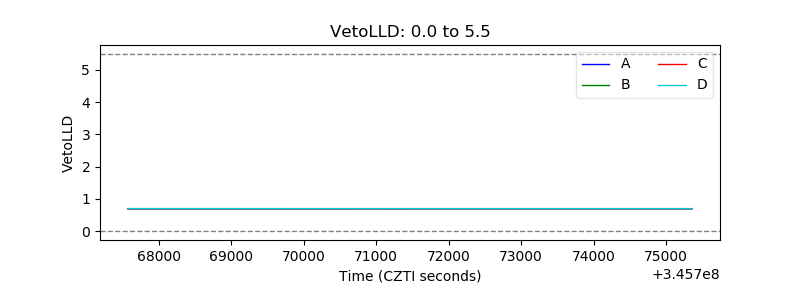 |
| Alpha Counter | 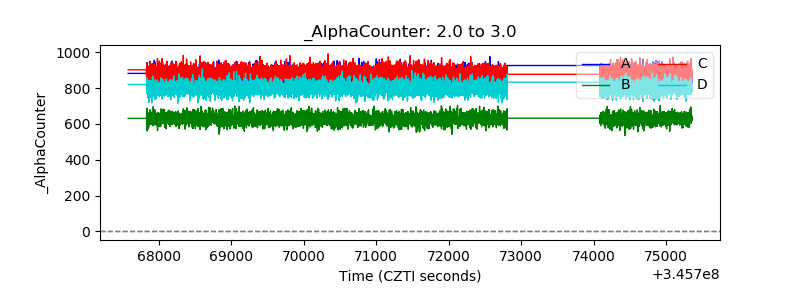 |
| _CPM_Rate | 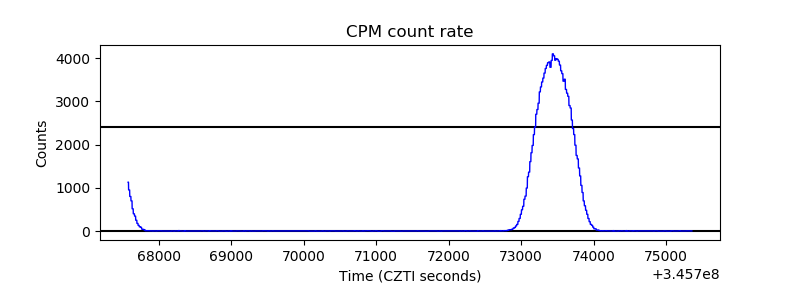 |
| CZT Counter | 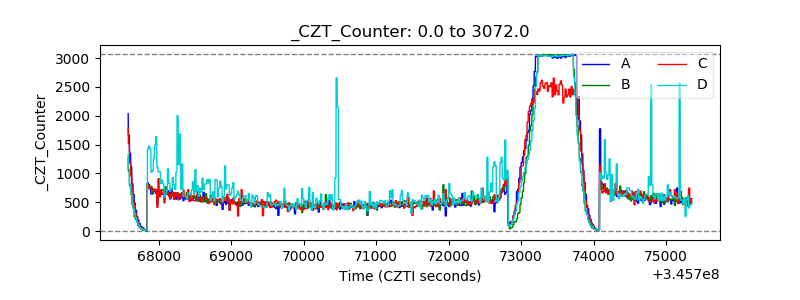 |
| +2.5 Volts monitor |  |
| +5 Volts monitor |  |
| _ROLL_ROT |  |
| _Roll_DEC | 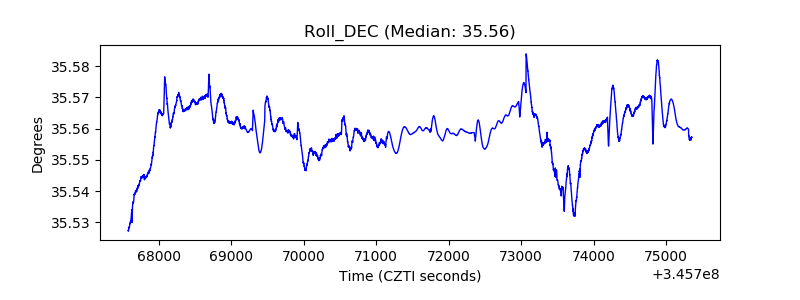 |
| _Roll_RA | 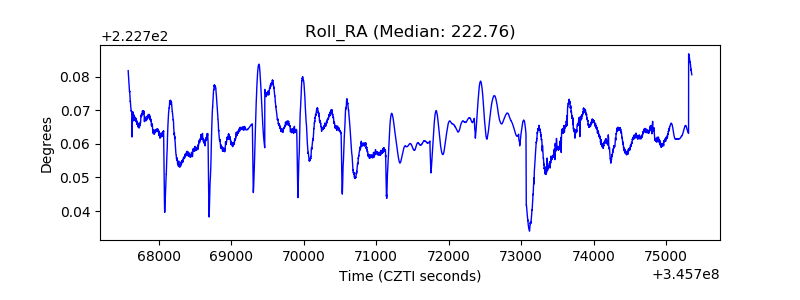 |
| Veto Counter | 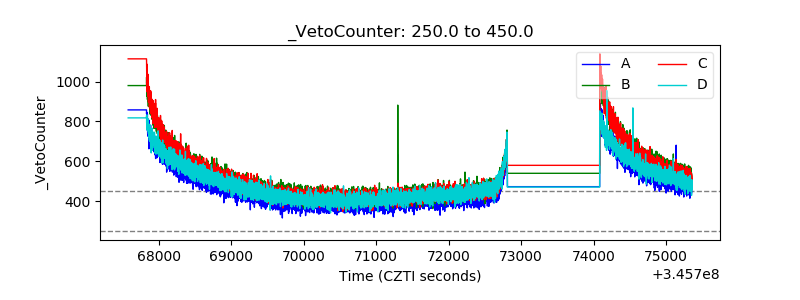 |