| Param | Original file | Final file |
|---|---|---|
| Filename | modeM0/AS1A10_045T09_9000004072_28211cztM0_level2.evt | modeM0/AS1A10_045T09_9000004072_28211cztM0_level2_quad_clean.evt |
| Size (bytes) | 511,522,560 | 114,223,680 |
| Size | 487.8 MB | 108.9 MB |
| Events in quadrant A | 3,400,084 | 764,612 |
| Events in quadrant B | 3,477,453 | 789,366 |
| Events in quadrant C | 3,481,874 | 742,303 |
| Events in quadrant D | 4,687,604 | 706,086 |
| Mode M0 | |||
|---|---|---|---|
| Quadrant | BADHDUFLAG | Total packets | Discarded packets |
| A | 0 | 14201 | 0 |
| B | 0 | 14446 | 0 |
| C | 0 | 14562 | 0 |
| D | 0 | 18404 | 0 |
| Mode M9 | |||
|---|---|---|---|
| Quadrant | BADHDUFLAG | Total packets | Discarded packets |
| A | 0 | 15 | 0 |
| B | 0 | 16 | 0 |
| C | 0 | 16 | 0 |
| D | 0 | 16 | 0 |
| Quadrant | Total seconds | Saturated seconds | Saturation percentage |
|---|---|---|---|
| A | 6560 | 59 | 0.899390% |
| B | 6559 | 67 | 1.021497% |
| C | 6559 | 83 | 1.265437% |
| D | 6559 | 113 | 1.722824% |
Noise dominated data is calculated using 1-second bins in cleaned event files. If a bin has >2000 counts, and if more than 50% of those come from <1% of pixels, then it is considered to be noise-dominated and hence unusable.
| Quadrant | # 1 sec bins | Bins with >0 counts | Bins with >2000 counts | High rate bins dominated by noise | Noise dominated (total time) | Noise dominated (detector-on time) | Marked lightcurve |
|---|---|---|---|---|---|---|---|
| A | 7880 | 6561 | 1 | 1 | 0.01% | 0.02% | 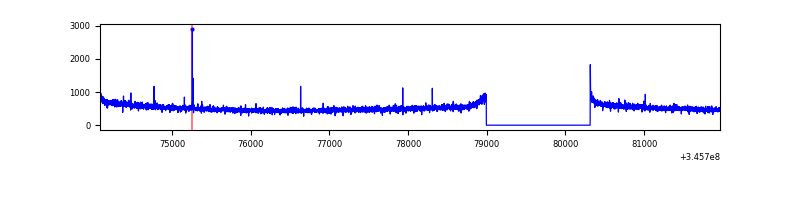 |
| B | 7879 | 6560 | 3 | 3 | 0.04% | 0.05% | 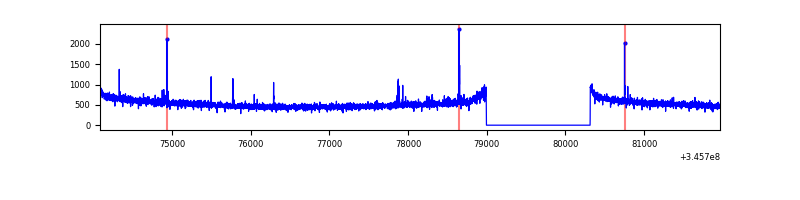 |
| C | 7879 | 6560 | 0 | 0 | 0.00% | 0.00% | 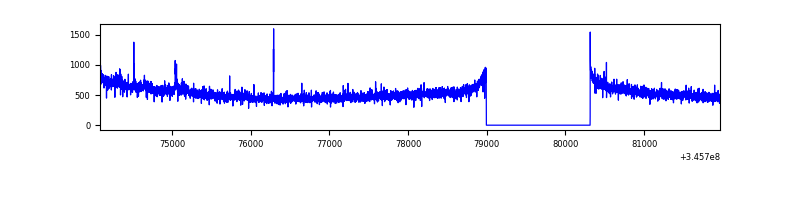 |
| D | 7879 | 6560 | 59 | 59 | 0.75% | 0.90% | 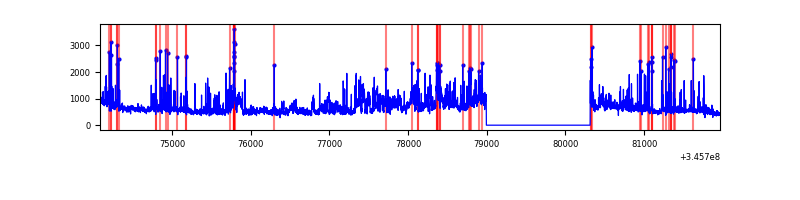 |
Top three noisy pixels from each quadrant. If the there are fewer than three noisy pixels in the level2.evt file, extra rows are filled as -1
| Pixel properties | Quadrant properties | ||||||
|---|---|---|---|---|---|---|---|
| Quadrant | DetID | PixID | Counts | Sigma | Mean | Median | Sigma |
| A | 12 | 96 | 10054 | 52.83 | 877 | 862 | 174.0 |
| A | 8 | 192 | 9246 | 48.19 | 877 | 862 | 174.0 |
| A | 13 | 254 | 8650 | 44.76 | 877 | 862 | 174.0 |
| B | 12 | 111 | 20054 | 116.7 | 877 | 858 | 164.5 |
| B | 0 | 230 | 19070 | 110.71 | 877 | 858 | 164.5 |
| B | 11 | 111 | 18109 | 104.87 | 877 | 858 | 164.5 |
| C | 14 | 238 | 137520 | 704.32 | 839 | 844 | 194.1 |
| C | 3 | 233 | 69442 | 353.5 | 839 | 844 | 194.1 |
| C | 13 | 61 | 5824 | 25.66 | 839 | 844 | 194.1 |
| D | 1 | 52 | 1102536 | 5593.26 | 828 | 807 | 197.0 |
| D | 8 | 195 | 242102 | 1225.01 | 828 | 807 | 197.0 |
| D | 2 | 250 | 89739 | 451.49 | 828 | 807 | 197.0 |
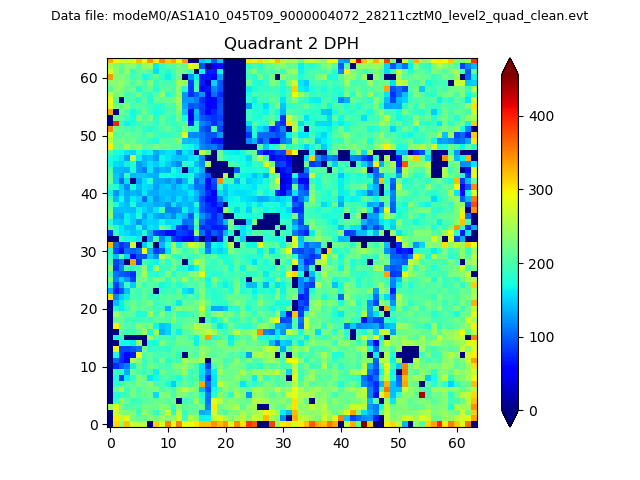
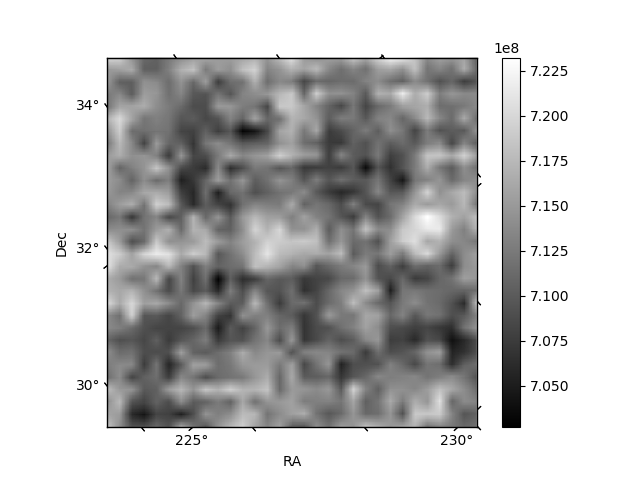
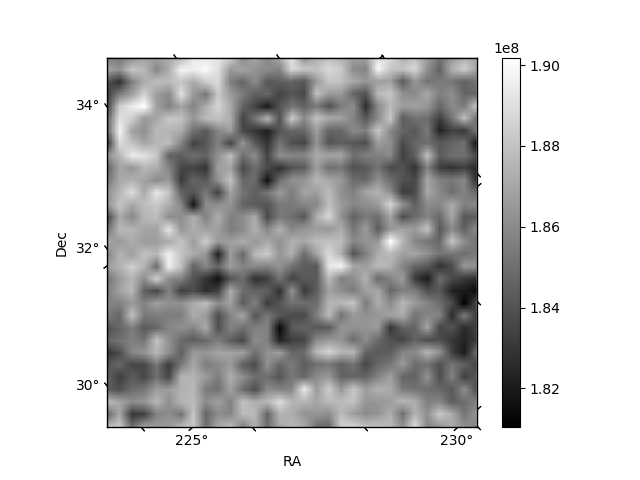
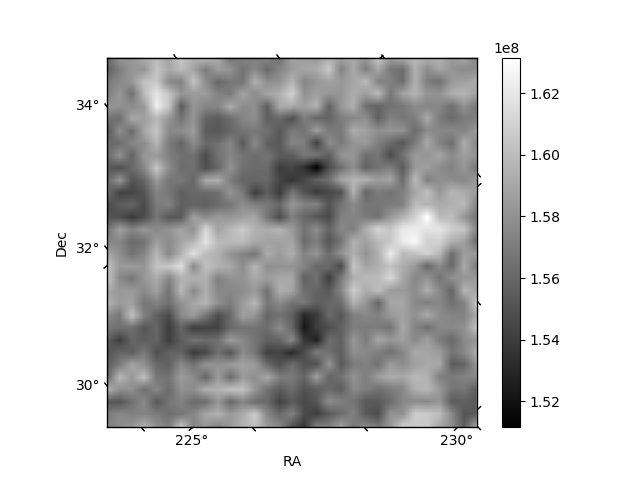
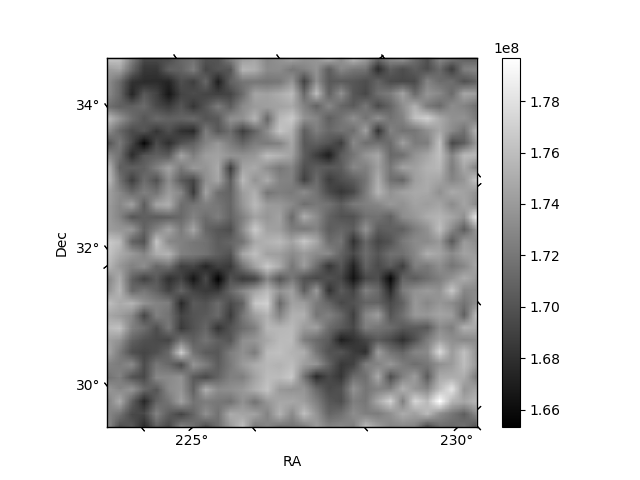
Histogram calculated using DETX and DETY for each event in the final _common_clean file
| Quadrant A | 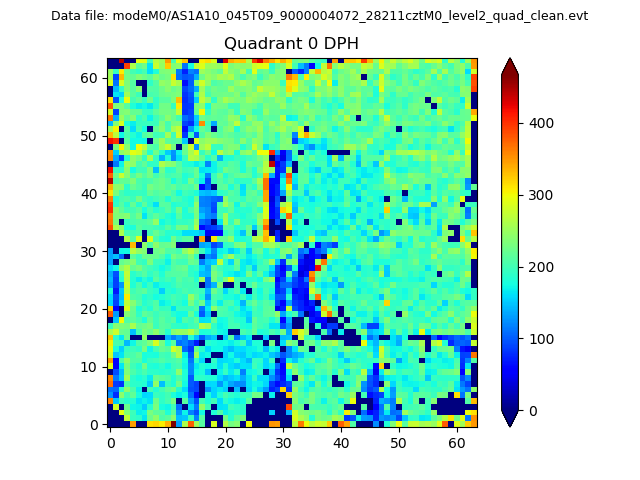 |
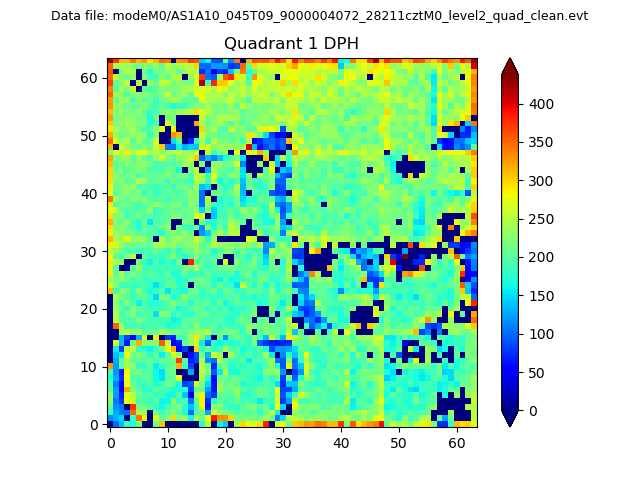 |
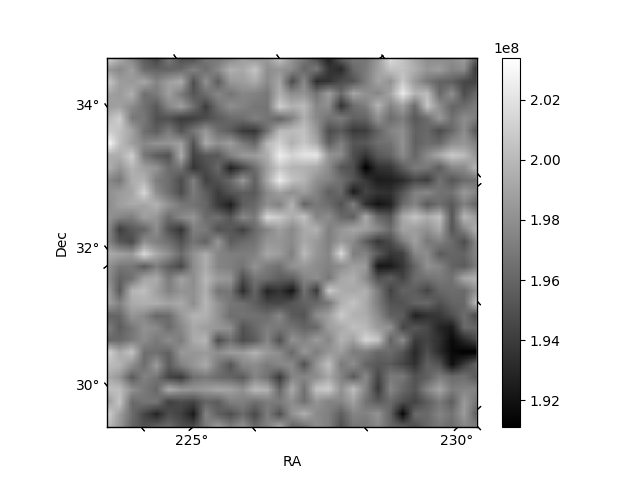
Quadrant B |
|---|---|---|---|
| Quadrant D | 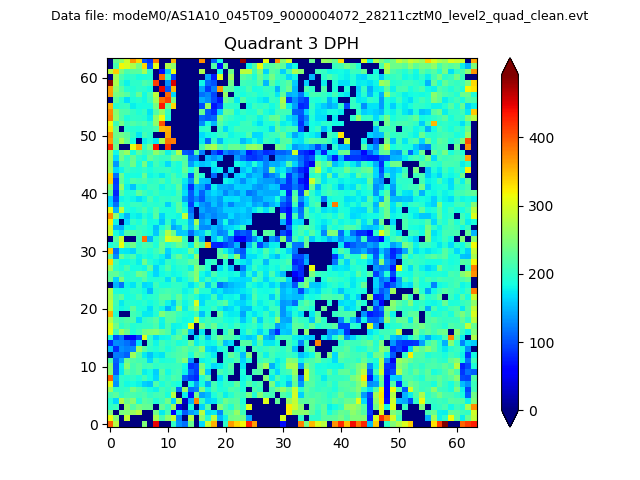 |
 |
Quadrant C |
| Plot type | Count rate plots | Images |
|---|---|---|
| Comparison with Poisson distribution Blue bars denote a histogram of data divided into 1 sec bins. Red curve is a Poisson curve with rate = median count rate of data. |
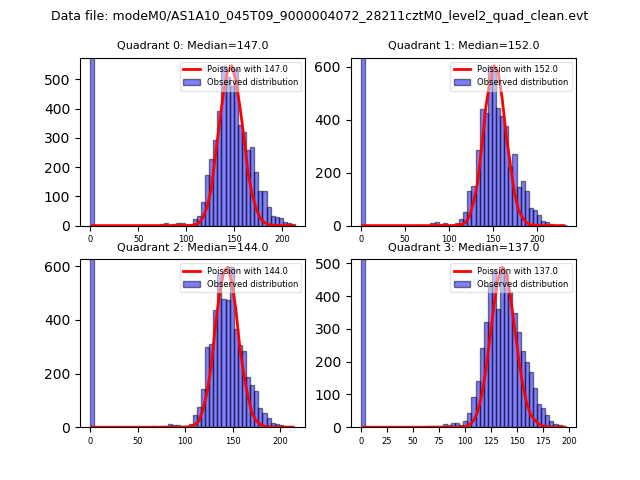 |
 |
| Quadrant-wise count rates Data is divided into 100 sec bins |
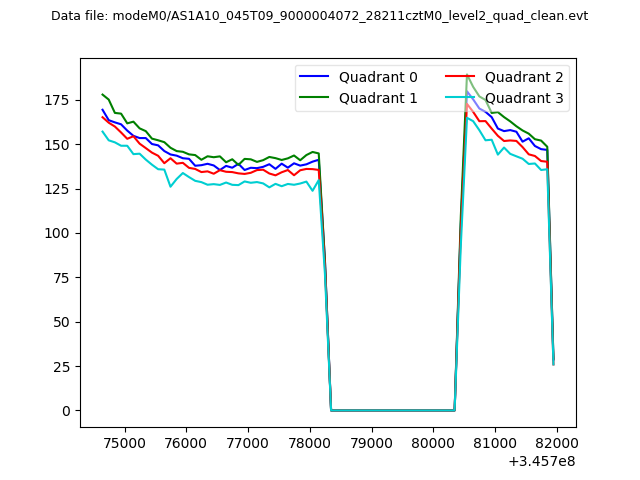 |
|
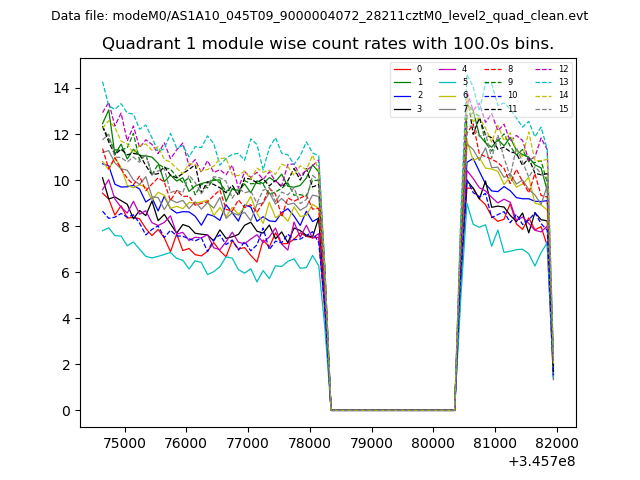
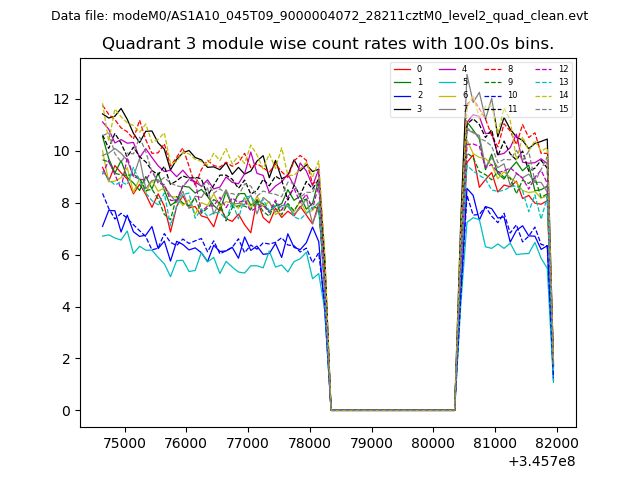
| Module-wise count rates for Quadrant A Data is divided into 100 sec bins |
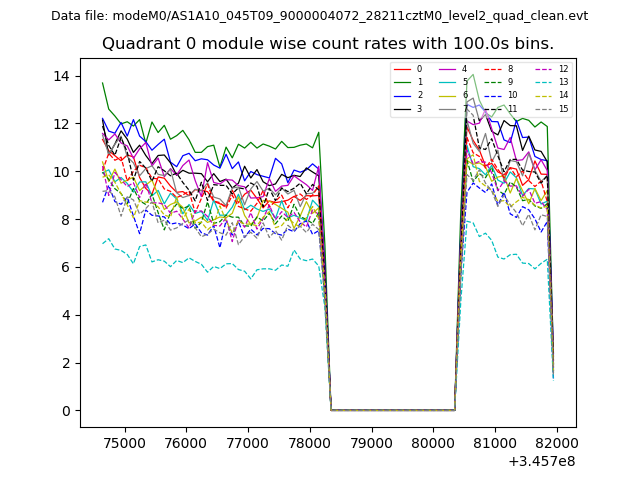 |
 |
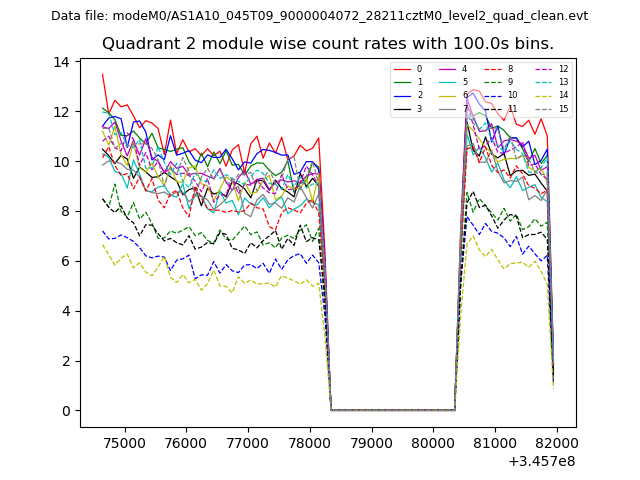
| Module-wise count rates for Quadrant B Data is divided into 100 sec bins |
 |
 |
| Module-wise count rates for Quadrant C Data is divided into 100 sec bins |
 |
 |
| Module-wise count rates for Quadrant D Data is divided into 100 sec bins |
 |
 |
| Parameter | Plot |
|---|---|
| CZT HV Monitor | 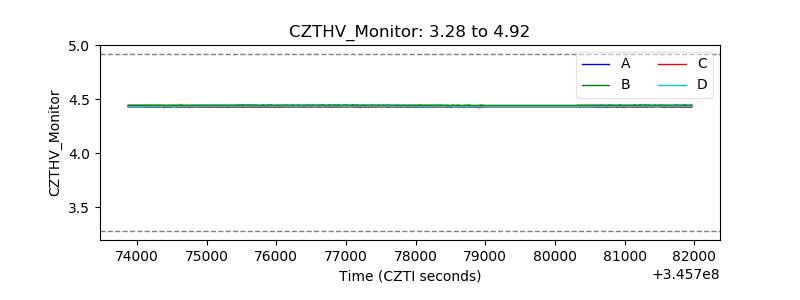 |
| D_VDD | 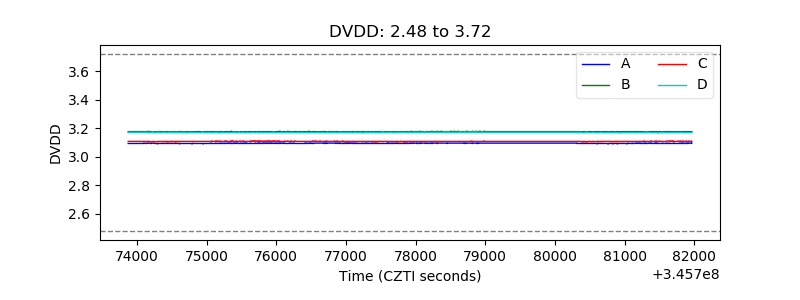 |
| Temperature 1 | 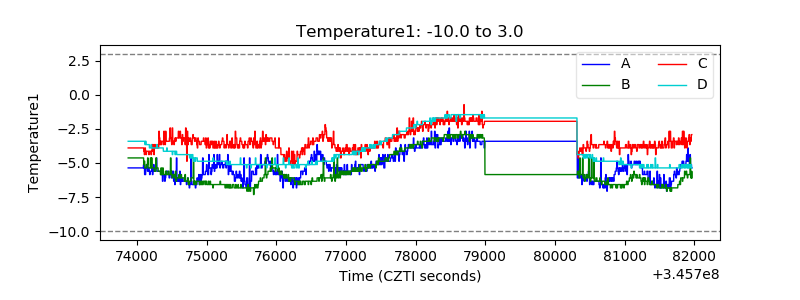 |
| Veto HV Monitor | 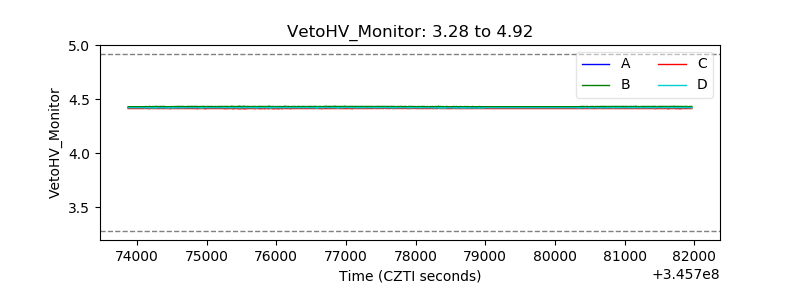 |
| Veto LLD | 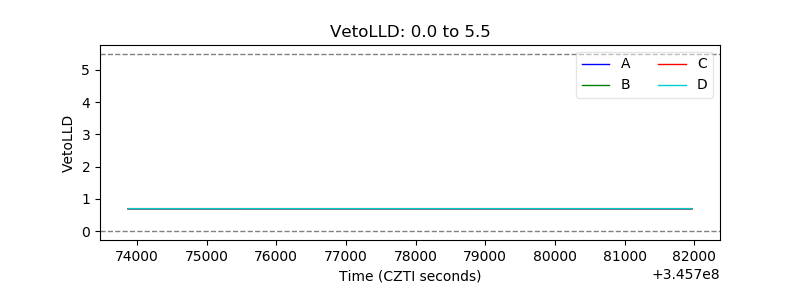 |
| Alpha Counter | 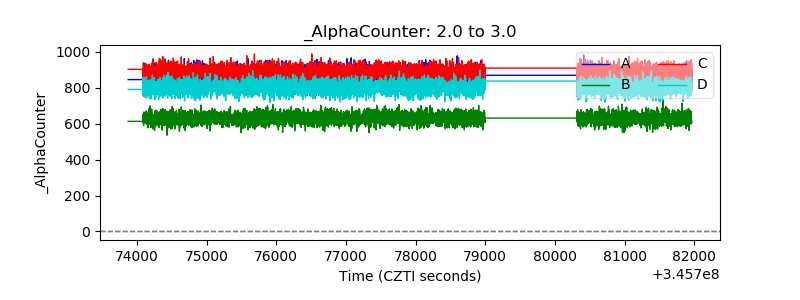 |
| _CPM_Rate | 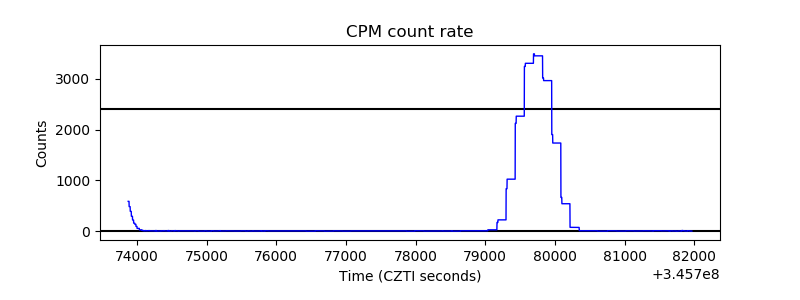 |
| CZT Counter | 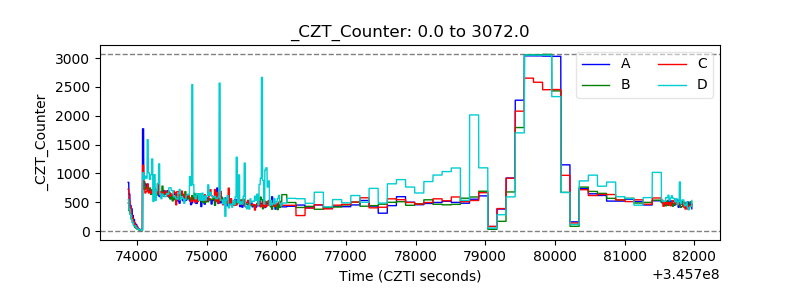 |
| +2.5 Volts monitor |  |
| +5 Volts monitor | 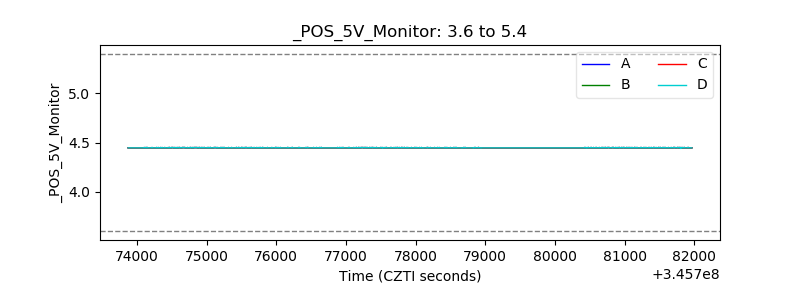 |
| _ROLL_ROT | 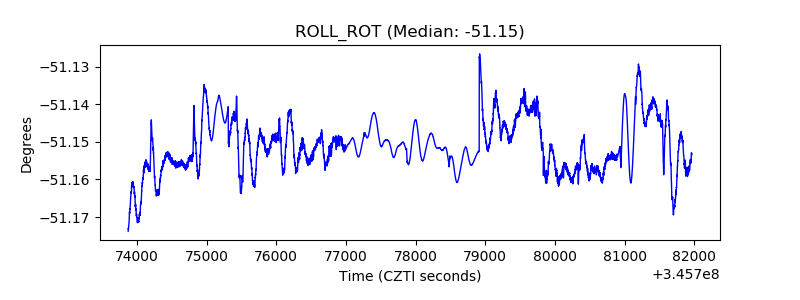 |
| _Roll_DEC | 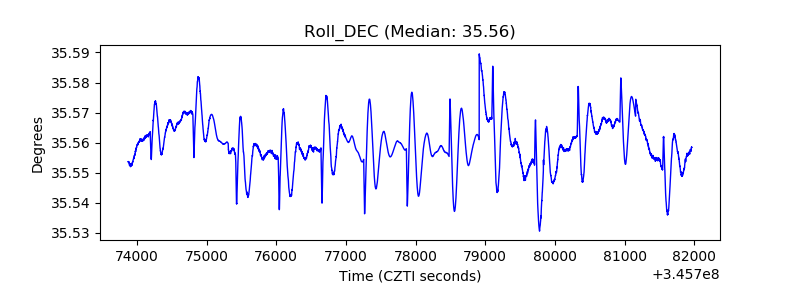 |
| _Roll_RA | 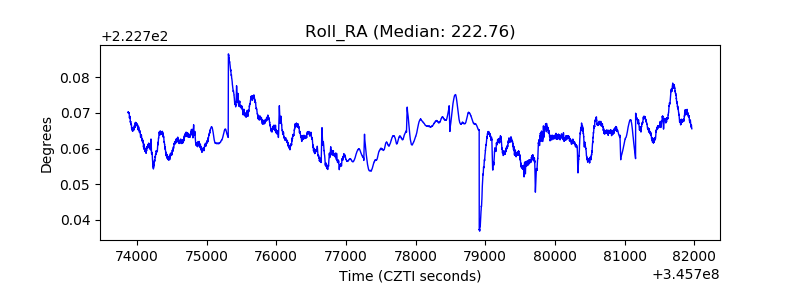 |
| Veto Counter | 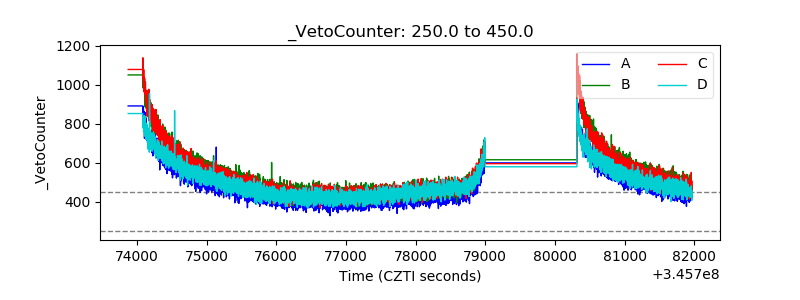 |