| Param | Original file | Final file |
|---|---|---|
| Filename | modeM0/AS1A10_045T09_9000004072_28212cztM0_level2.evt | modeM0/AS1A10_045T09_9000004072_28212cztM0_level2_quad_clean.evt |
| Size (bytes) | 481,717,440 | 116,884,800 |
| Size | 459.4 MB | 111.5 MB |
| Events in quadrant A | 3,325,046 | 785,820 |
| Events in quadrant B | 3,407,334 | 812,991 |
| Events in quadrant C | 3,385,388 | 757,815 |
| Events in quadrant D | 4,026,440 | 726,650 |
| Mode M0 | |||
|---|---|---|---|
| Quadrant | BADHDUFLAG | Total packets | Discarded packets |
| A | 0 | 13938 | 0 |
| B | 0 | 14197 | 0 |
| C | 0 | 14145 | 0 |
| D | 0 | 16254 | 0 |
| Mode M9 | |||
|---|---|---|---|
| Quadrant | BADHDUFLAG | Total packets | Discarded packets |
| A | 0 | 16 | 0 |
| B | 0 | 17 | 0 |
| C | 0 | 17 | 0 |
| D | 0 | 17 | 0 |
| Quadrant | Total seconds | Saturated seconds | Saturation percentage |
|---|---|---|---|
| A | 6554 | 46 | 0.701861% |
| B | 6554 | 78 | 1.190113% |
| C | 6554 | 87 | 1.327434% |
| D | 6554 | 96 | 1.464754% |
Noise dominated data is calculated using 1-second bins in cleaned event files. If a bin has >2000 counts, and if more than 50% of those come from <1% of pixels, then it is considered to be noise-dominated and hence unusable.
| Quadrant | # 1 sec bins | Bins with >0 counts | Bins with >2000 counts | High rate bins dominated by noise | Noise dominated (total time) | Noise dominated (detector-on time) | Marked lightcurve |
|---|---|---|---|---|---|---|---|
| A | 7849 | 6555 | 0 | 0 | 0.00% | 0.00% | 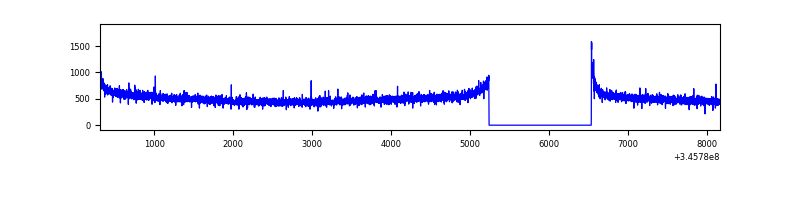 |
| B | 7849 | 6555 | 2 | 2 | 0.03% | 0.03% | 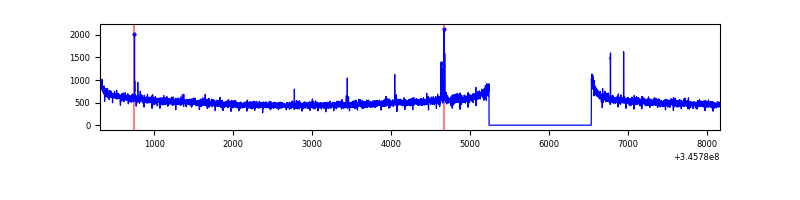 |
| C | 7849 | 6555 | 0 | 0 | 0.00% | 0.00% | 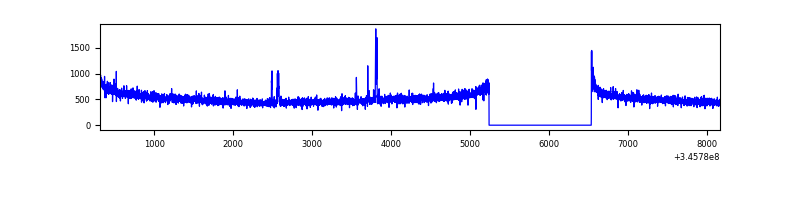 |
| D | 7849 | 6555 | 48 | 48 | 0.61% | 0.73% | 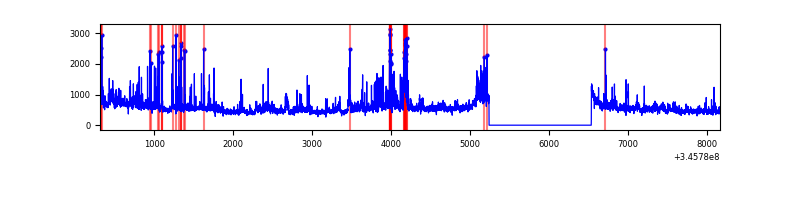 |
Top three noisy pixels from each quadrant. If the there are fewer than three noisy pixels in the level2.evt file, extra rows are filled as -1
| Pixel properties | Quadrant properties | ||||||
|---|---|---|---|---|---|---|---|
| Quadrant | DetID | PixID | Counts | Sigma | Mean | Median | Sigma |
| A | 13 | 254 | 9084 | 48.24 | 860 | 845 | 170.8 |
| A | 3 | 137 | 7853 | 41.04 | 860 | 845 | 170.8 |
| A | 8 | 192 | 7703 | 40.16 | 860 | 845 | 170.8 |
| B | 12 | 111 | 19497 | 115.02 | 861 | 844 | 162.2 |
| B | 0 | 190 | 18587 | 109.41 | 861 | 844 | 162.2 |
| B | 11 | 111 | 17913 | 105.26 | 861 | 844 | 162.2 |
| C | 14 | 238 | 134216 | 705.55 | 820 | 829 | 189.1 |
| C | 9 | 54 | 26011 | 133.2 | 820 | 829 | 189.1 |
| C | 8 | 222 | 15282 | 76.45 | 820 | 829 | 189.1 |
| D | 1 | 52 | 583831 | 3051.07 | 811 | 791 | 191.1 |
| D | 8 | 195 | 146180 | 760.83 | 811 | 791 | 191.1 |
| D | 12 | 79 | 126275 | 656.66 | 811 | 791 | 191.1 |
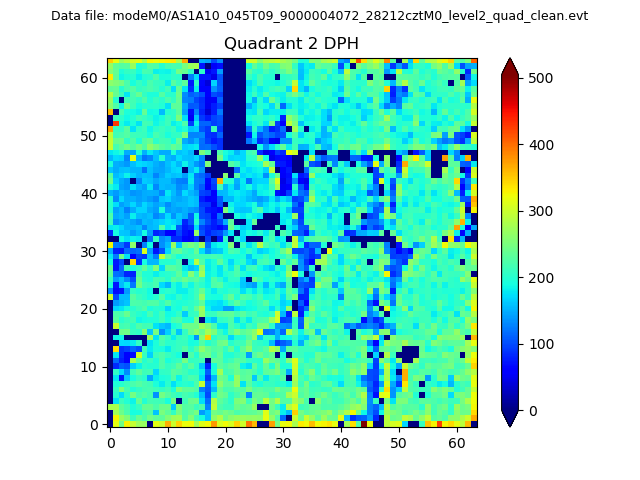
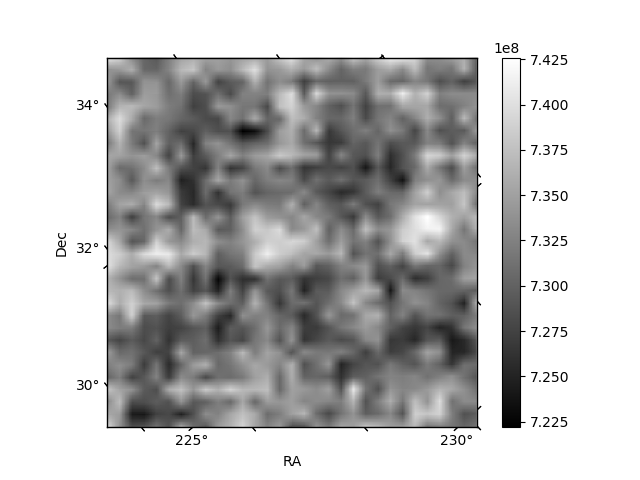
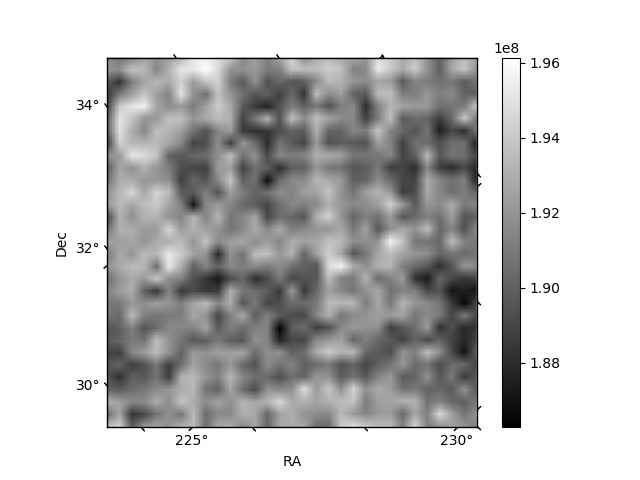
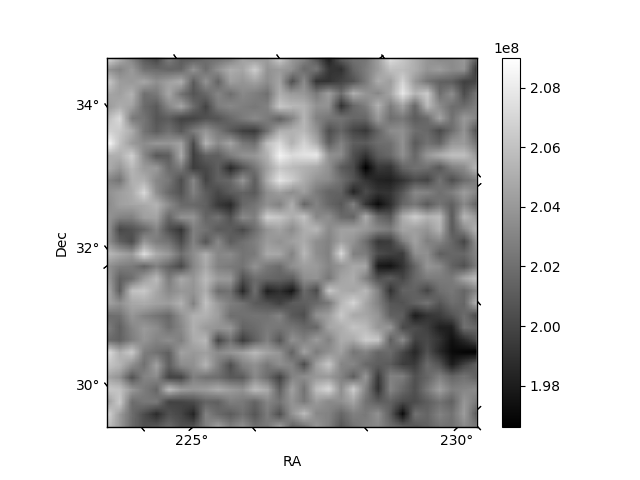
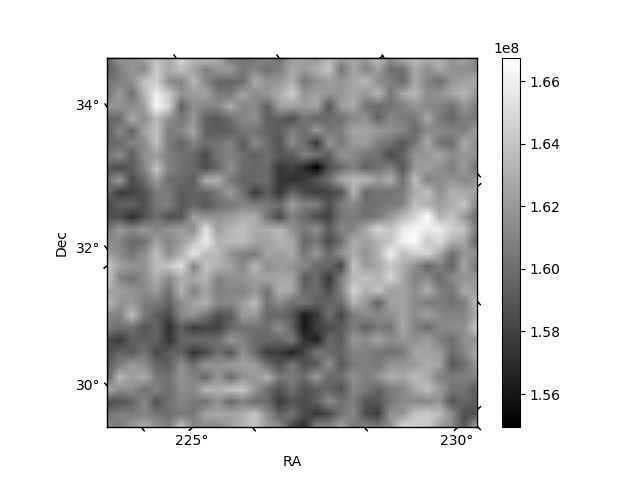
Histogram calculated using DETX and DETY for each event in the final _common_clean file
| Quadrant A | 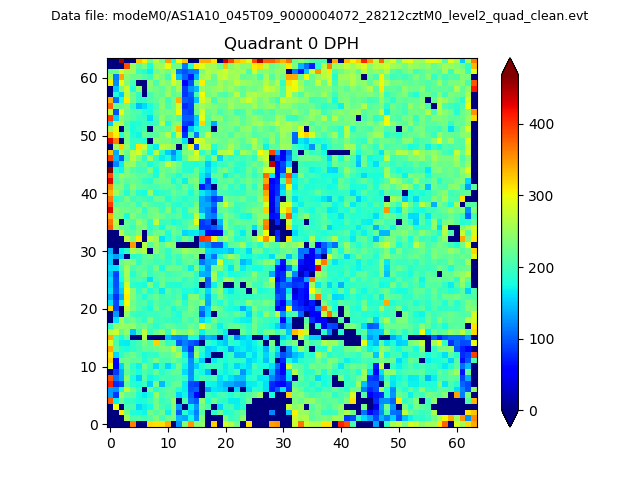 |
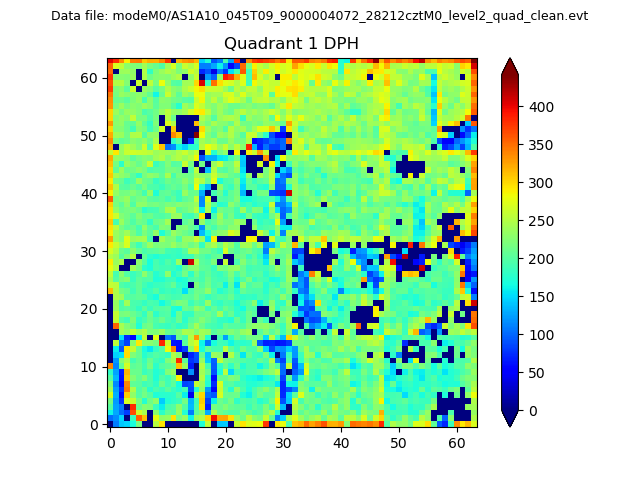 |
Quadrant B |
|---|---|---|---|
| Quadrant D | 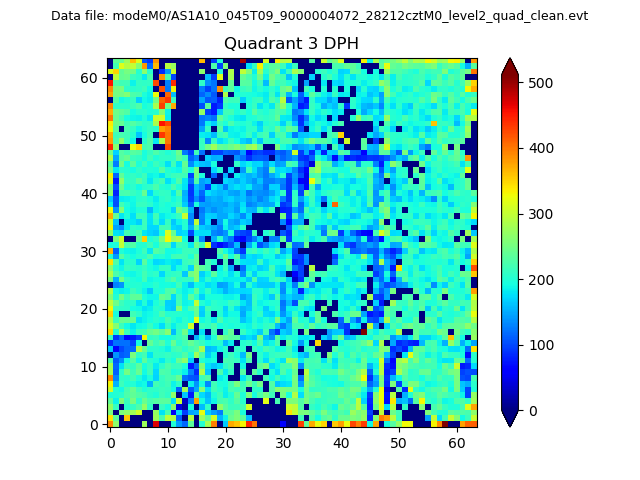 |
 |
Quadrant C |
| Plot type | Count rate plots | Images |
|---|---|---|
| Comparison with Poisson distribution Blue bars denote a histogram of data divided into 1 sec bins. Red curve is a Poisson curve with rate = median count rate of data. |
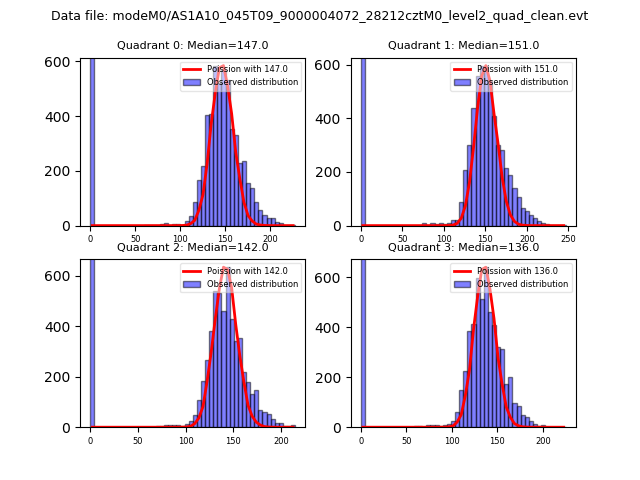 |
 |
| Quadrant-wise count rates Data is divided into 100 sec bins |
 |
|
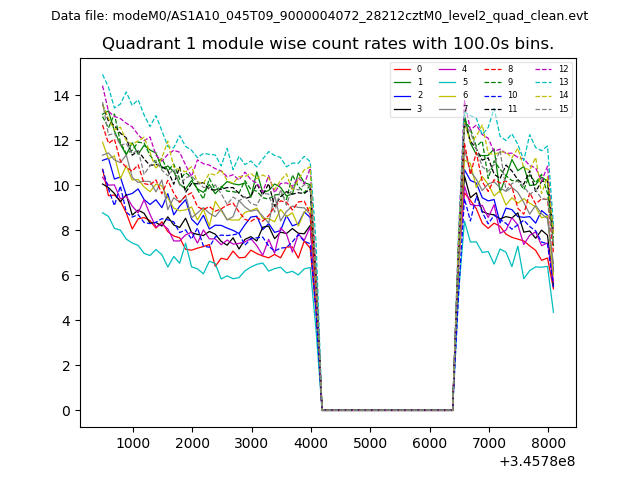
| Module-wise count rates for Quadrant A Data is divided into 100 sec bins |
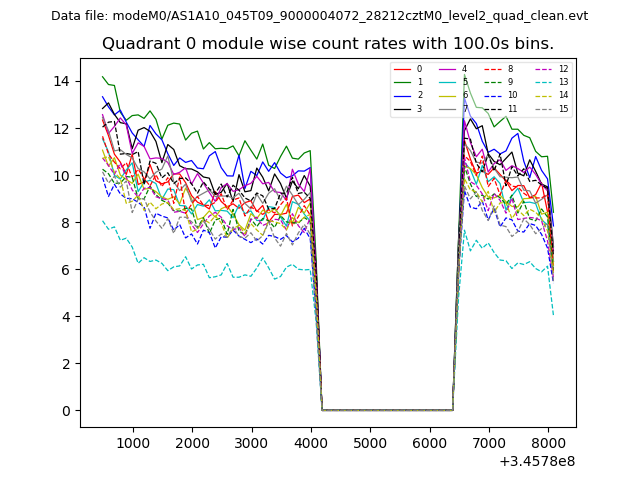 |
 |
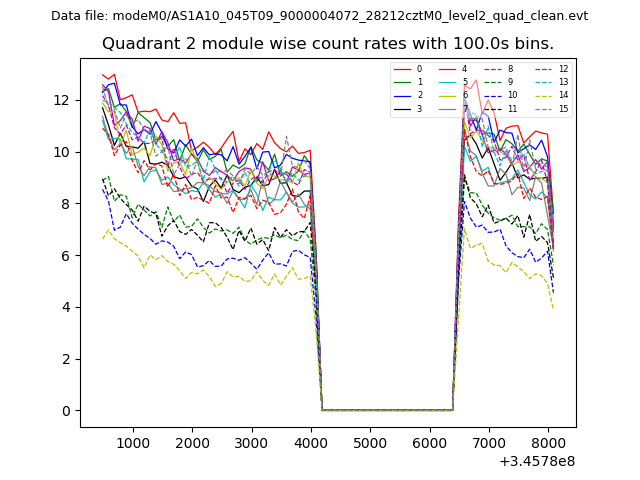
| Module-wise count rates for Quadrant B Data is divided into 100 sec bins |
 |
 |
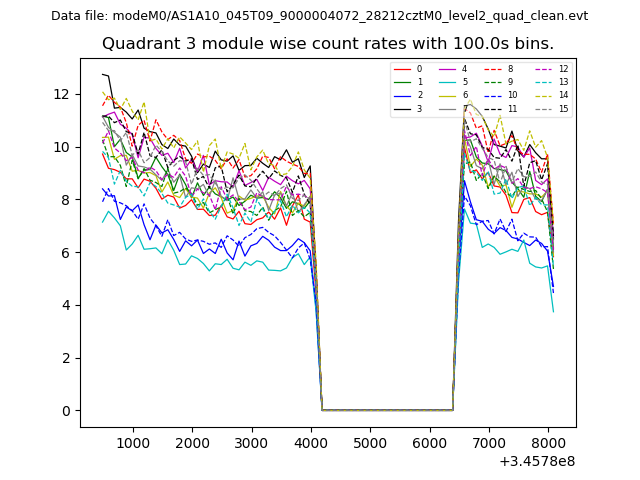
| Module-wise count rates for Quadrant C Data is divided into 100 sec bins |
 |
 |
| Module-wise count rates for Quadrant D Data is divided into 100 sec bins |
 |
 |
| Parameter | Plot |
|---|---|
| CZT HV Monitor | 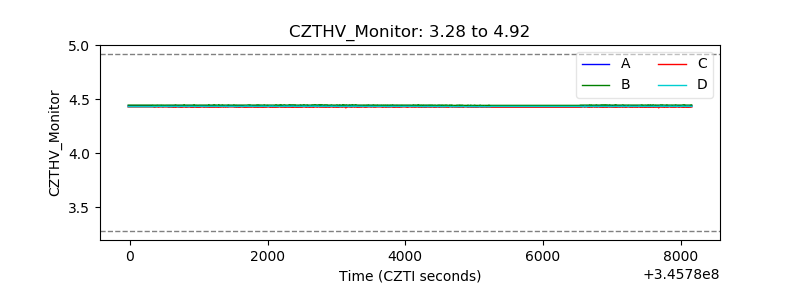 |
| D_VDD | 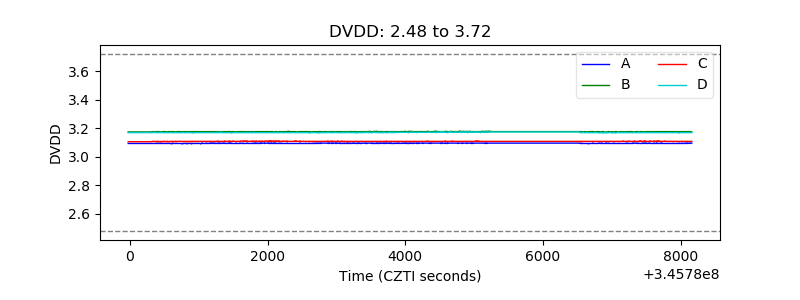 |
| Temperature 1 | 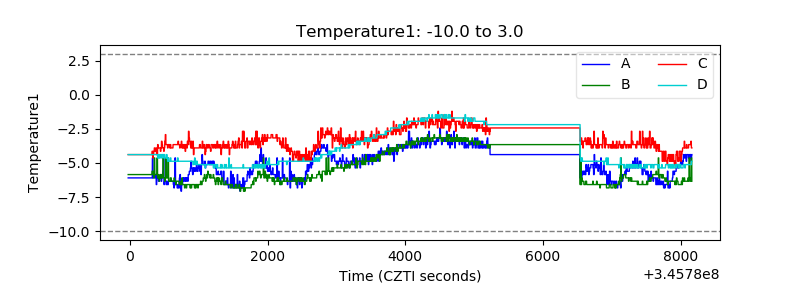 |
| Veto HV Monitor | 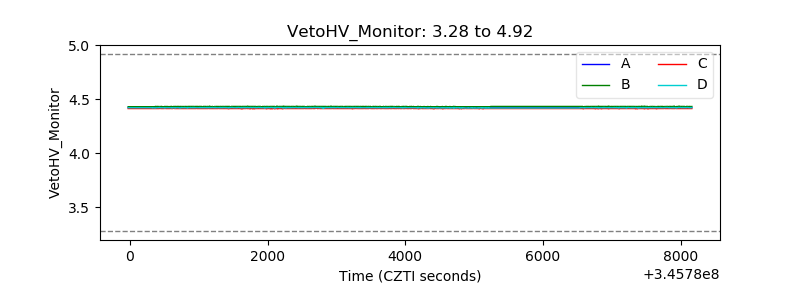 |
| Veto LLD | 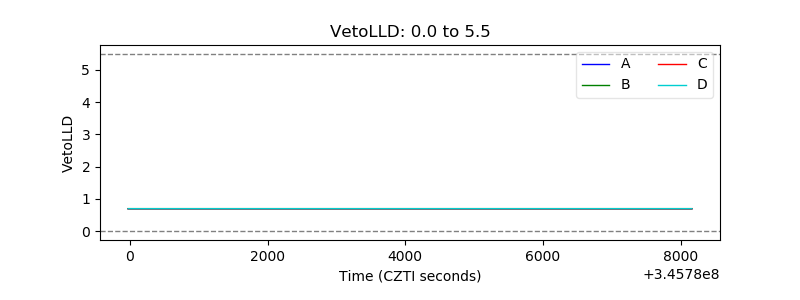 |
| Alpha Counter | 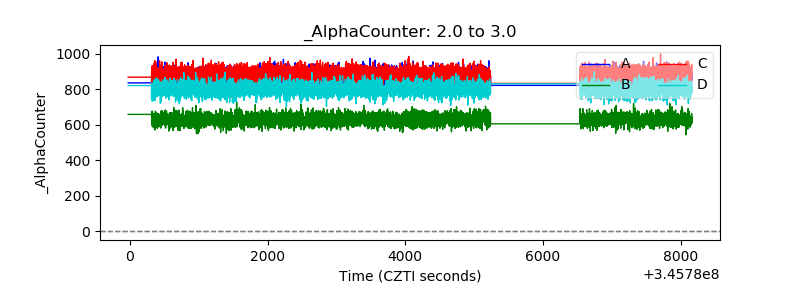 |
| _CPM_Rate | 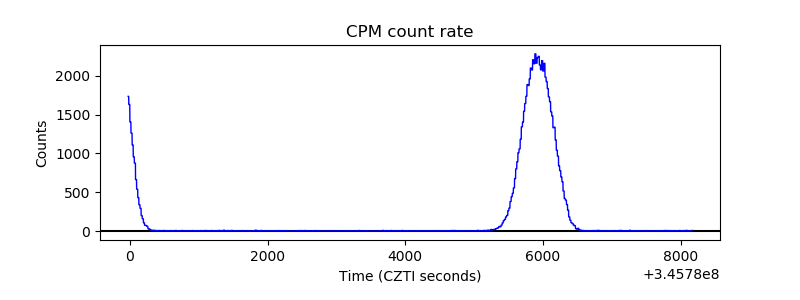 |
| CZT Counter | 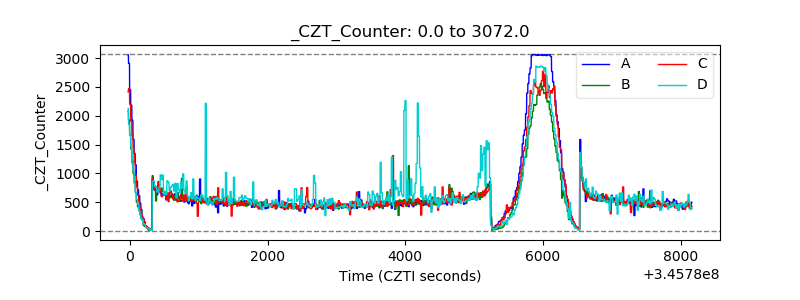 |
| +2.5 Volts monitor |  |
| +5 Volts monitor |  |
| _ROLL_ROT | 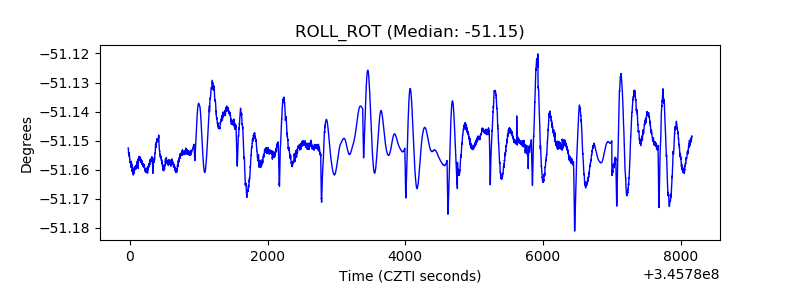 |
| _Roll_DEC | 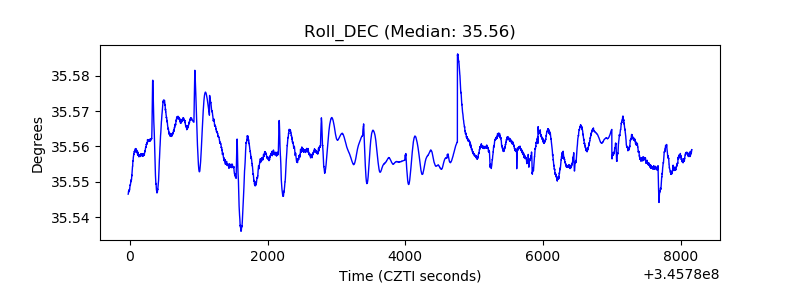 |
| _Roll_RA | 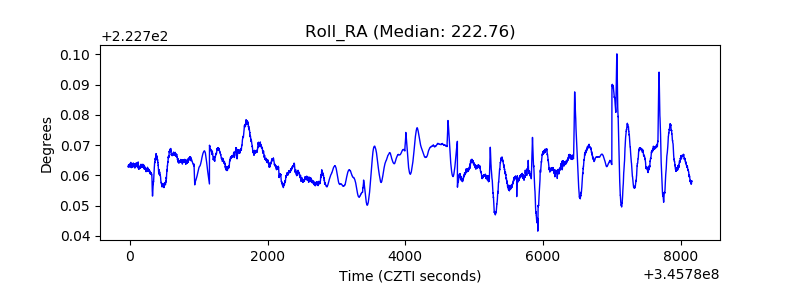 |
| Veto Counter | 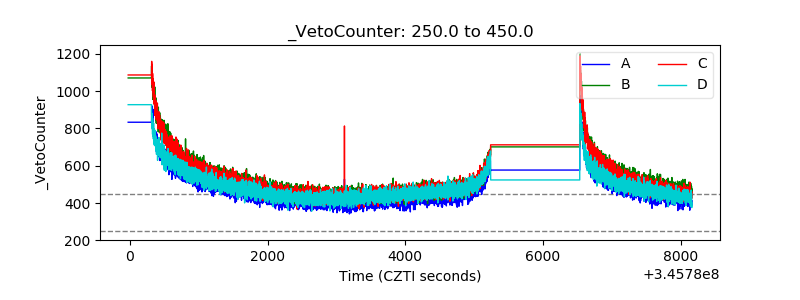 |