| Param | Original file | Final file |
|---|---|---|
| Filename | modeM0/AS1A10_045T09_9000004072_28213cztM0_level2.evt | modeM0/AS1A10_045T09_9000004072_28213cztM0_level2_quad_clean.evt |
| Size (bytes) | 417,821,760 | 91,097,280 |
| Size | 398.5 MB | 86.9 MB |
| Events in quadrant A | 2,885,925 | 597,660 |
| Events in quadrant B | 2,939,592 | 614,833 |
| Events in quadrant C | 2,900,144 | 577,110 |
| Events in quadrant D | 3,522,875 | 552,837 |
| Mode M0 | |||
|---|---|---|---|
| Quadrant | BADHDUFLAG | Total packets | Discarded packets |
| A | 0 | 12398 | 0 |
| B | 0 | 12471 | 0 |
| C | 0 | 12455 | 0 |
| D | 0 | 14463 | 0 |
| Mode M9 | |||
|---|---|---|---|
| Quadrant | BADHDUFLAG | Total packets | Discarded packets |
| A | 0 | 12 | 0 |
| B | 0 | 12 | 0 |
| C | 0 | 12 | 0 |
| D | 0 | 12 | 0 |
| Quadrant | Total seconds | Saturated seconds | Saturation percentage |
|---|---|---|---|
| A | 5964 | 47 | 0.788062% |
| B | 5965 | 82 | 1.374686% |
| C | 5965 | 72 | 1.207041% |
| D | 5965 | 101 | 1.693210% |
Noise dominated data is calculated using 1-second bins in cleaned event files. If a bin has >2000 counts, and if more than 50% of those come from <1% of pixels, then it is considered to be noise-dominated and hence unusable.
| Quadrant | # 1 sec bins | Bins with >0 counts | Bins with >2000 counts | High rate bins dominated by noise | Noise dominated (total time) | Noise dominated (detector-on time) | Marked lightcurve |
|---|---|---|---|---|---|---|---|
| A | 7119 | 5965 | 1 | 1 | 0.01% | 0.02% | 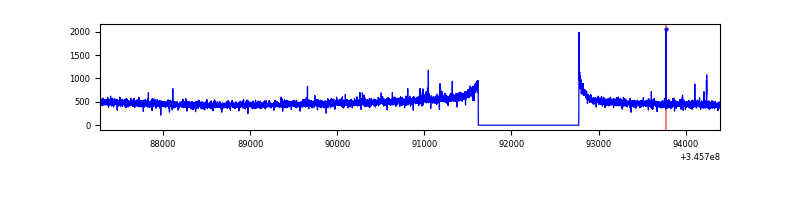 |
| B | 7120 | 5966 | 0 | 0 | 0.00% | 0.00% | 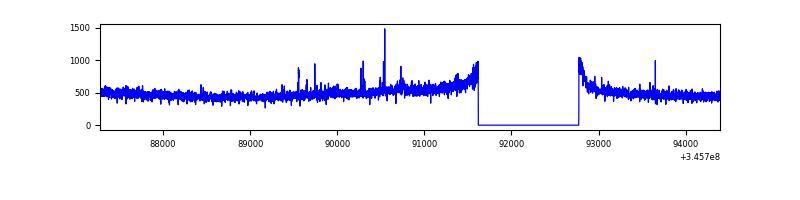 |
| C | 7120 | 5966 | 1 | 1 | 0.01% | 0.02% | 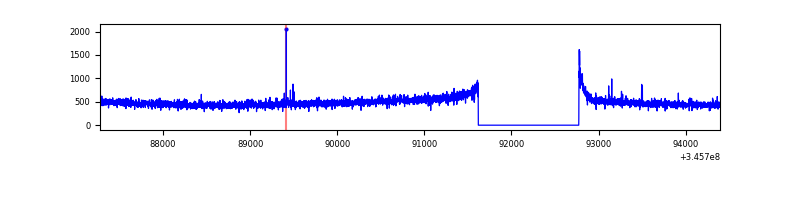 |
| D | 7120 | 5966 | 81 | 81 | 1.14% | 1.36% | 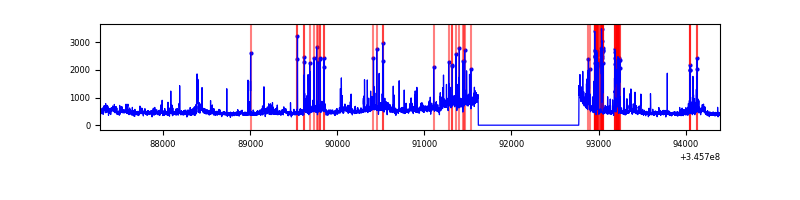 |
Top three noisy pixels from each quadrant. If the there are fewer than three noisy pixels in the level2.evt file, extra rows are filled as -1
| Pixel properties | Quadrant properties | ||||||
|---|---|---|---|---|---|---|---|
| Quadrant | DetID | PixID | Counts | Sigma | Mean | Median | Sigma |
| A | 12 | 96 | 16980 | 109.29 | 743 | 730 | 148.7 |
| A | 13 | 254 | 8147 | 49.88 | 743 | 730 | 148.7 |
| A | 3 | 137 | 7183 | 43.4 | 743 | 730 | 148.7 |
| B | 12 | 111 | 17420 | 118.47 | 740 | 724 | 140.9 |
| B | 11 | 111 | 15768 | 106.75 | 740 | 724 | 140.9 |
| B | 14 | 111 | 15307 | 103.48 | 740 | 724 | 140.9 |
| C | 14 | 238 | 116173 | 693.52 | 706 | 710 | 166.5 |
| C | 15 | 208 | 13810 | 78.68 | 706 | 710 | 166.5 |
| C | 3 | 233 | 13527 | 76.98 | 706 | 710 | 166.5 |
| D | 1 | 52 | 524678 | 3126.88 | 705 | 688 | 167.6 |
| D | 8 | 195 | 173286 | 1029.97 | 705 | 688 | 167.6 |
| D | 5 | 222 | 80850 | 478.36 | 705 | 688 | 167.6 |
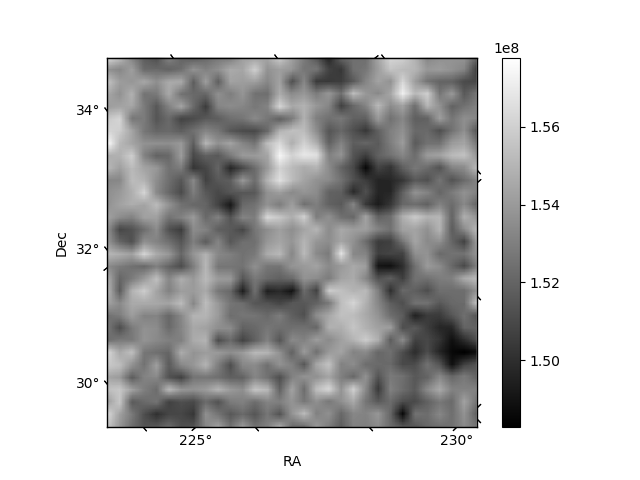
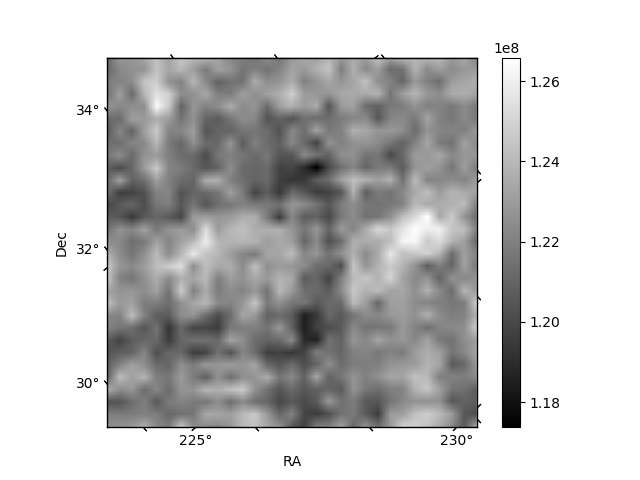
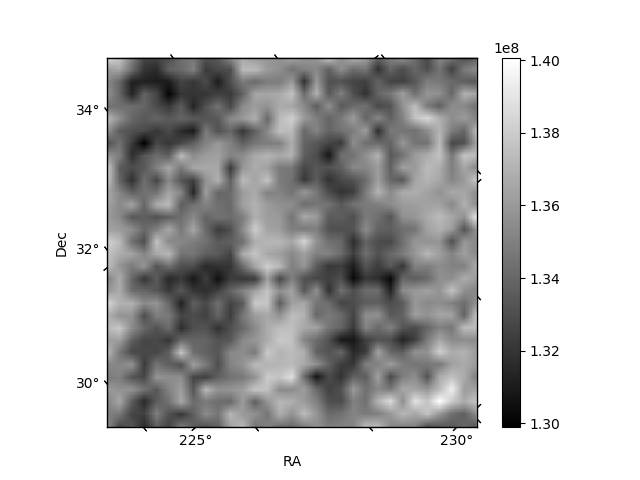
Histogram calculated using DETX and DETY for each event in the final _common_clean file
| Quadrant A | 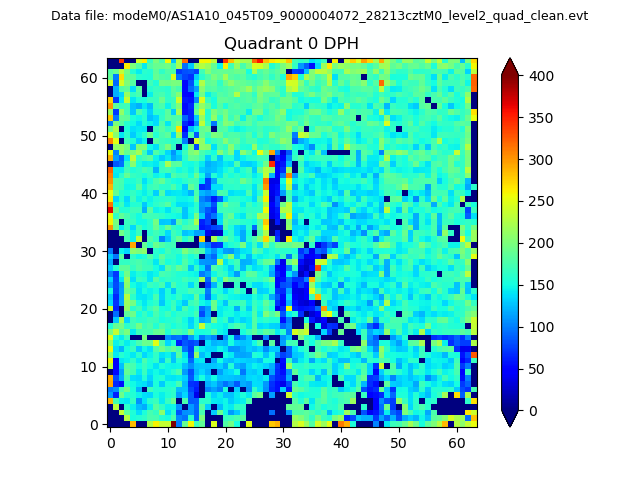 |
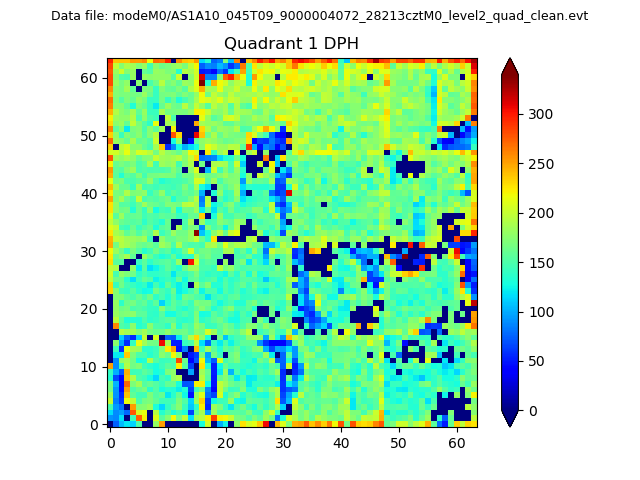 |
Quadrant B |
|---|---|---|---|
| Quadrant D |  |
 |
Quadrant C |
| Plot type | Count rate plots | Images |
|---|---|---|
| Comparison with Poisson distribution Blue bars denote a histogram of data divided into 1 sec bins. Red curve is a Poisson curve with rate = median count rate of data. |
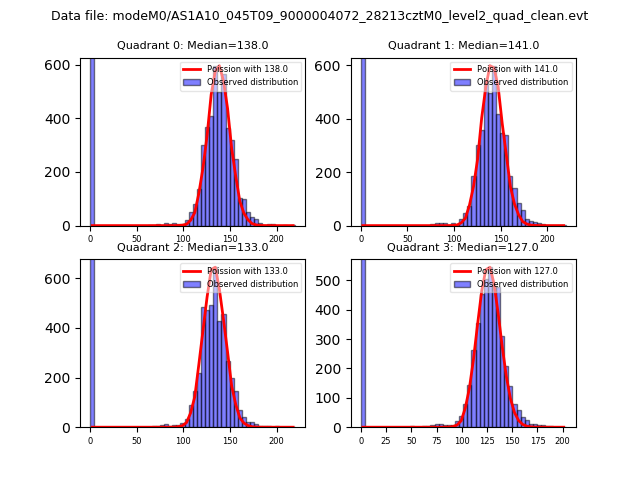 |
 |
| Quadrant-wise count rates Data is divided into 100 sec bins |
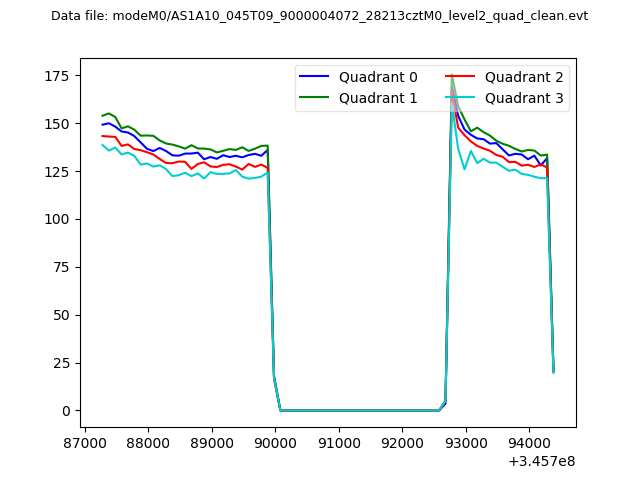 |
|
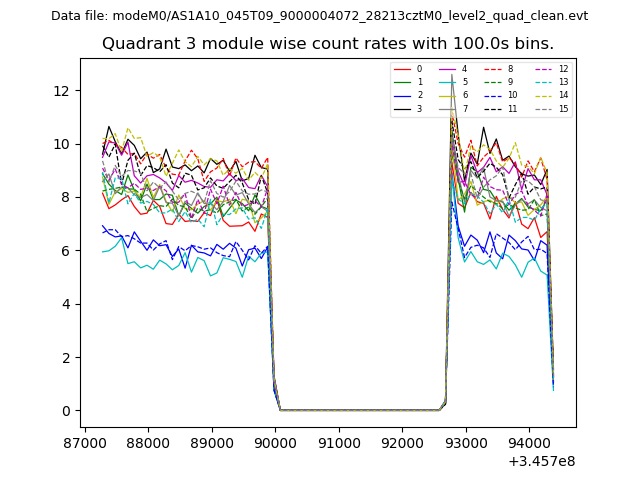
| Module-wise count rates for Quadrant A Data is divided into 100 sec bins |
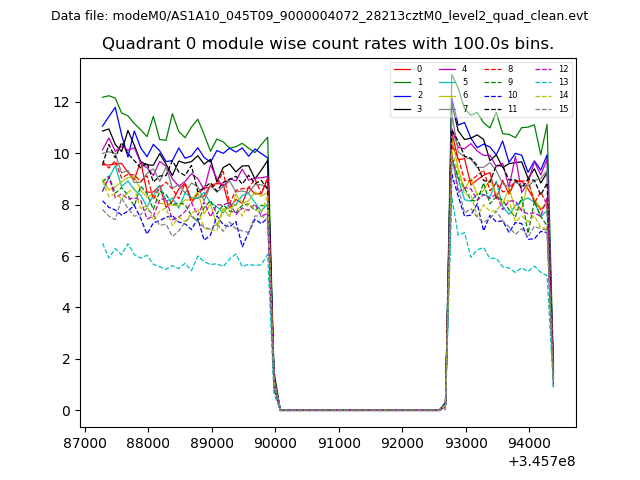 |
 |
| Module-wise count rates for Quadrant B Data is divided into 100 sec bins |
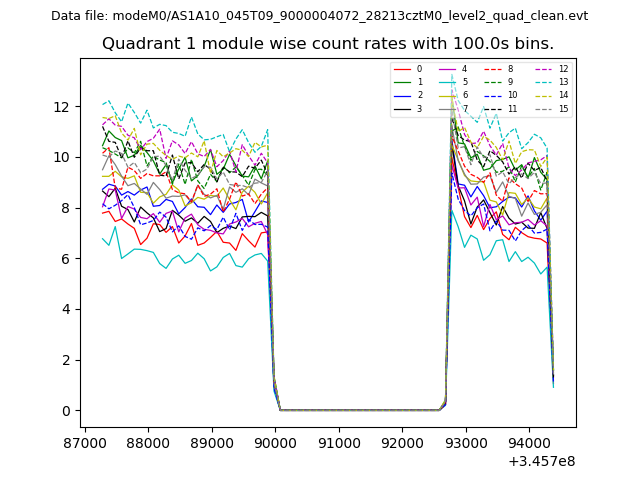 |
 |
| Module-wise count rates for Quadrant C Data is divided into 100 sec bins |
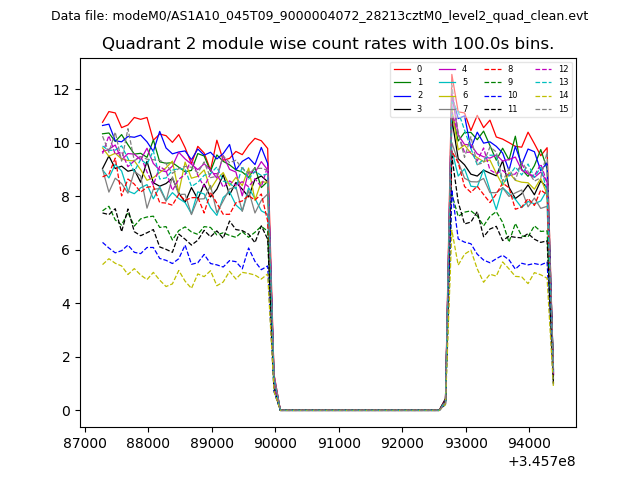 |
 |
| Module-wise count rates for Quadrant D Data is divided into 100 sec bins |
 |
 |
| Parameter | Plot |
|---|---|
| CZT HV Monitor | 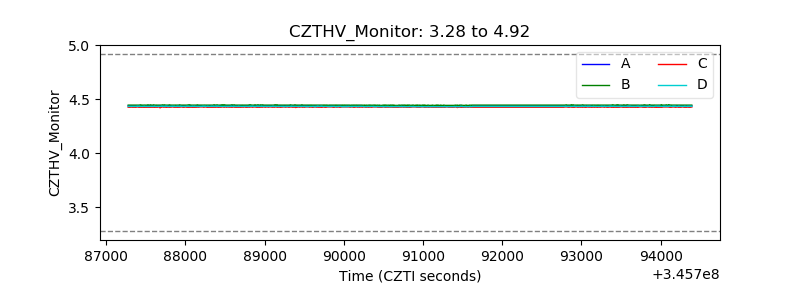 |
| D_VDD | 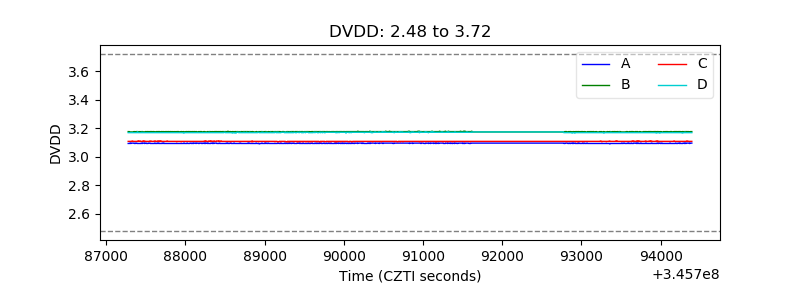 |
| Temperature 1 | 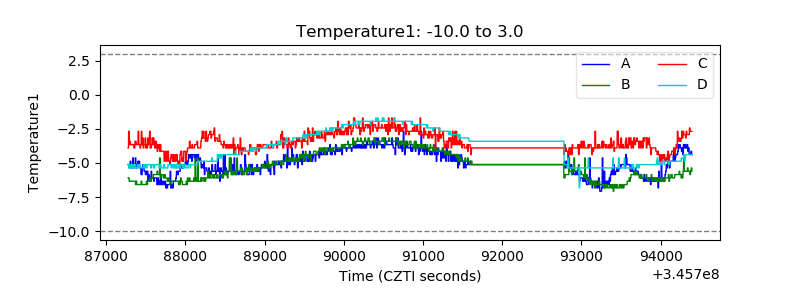 |
| Veto HV Monitor | 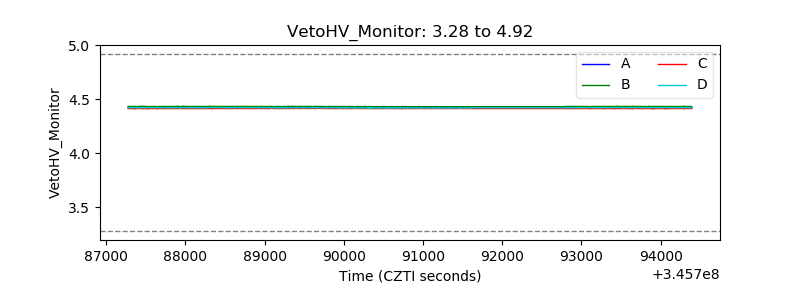 |
| Veto LLD | 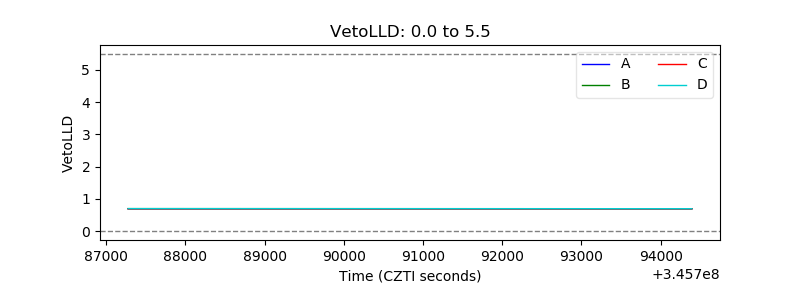 |
| Alpha Counter | 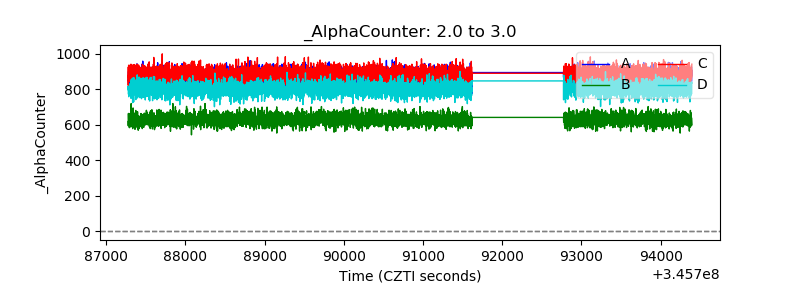 |
| _CPM_Rate | 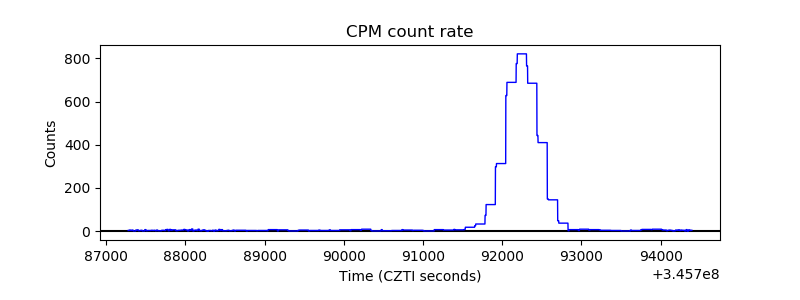 |
| CZT Counter |  |
| +2.5 Volts monitor | 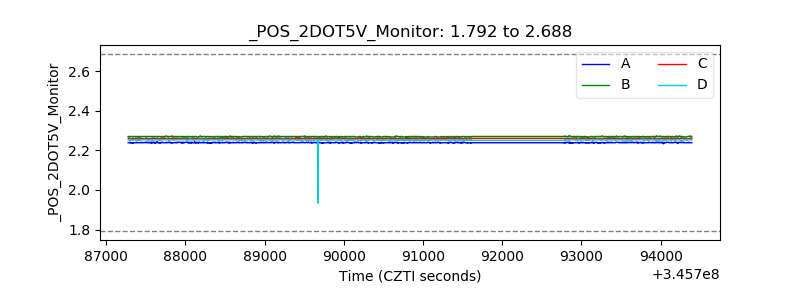 |
| +5 Volts monitor |  |
| _ROLL_ROT | 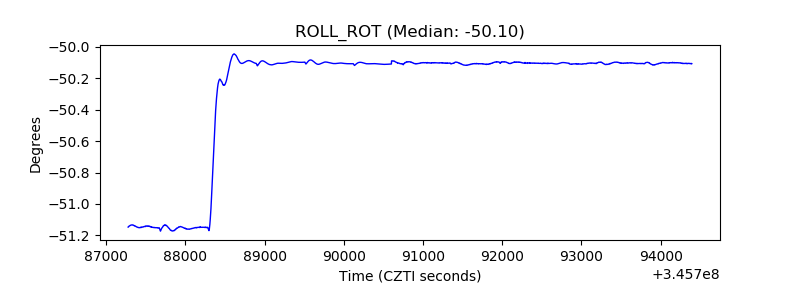 |
| _Roll_DEC | 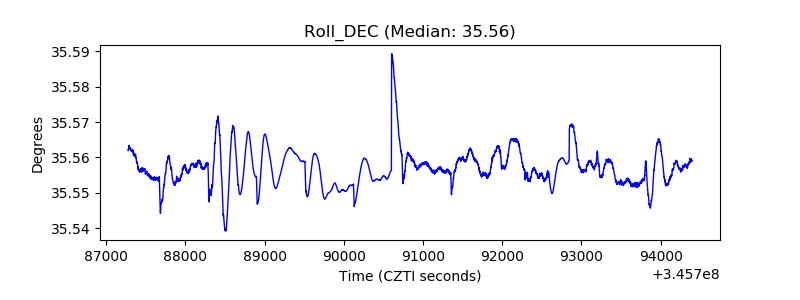 |
| _Roll_RA |  |
| Veto Counter | 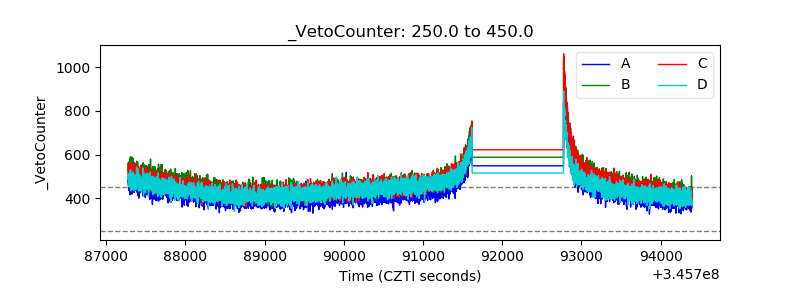 |