| Param | Original file | Final file |
|---|---|---|
| Filename | modeM0/AS1A10_045T09_9000004072_28215cztM0_level2.evt | modeM0/AS1A10_045T09_9000004072_28215cztM0_level2_quad_clean.evt |
| Size (bytes) | 524,583,360 | 94,360,320 |
| Size | 500.3 MB | 90.0 MB |
| Events in quadrant A | 3,252,519 | 606,919 |
| Events in quadrant B | 3,289,339 | 621,441 |
| Events in quadrant C | 3,259,395 | 589,638 |
| Events in quadrant D | 5,614,535 | 555,602 |
| Mode M0 | |||
|---|---|---|---|
| Quadrant | BADHDUFLAG | Total packets | Discarded packets |
| A | 0 | 14252 | 0 |
| B | 0 | 14299 | 0 |
| C | 0 | 14249 | 0 |
| D | 0 | 21375 | 0 |
| Mode M9 | |||
|---|---|---|---|
| Quadrant | BADHDUFLAG | Total packets | Discarded packets |
| A | 0 | 5 | 0 |
| B | 0 | 5 | 0 |
| C | 0 | 5 | 0 |
| D | 0 | 5 | 0 |
| Quadrant | Total seconds | Saturated seconds | Saturation percentage |
|---|---|---|---|
| A | 6949 | 41 | 0.590013% |
| B | 6949 | 69 | 0.992949% |
| C | 6948 | 84 | 1.208981% |
| D | 6948 | 352 | 5.066206% |
Noise dominated data is calculated using 1-second bins in cleaned event files. If a bin has >2000 counts, and if more than 50% of those come from <1% of pixels, then it is considered to be noise-dominated and hence unusable.
| Quadrant | # 1 sec bins | Bins with >0 counts | Bins with >2000 counts | High rate bins dominated by noise | Noise dominated (total time) | Noise dominated (detector-on time) | Marked lightcurve |
|---|---|---|---|---|---|---|---|
| A | 7409 | 6950 | 0 | 0 | 0.00% | 0.00% | 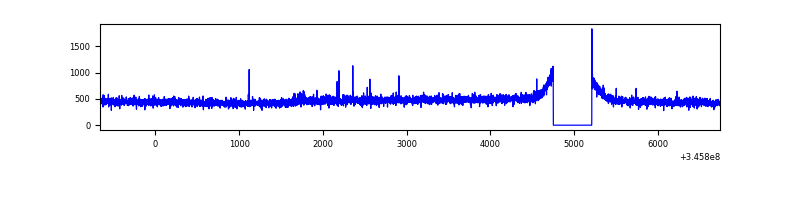 |
| B | 7409 | 6950 | 0 | 0 | 0.00% | 0.00% | 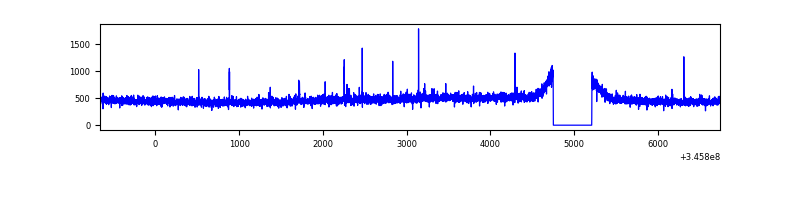 |
| C | 7408 | 6949 | 0 | 0 | 0.00% | 0.00% | 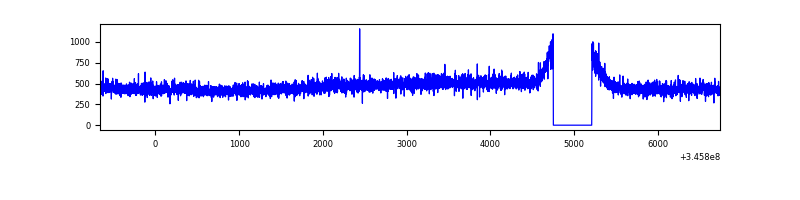 |
| D | 7408 | 6949 | 332 | 332 | 4.48% | 4.78% | 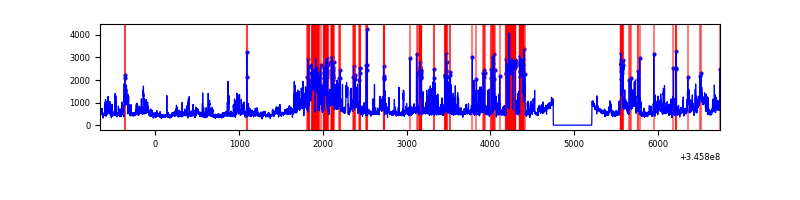 |
Top three noisy pixels from each quadrant. If the there are fewer than three noisy pixels in the level2.evt file, extra rows are filled as -1
| Pixel properties | Quadrant properties | ||||||
|---|---|---|---|---|---|---|---|
| Quadrant | DetID | PixID | Counts | Sigma | Mean | Median | Sigma |
| A | 13 | 254 | 10540 | 56.77 | 838 | 820 | 171.2 |
| A | 12 | 96 | 8661 | 45.79 | 838 | 820 | 171.2 |
| A | 3 | 137 | 8424 | 44.41 | 838 | 820 | 171.2 |
| B | 12 | 111 | 20314 | 121.53 | 831 | 808 | 160.5 |
| B | 11 | 111 | 18552 | 110.55 | 831 | 808 | 160.5 |
| B | 14 | 111 | 17623 | 104.76 | 831 | 808 | 160.5 |
| C | 14 | 238 | 128111 | 670.99 | 799 | 802 | 189.7 |
| C | 3 | 233 | 12959 | 64.07 | 799 | 802 | 189.7 |
| C | 13 | 61 | 5476 | 24.63 | 799 | 802 | 189.7 |
| D | 1 | 52 | 1868327 | 9742.96 | 790 | 769 | 191.7 |
| D | 7 | 80 | 521692 | 2717.63 | 790 | 769 | 191.7 |
| D | 5 | 222 | 117739 | 610.23 | 790 | 769 | 191.7 |
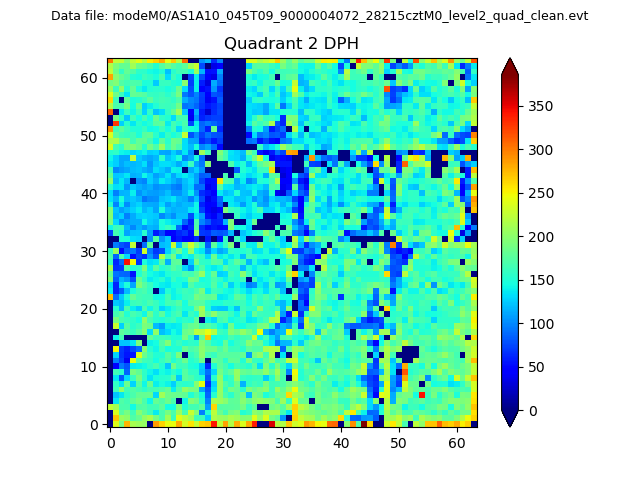
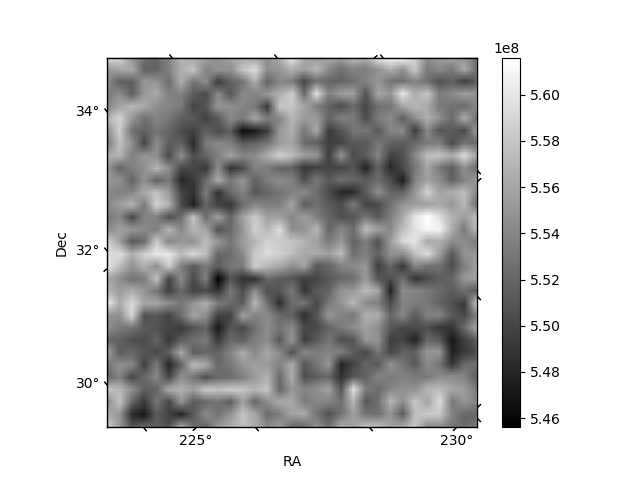
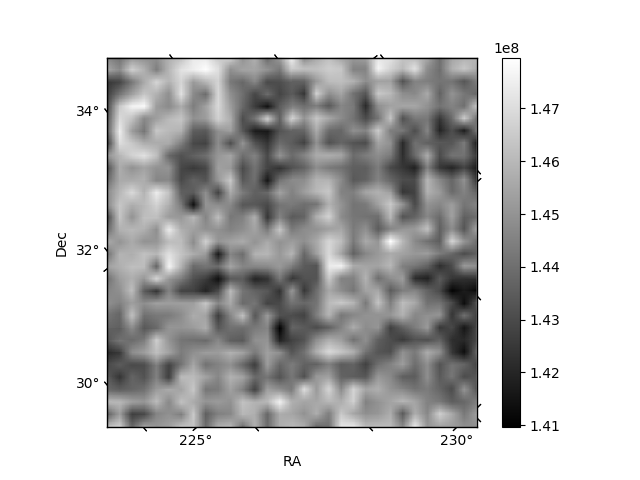
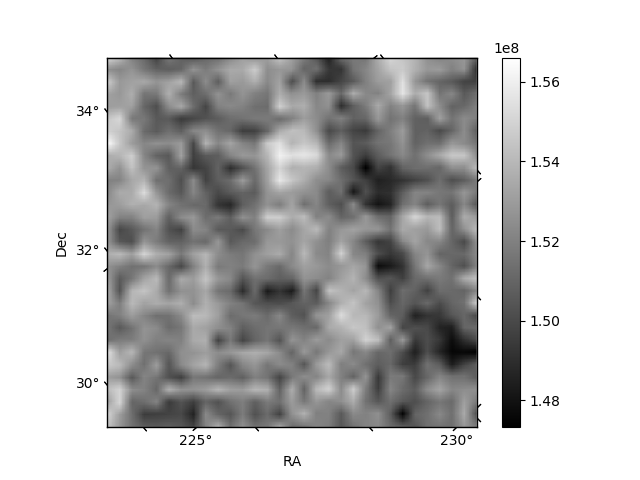
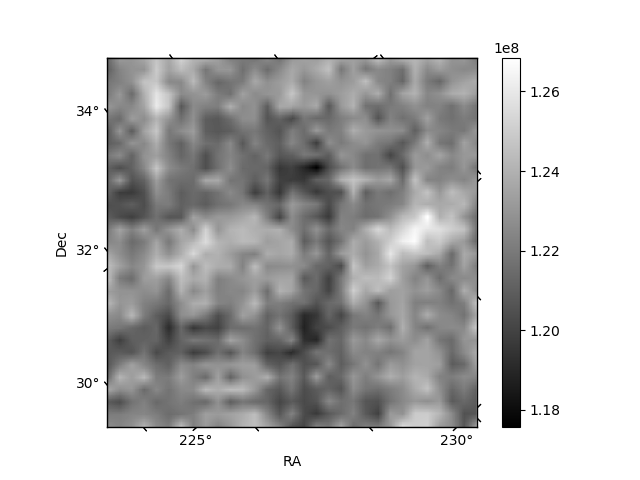
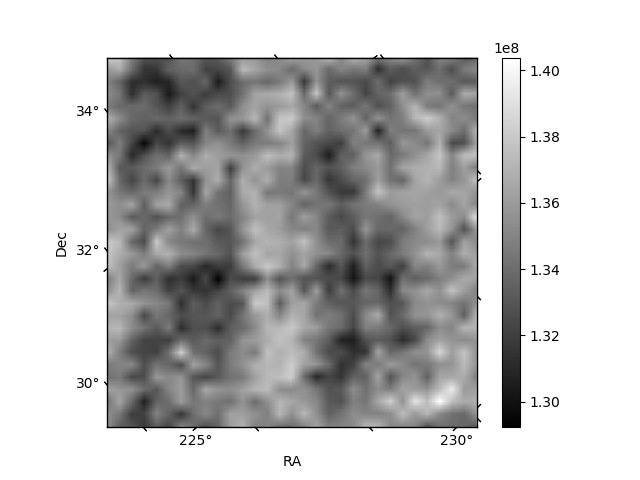
Histogram calculated using DETX and DETY for each event in the final _common_clean file
| Quadrant A | 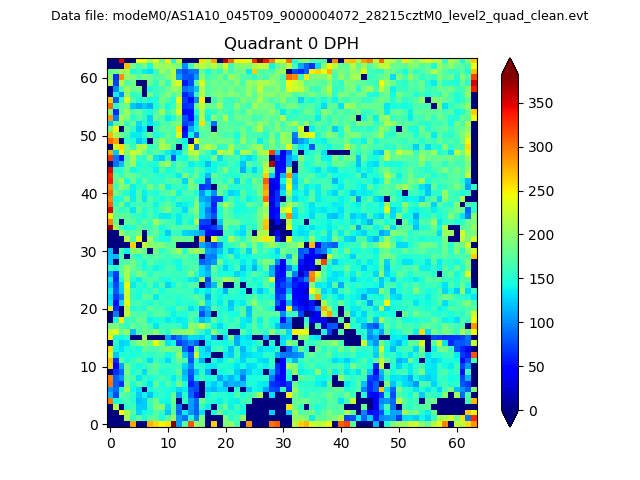 |
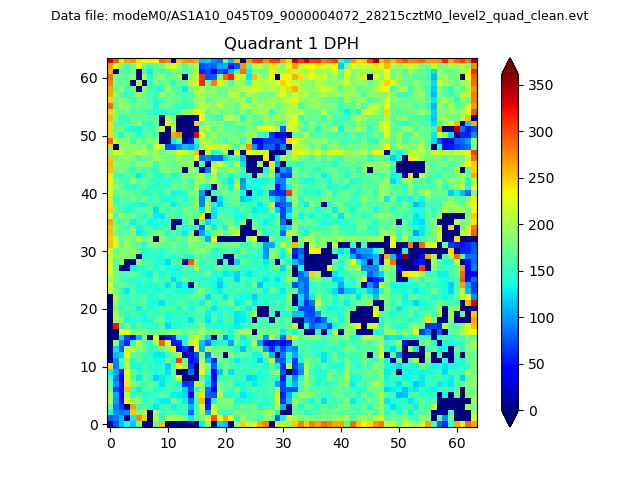 |
Quadrant B |
|---|---|---|---|
| Quadrant D | 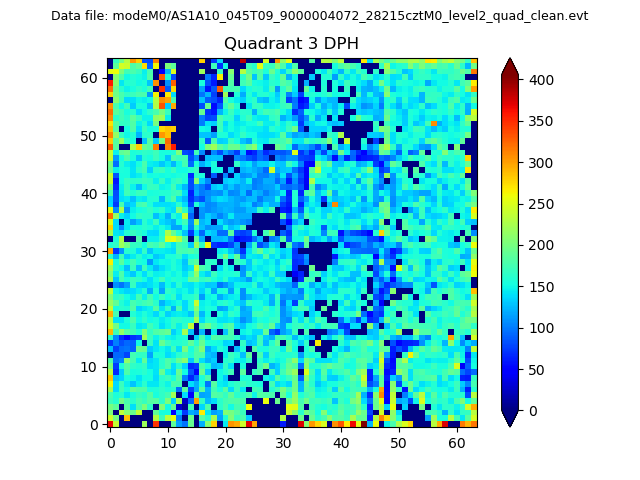 |
 |
Quadrant C |
| Plot type | Count rate plots | Images |
|---|---|---|
| Comparison with Poisson distribution Blue bars denote a histogram of data divided into 1 sec bins. Red curve is a Poisson curve with rate = median count rate of data. |
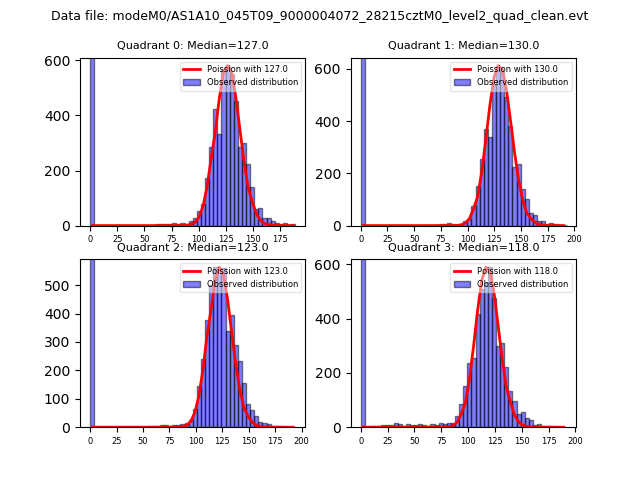 |
 |
| Quadrant-wise count rates Data is divided into 100 sec bins |
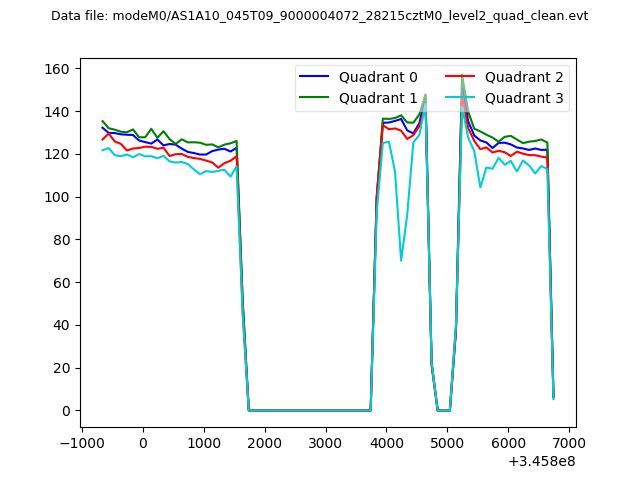 |
|
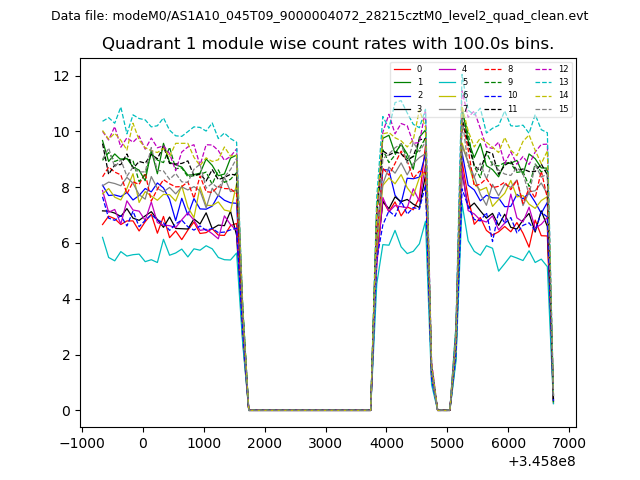
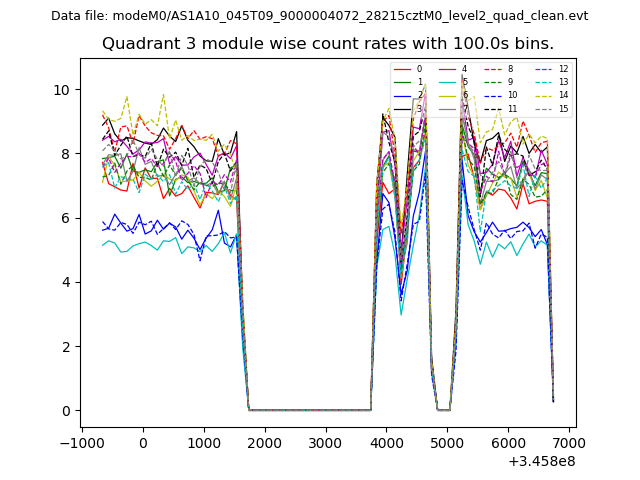
| Module-wise count rates for Quadrant A Data is divided into 100 sec bins |
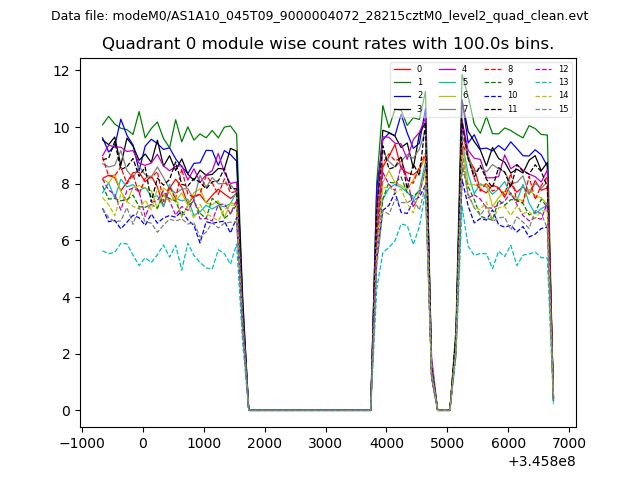 |
 |
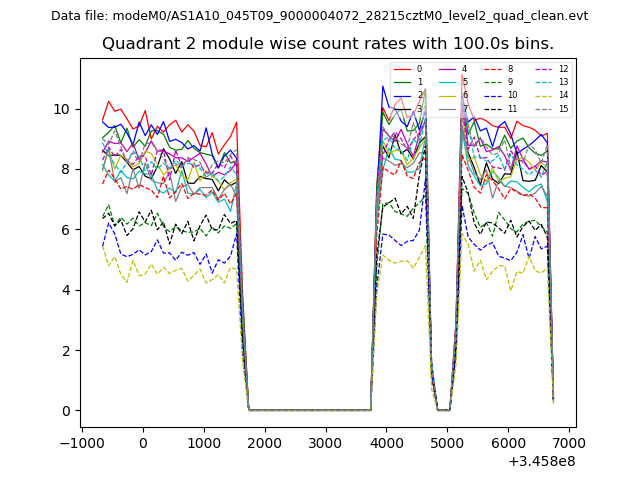
| Module-wise count rates for Quadrant B Data is divided into 100 sec bins |
 |
 |
| Module-wise count rates for Quadrant C Data is divided into 100 sec bins |
 |
 |
| Module-wise count rates for Quadrant D Data is divided into 100 sec bins |
 |
 |
| Parameter | Plot |
|---|---|
| CZT HV Monitor | 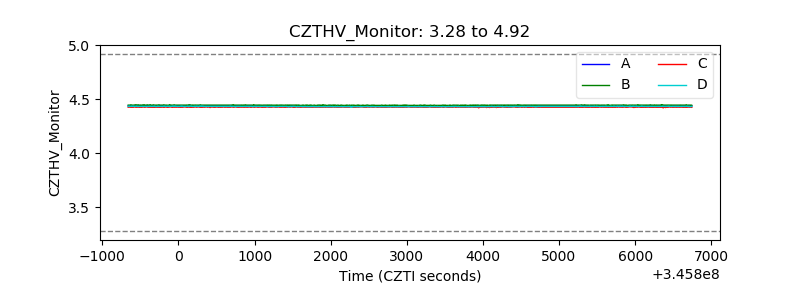 |
| D_VDD | 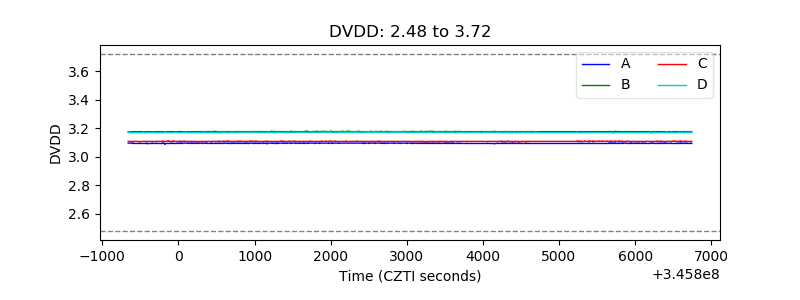 |
| Temperature 1 | 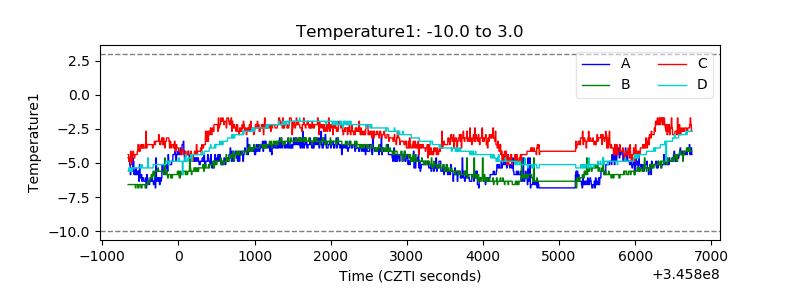 |
| Veto HV Monitor |  |
| Veto LLD | 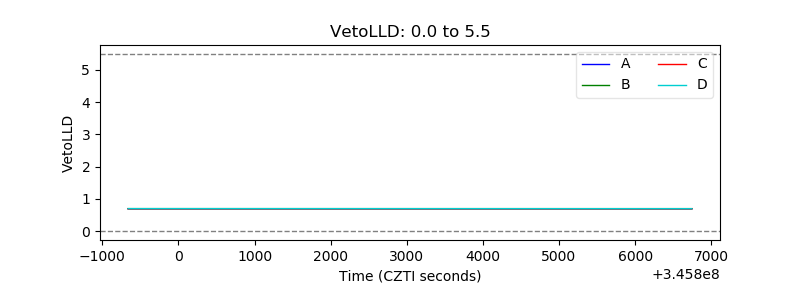 |
| Alpha Counter | 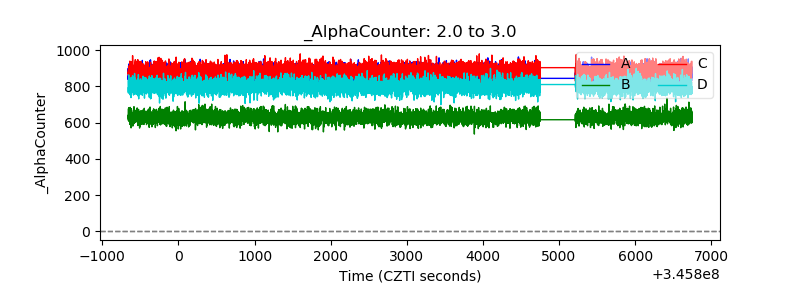 |
| _CPM_Rate | 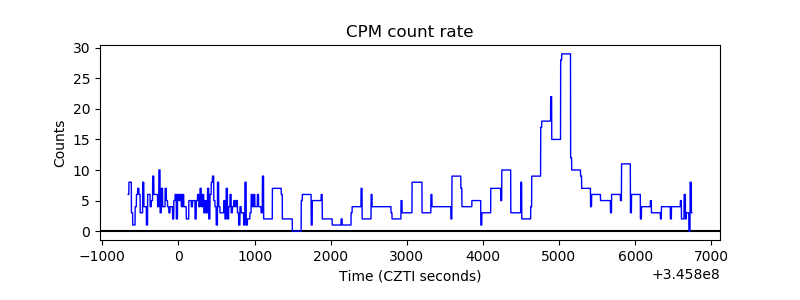 |
| CZT Counter | 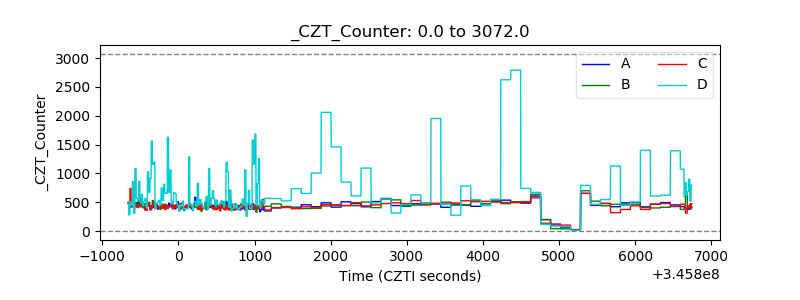 |
| +2.5 Volts monitor |  |
| +5 Volts monitor |  |
| _ROLL_ROT | 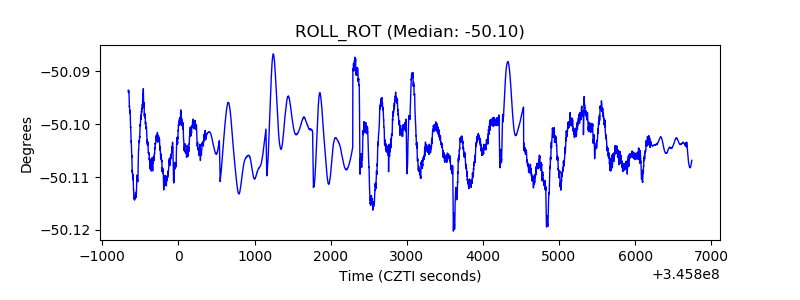 |
| _Roll_DEC | 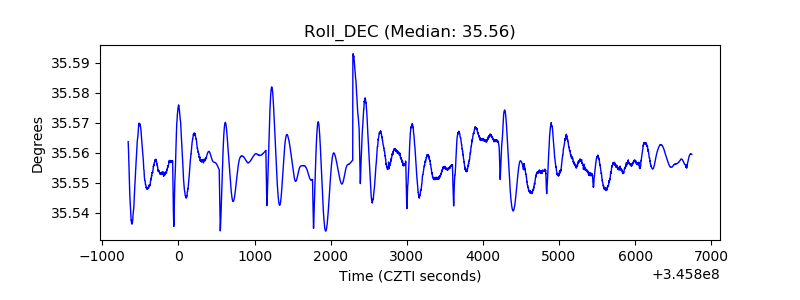 |
| _Roll_RA | 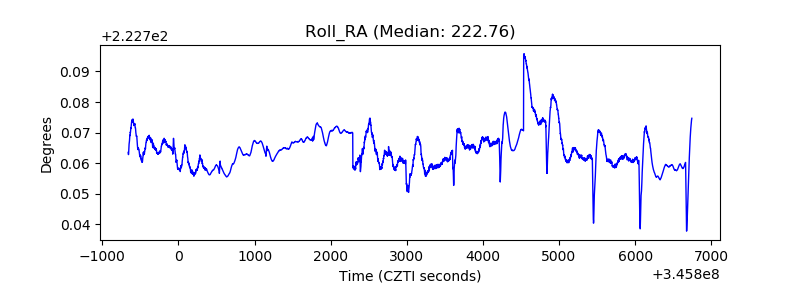 |
| Veto Counter | 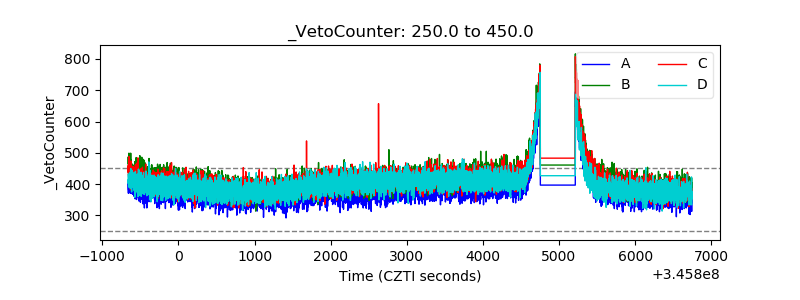 |