| Param | Original file | Final file |
|---|---|---|
| Filename | modeM0/AS1A10_045T09_9000004072_28216cztM0_level2.evt | modeM0/AS1A10_045T09_9000004072_28216cztM0_level2_quad_clean.evt |
| Size (bytes) | 584,438,400 | 100,797,120 |
| Size | 557.4 MB | 96.1 MB |
| Events in quadrant A | 3,440,485 | 651,206 |
| Events in quadrant B | 3,547,187 | 666,358 |
| Events in quadrant C | 3,513,570 | 631,163 |
| Events in quadrant D | 6,700,769 | 592,412 |
| Mode M0 | |||
|---|---|---|---|
| Quadrant | BADHDUFLAG | Total packets | Discarded packets |
| A | 0 | 15114 | 0 |
| B | 0 | 15320 | 0 |
| C | 0 | 15196 | 0 |
| D | 0 | 25072 | 0 |
| Mode M9 | |||
|---|---|---|---|
| Quadrant | BADHDUFLAG | Total packets | Discarded packets |
| A | 0 | 1 | 0 |
| B | 0 | 1 | 0 |
| C | 0 | 1 | 0 |
| D | 0 | 1 | 0 |
| Quadrant | Total seconds | Saturated seconds | Saturation percentage |
|---|---|---|---|
| A | 7336 | 147 | 2.003817% |
| B | 7337 | 177 | 2.412430% |
| C | 7336 | 215 | 2.930752% |
| D | 7336 | 553 | 7.538168% |
Noise dominated data is calculated using 1-second bins in cleaned event files. If a bin has >2000 counts, and if more than 50% of those come from <1% of pixels, then it is considered to be noise-dominated and hence unusable.
| Quadrant | # 1 sec bins | Bins with >0 counts | Bins with >2000 counts | High rate bins dominated by noise | Noise dominated (total time) | Noise dominated (detector-on time) | Marked lightcurve |
|---|---|---|---|---|---|---|---|
| A | 7426 | 7337 | 0 | 0 | 0.00% | 0.00% | 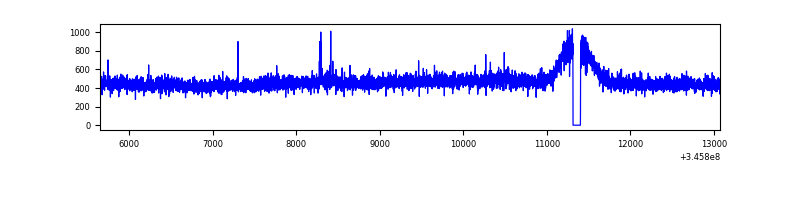 |
| B | 7427 | 7337 | 3 | 3 | 0.04% | 0.04% | 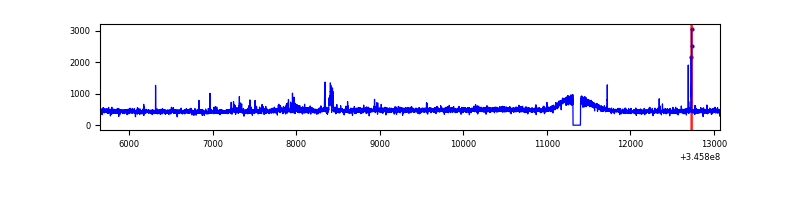 |
| C | 7426 | 7336 | 0 | 0 | 0.00% | 0.00% | 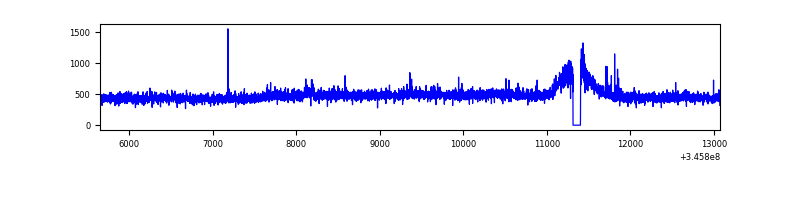 |
| D | 7426 | 7336 | 434 | 434 | 5.84% | 5.92% | 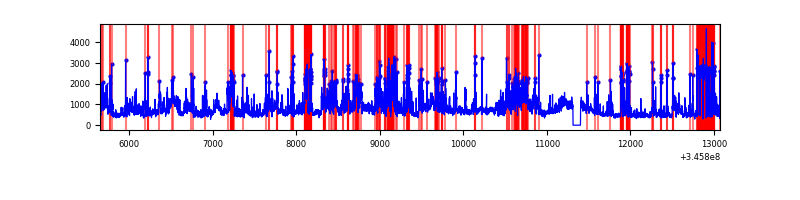 |
Top three noisy pixels from each quadrant. If the there are fewer than three noisy pixels in the level2.evt file, extra rows are filled as -1
| Pixel properties | Quadrant properties | ||||||
|---|---|---|---|---|---|---|---|
| Quadrant | DetID | PixID | Counts | Sigma | Mean | Median | Sigma |
| A | 13 | 254 | 10820 | 55.11 | 888 | 868 | 180.6 |
| A | 3 | 137 | 9034 | 45.22 | 888 | 868 | 180.6 |
| A | 12 | 16 | 8995 | 45.0 | 888 | 868 | 180.6 |
| B | 10 | 246 | 26850 | 152.72 | 879 | 856 | 170.2 |
| B | 0 | 183 | 26719 | 151.95 | 879 | 856 | 170.2 |
| B | 12 | 111 | 21828 | 123.22 | 879 | 856 | 170.2 |
| C | 14 | 238 | 134556 | 668.49 | 847 | 849 | 200.0 |
| C | 3 | 233 | 34652 | 169.0 | 847 | 849 | 200.0 |
| C | 1 | 16 | 17600 | 83.75 | 847 | 849 | 200.0 |
| D | 1 | 52 | 2283952 | 11397.2 | 839 | 818 | 200.3 |
| D | 7 | 80 | 681478 | 3397.79 | 839 | 818 | 200.3 |
| D | 5 | 222 | 263948 | 1313.52 | 839 | 818 | 200.3 |
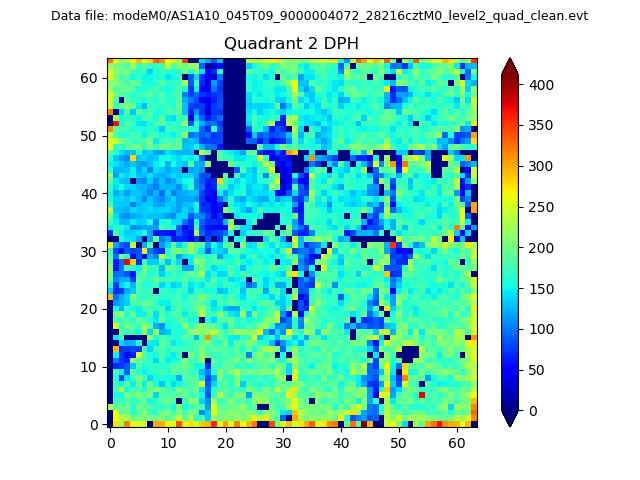
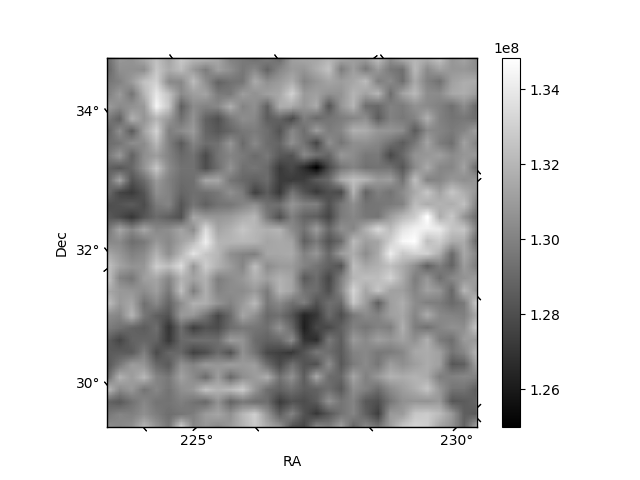
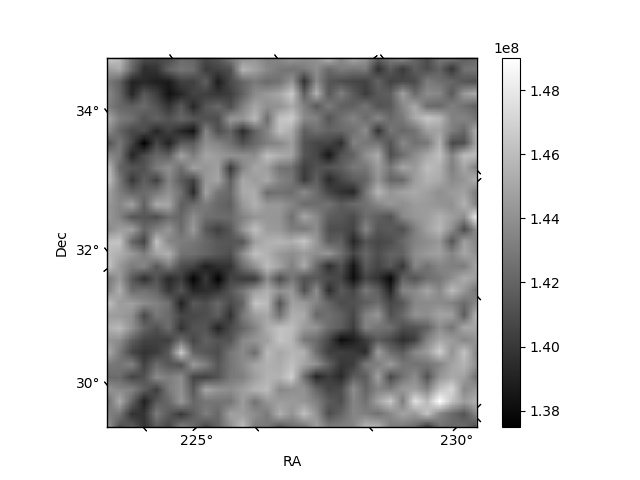
Histogram calculated using DETX and DETY for each event in the final _common_clean file
| Quadrant A | 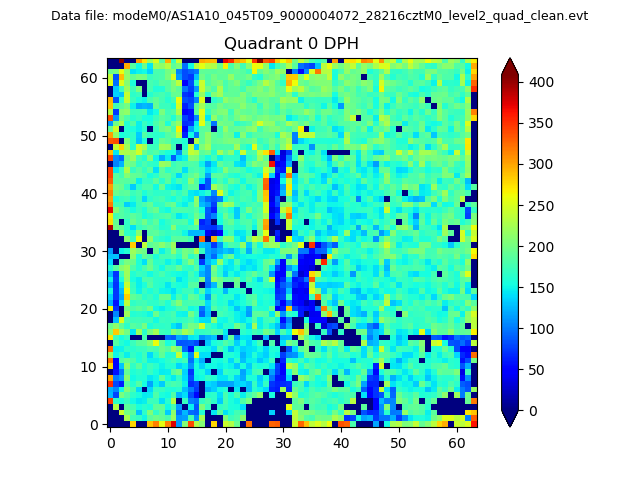 |
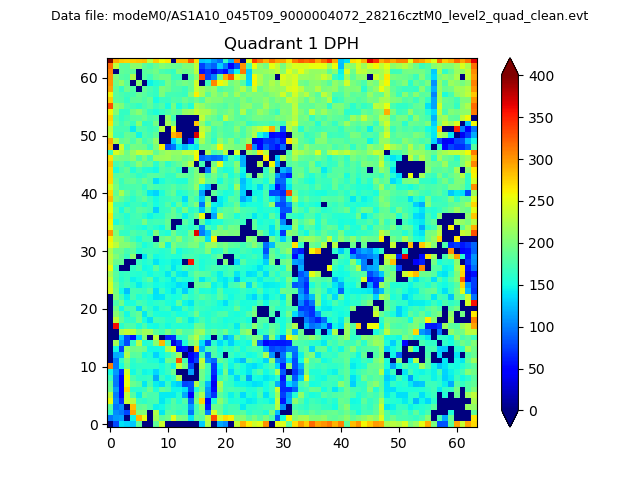 |
Quadrant B |
|---|---|---|---|
| Quadrant D | 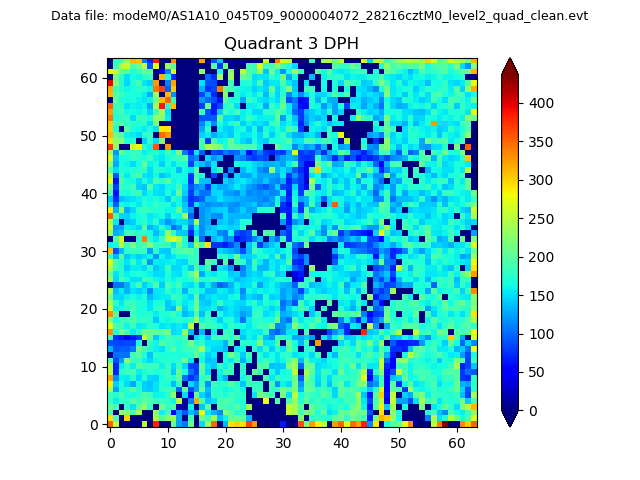 |
 |
Quadrant C |
| Plot type | Count rate plots | Images |
|---|---|---|
| Comparison with Poisson distribution Blue bars denote a histogram of data divided into 1 sec bins. Red curve is a Poisson curve with rate = median count rate of data. |
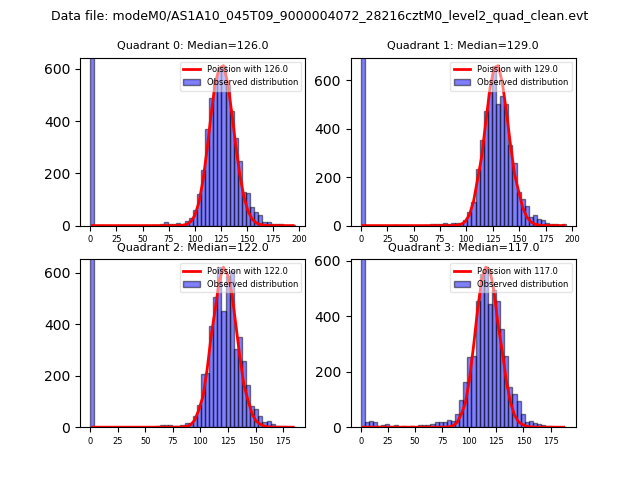 |
 |
| Quadrant-wise count rates Data is divided into 100 sec bins |
 |
|
| Module-wise count rates for Quadrant A Data is divided into 100 sec bins |
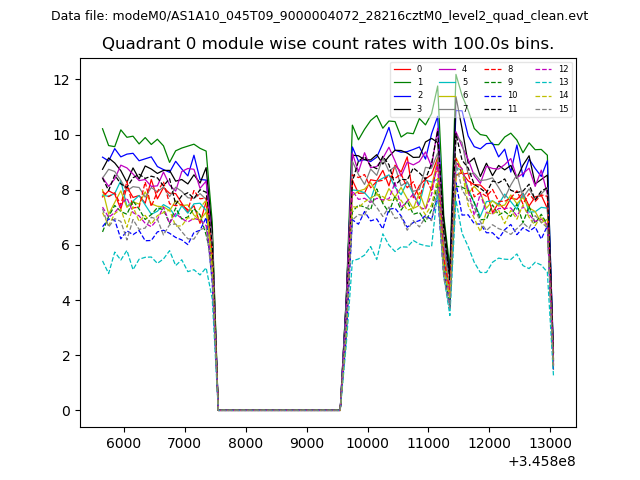 |
 |
| Module-wise count rates for Quadrant B Data is divided into 100 sec bins |
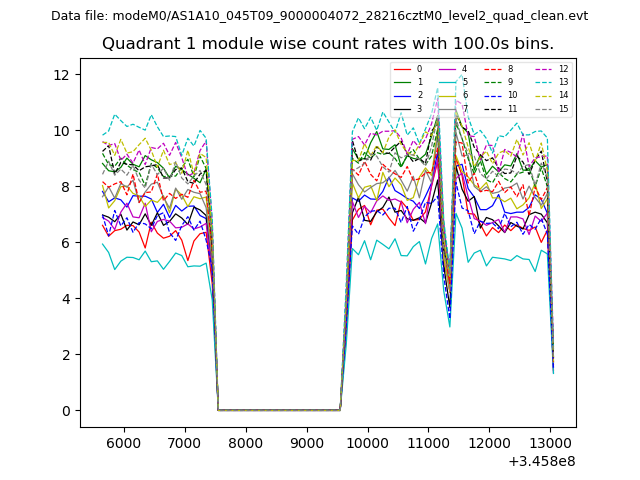 |
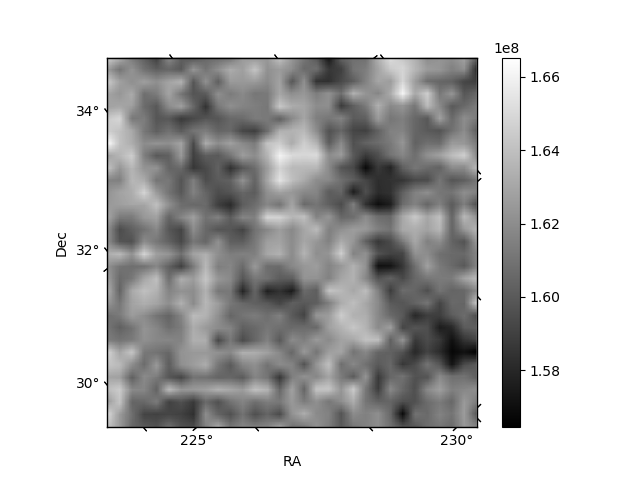 |
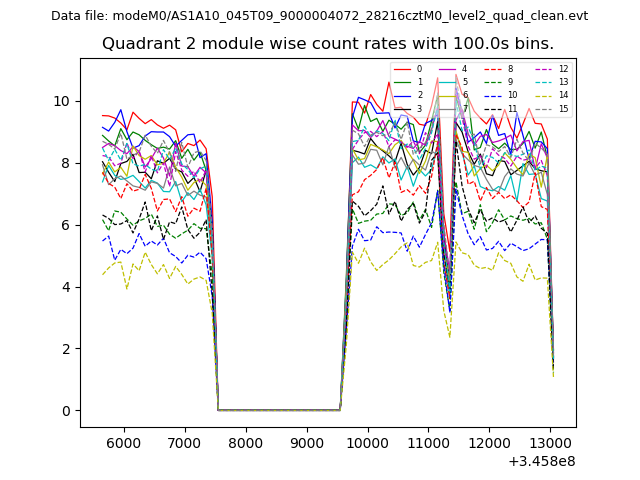
| Module-wise count rates for Quadrant C Data is divided into 100 sec bins |
 |
 |
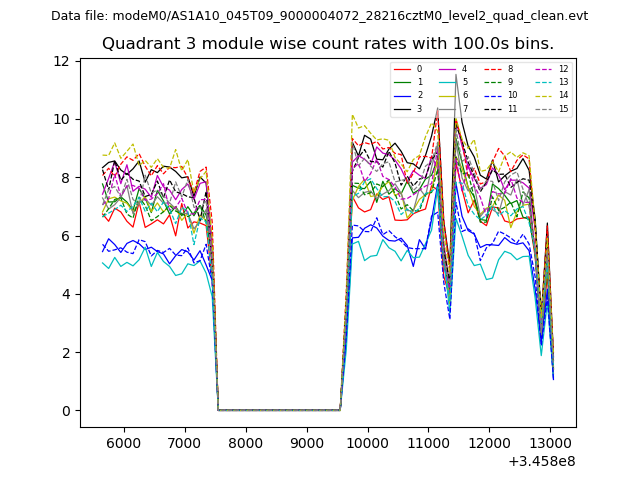
| Module-wise count rates for Quadrant D Data is divided into 100 sec bins |
 |
 |
| Parameter | Plot |
|---|---|
| CZT HV Monitor | 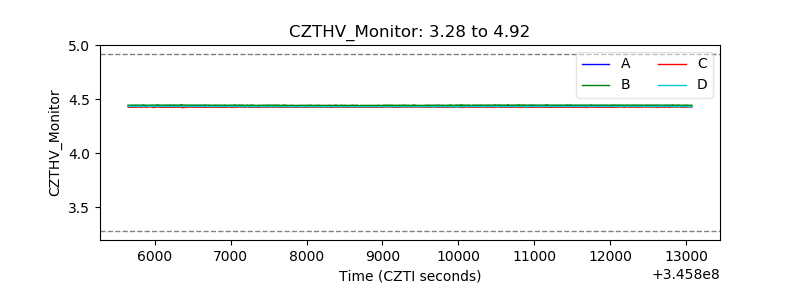 |
| D_VDD | 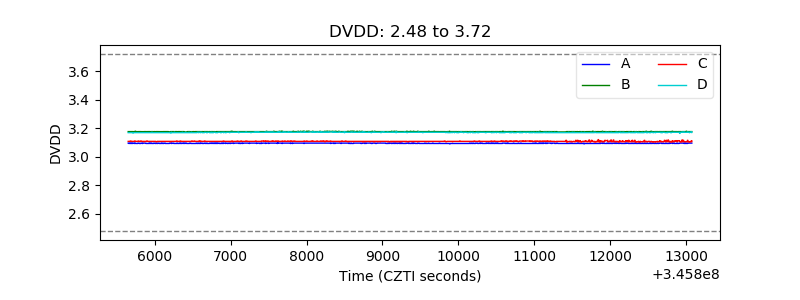 |
| Temperature 1 | 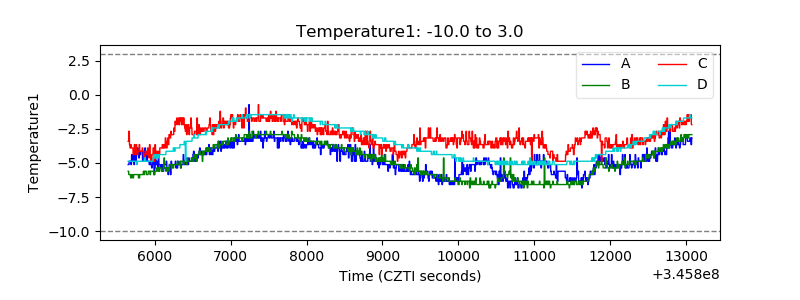 |
| Veto HV Monitor | 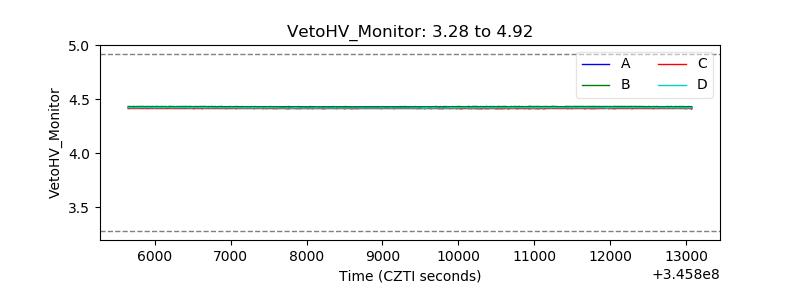 |
| Veto LLD | 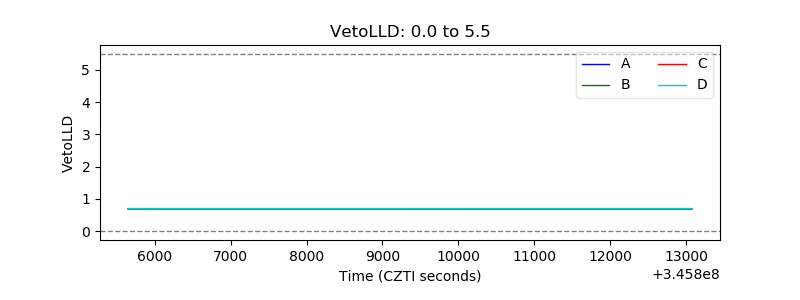 |
| Alpha Counter |  |
| _CPM_Rate |  |
| CZT Counter |  |
| +2.5 Volts monitor |  |
| +5 Volts monitor |  |
| _ROLL_ROT | 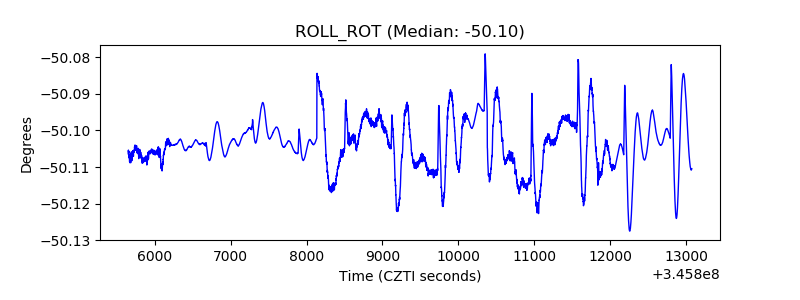 |
| _Roll_DEC | 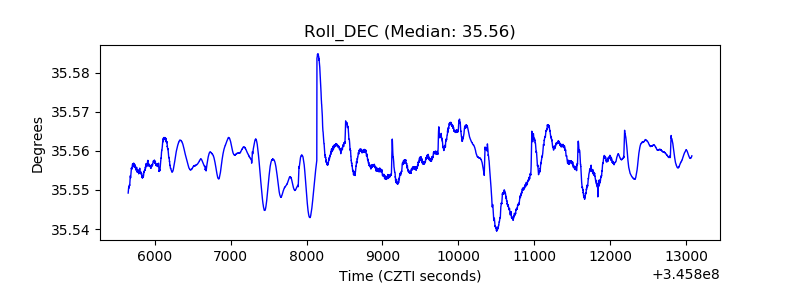 |
| _Roll_RA |  |
| Veto Counter | 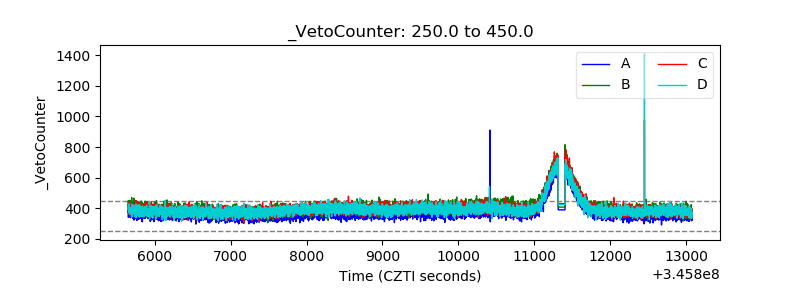 |