| Param | Original file | Final file |
|---|---|---|
| Filename | modeM0/AS1A10_045T09_9000004072_28217cztM0_level2.evt | modeM0/AS1A10_045T09_9000004072_28217cztM0_level2_quad_clean.evt |
| Size (bytes) | 547,666,560 | 92,911,680 |
| Size | 522.3 MB | 88.6 MB |
| Events in quadrant A | 3,323,420 | 596,616 |
| Events in quadrant B | 3,436,740 | 605,740 |
| Events in quadrant C | 3,576,718 | 574,779 |
| Events in quadrant D | 5,763,489 | 537,987 |
| Mode M0 | |||
|---|---|---|---|
| Quadrant | BADHDUFLAG | Total packets | Discarded packets |
| A | 0 | 14602 | 0 |
| B | 0 | 14810 | 0 |
| C | 0 | 15131 | 0 |
| D | 0 | 21866 | 0 |
| Mode M9 | |||
|---|---|---|---|
| Quadrant | BADHDUFLAG | Total packets | Discarded packets |
| A | 0 | 2 | 0 |
| B | 0 | 2 | 0 |
| C | 0 | 2 | 0 |
| D | 0 | 2 | 0 |
| Quadrant | Total seconds | Saturated seconds | Saturation percentage |
|---|---|---|---|
| A | 7150 | 132 | 1.846154% |
| B | 7151 | 159 | 2.223465% |
| C | 7151 | 171 | 2.391274% |
| D | 7151 | 737 | 10.306251% |
Noise dominated data is calculated using 1-second bins in cleaned event files. If a bin has >2000 counts, and if more than 50% of those come from <1% of pixels, then it is considered to be noise-dominated and hence unusable.
| Quadrant | # 1 sec bins | Bins with >0 counts | Bins with >2000 counts | High rate bins dominated by noise | Noise dominated (total time) | Noise dominated (detector-on time) | Marked lightcurve |
|---|---|---|---|---|---|---|---|
| A | 7385 | 7150 | 1 | 1 | 0.01% | 0.01% | 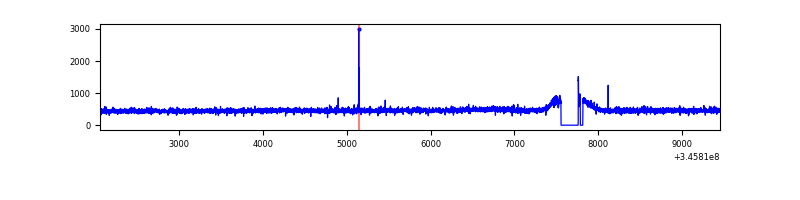 |
| B | 7386 | 7151 | 10 | 10 | 0.14% | 0.14% | 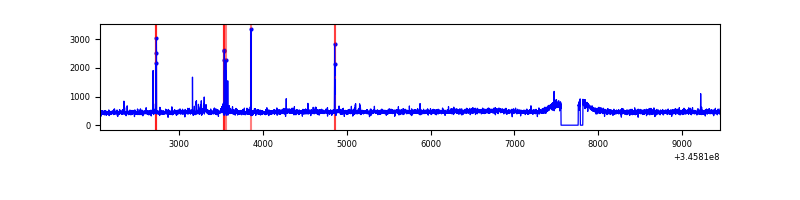 |
| C | 7386 | 7151 | 4 | 4 | 0.05% | 0.06% | 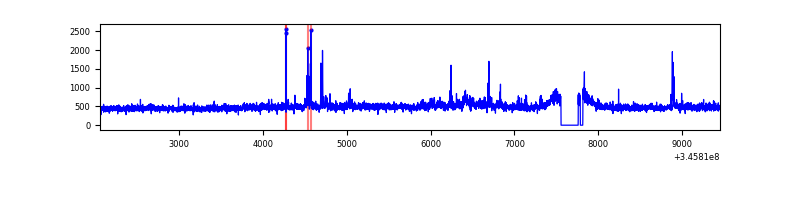 |
| D | 7386 | 7151 | 561 | 561 | 7.60% | 7.85% | 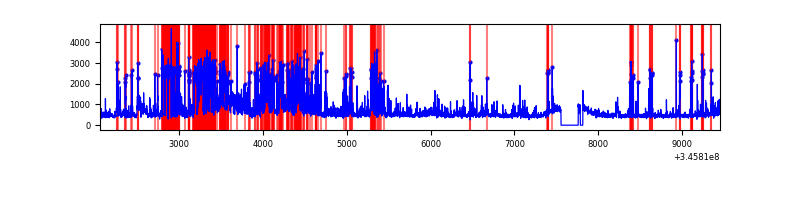 |
Top three noisy pixels from each quadrant. If the there are fewer than three noisy pixels in the level2.evt file, extra rows are filled as -1
| Pixel properties | Quadrant properties | ||||||
|---|---|---|---|---|---|---|---|
| Quadrant | DetID | PixID | Counts | Sigma | Mean | Median | Sigma |
| A | 13 | 254 | 10484 | 55.15 | 858 | 837 | 174.9 |
| A | 12 | 96 | 9882 | 51.71 | 858 | 837 | 174.9 |
| A | 3 | 137 | 8762 | 45.3 | 858 | 837 | 174.9 |
| B | 0 | 183 | 31542 | 187.21 | 849 | 827 | 164.1 |
| B | 12 | 111 | 20887 | 122.27 | 849 | 827 | 164.1 |
| B | 11 | 111 | 19102 | 111.39 | 849 | 827 | 164.1 |
| C | 3 | 233 | 198497 | 1021.37 | 819 | 822 | 193.5 |
| C | 14 | 238 | 130284 | 668.92 | 819 | 822 | 193.5 |
| C | 9 | 221 | 21008 | 104.3 | 819 | 822 | 193.5 |
| D | 1 | 52 | 2105890 | 10999.56 | 798 | 775 | 191.4 |
| D | 2 | 250 | 188840 | 982.67 | 798 | 775 | 191.4 |
| D | 8 | 195 | 177451 | 923.16 | 798 | 775 | 191.4 |
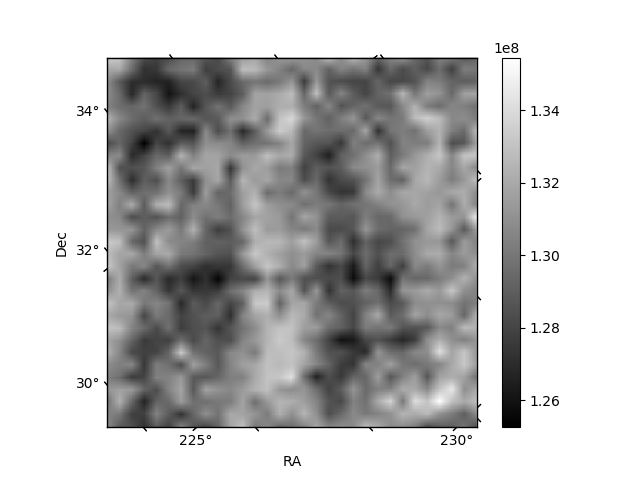
Histogram calculated using DETX and DETY for each event in the final _common_clean file
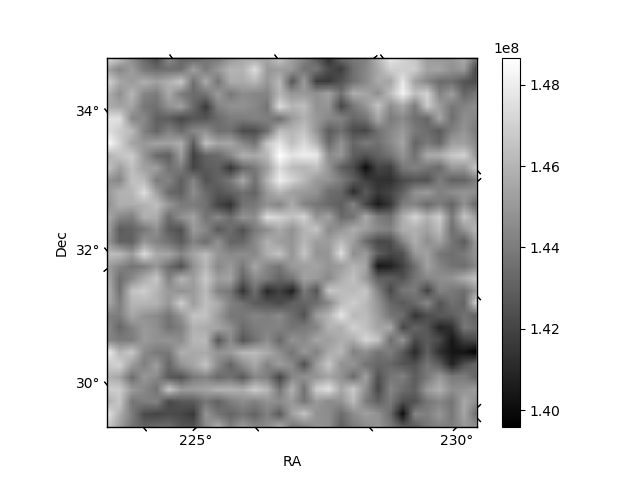
| Quadrant A | 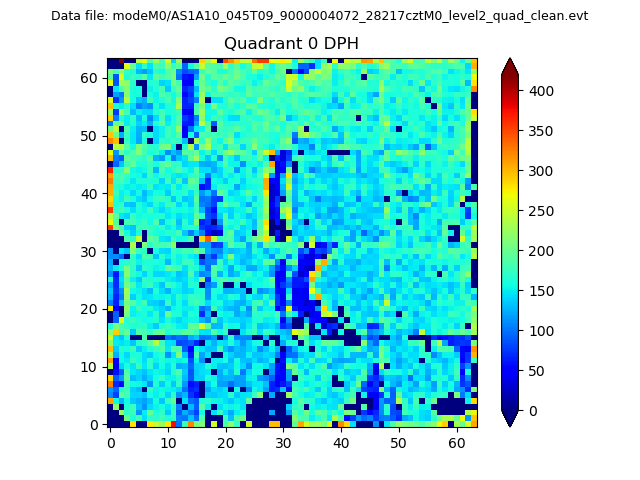 |
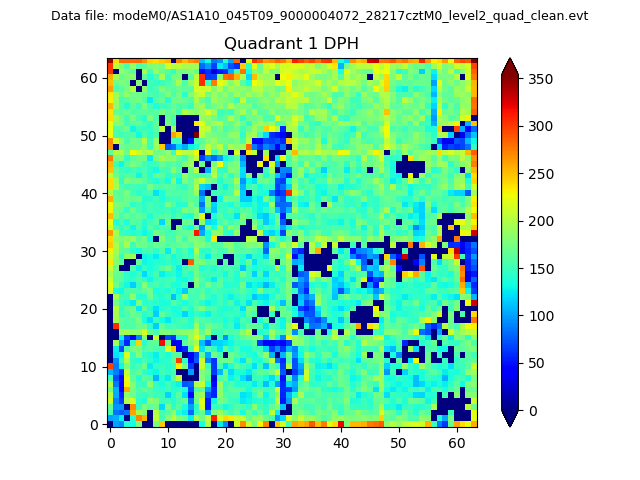 |
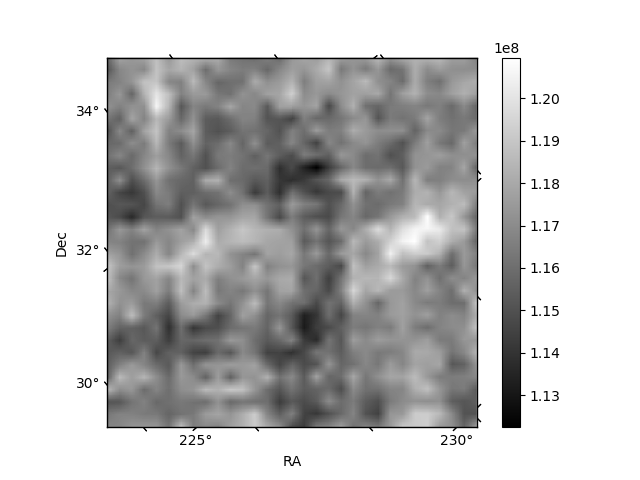
Quadrant B |
|---|---|---|---|
| Quadrant D | 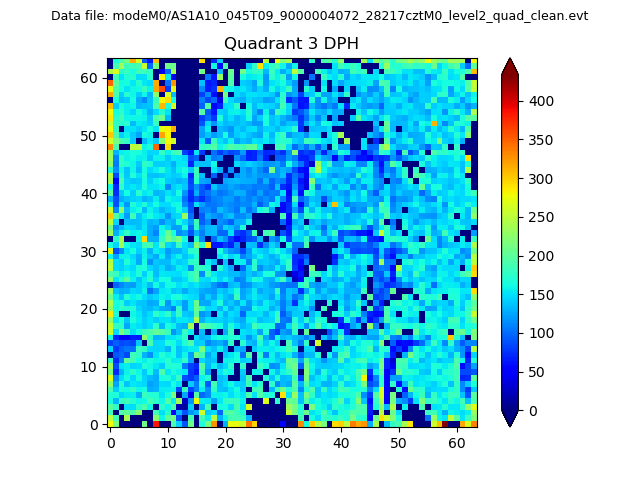 |
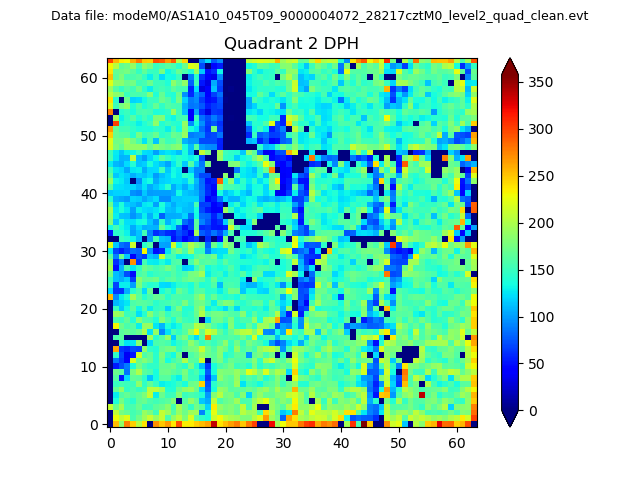 |
Quadrant C |
| Plot type | Count rate plots | Images |
|---|---|---|
| Comparison with Poisson distribution Blue bars denote a histogram of data divided into 1 sec bins. Red curve is a Poisson curve with rate = median count rate of data. |
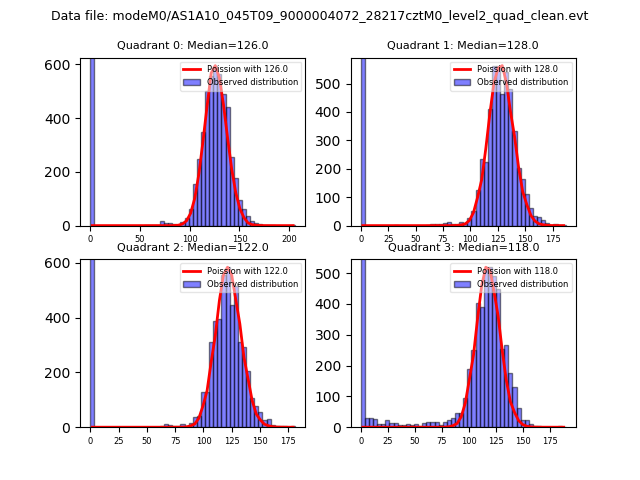 |
 |
| Quadrant-wise count rates Data is divided into 100 sec bins |
 |
|
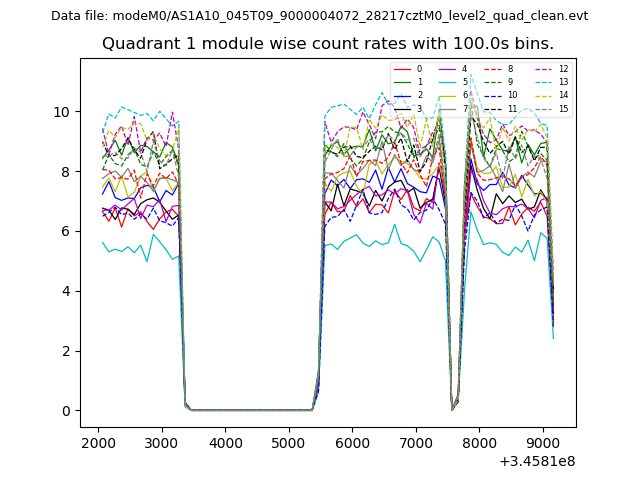
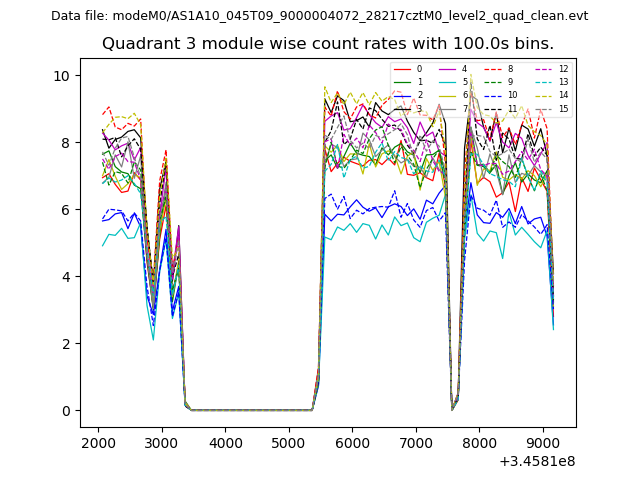
| Module-wise count rates for Quadrant A Data is divided into 100 sec bins |
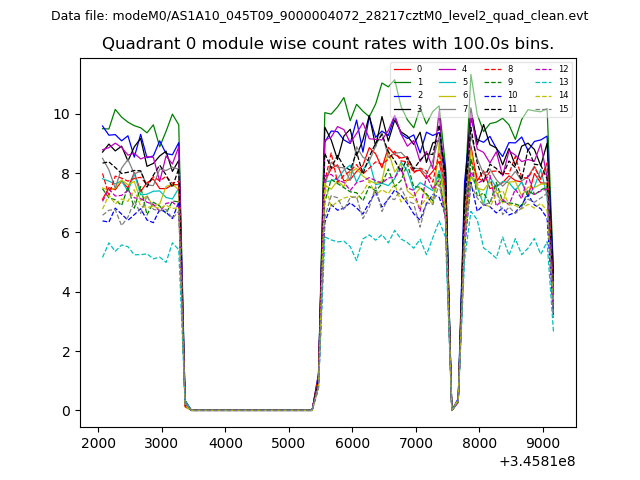 |
 |
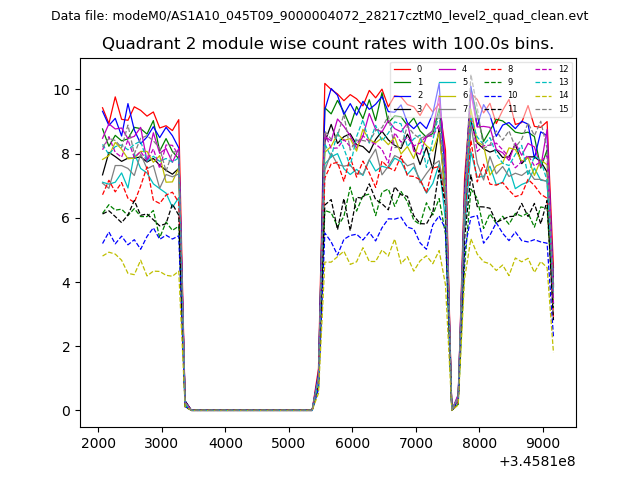
| Module-wise count rates for Quadrant B Data is divided into 100 sec bins |
 |
 |
| Module-wise count rates for Quadrant C Data is divided into 100 sec bins |
 |
 |
| Module-wise count rates for Quadrant D Data is divided into 100 sec bins |
 |
 |
| Parameter | Plot |
|---|---|
| CZT HV Monitor | 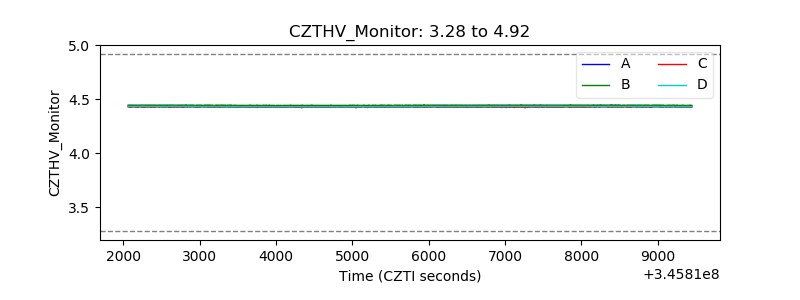 |
| D_VDD | 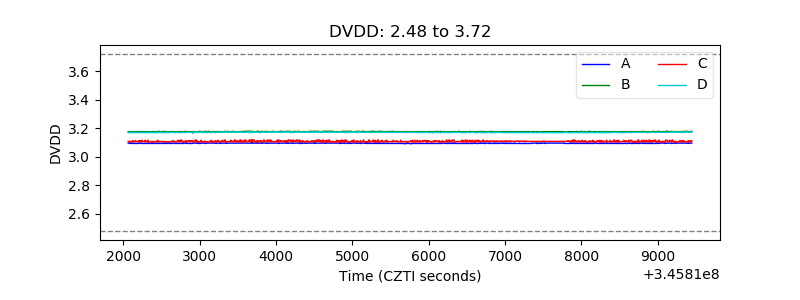 |
| Temperature 1 | 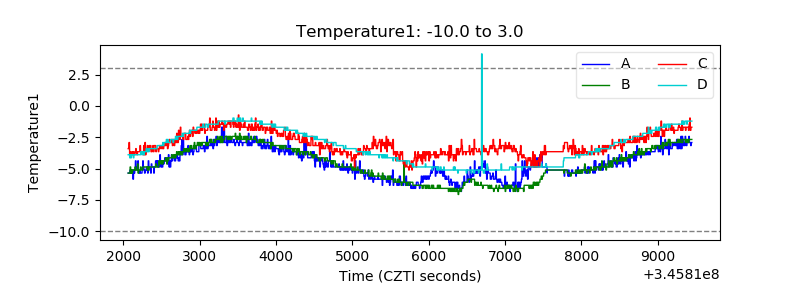 |
| Veto HV Monitor |  |
| Veto LLD | 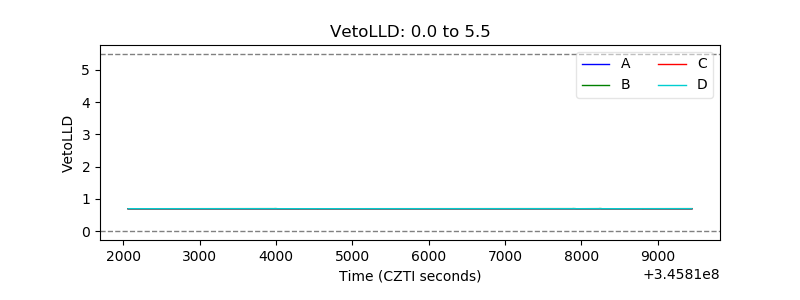 |
| Alpha Counter |  |
| _CPM_Rate | 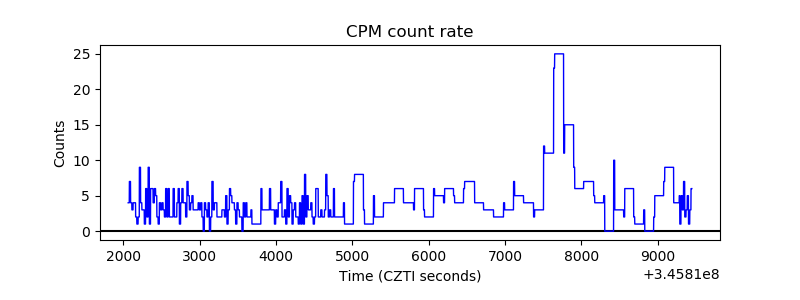 |
| CZT Counter | 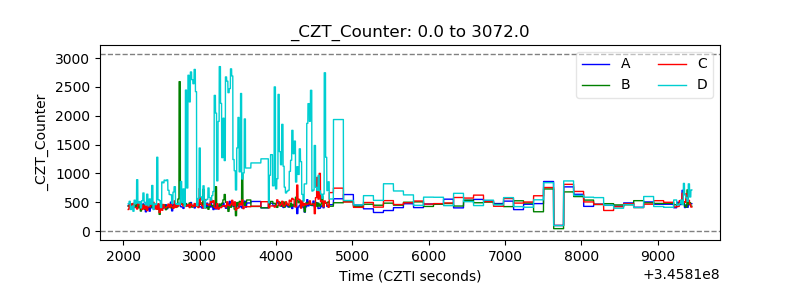 |
| +2.5 Volts monitor |  |
| +5 Volts monitor |  |
| _ROLL_ROT | 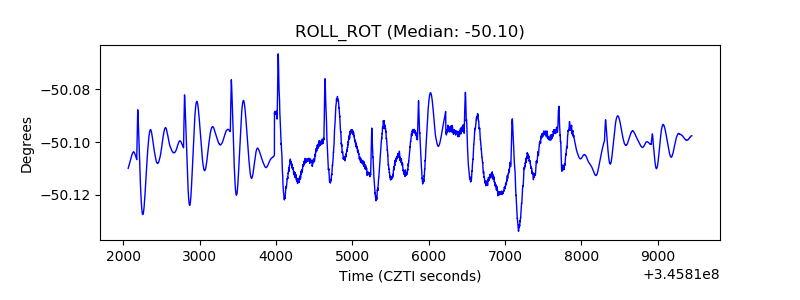 |
| _Roll_DEC | 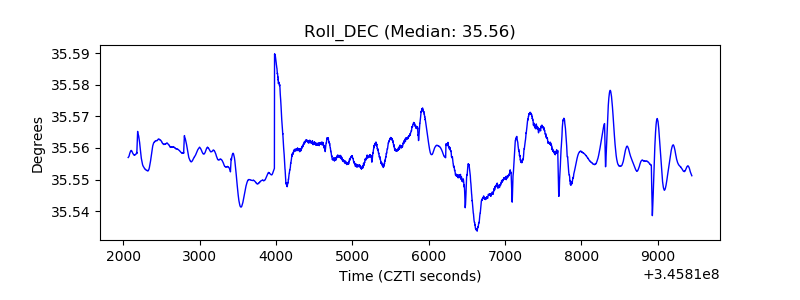 |
| _Roll_RA | 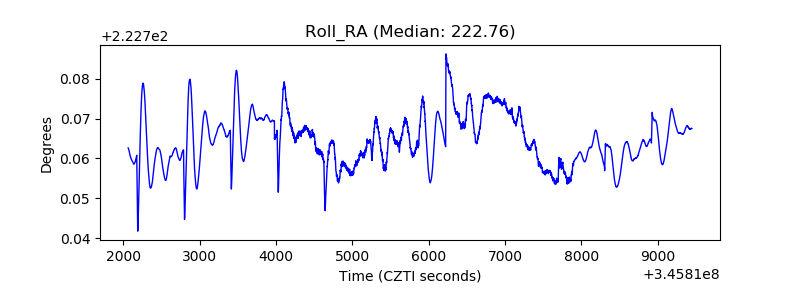 |
| Veto Counter | 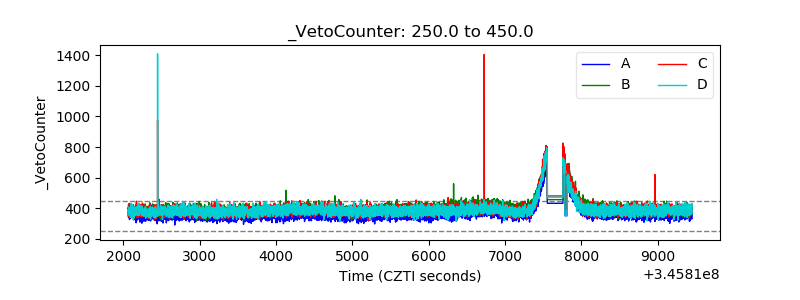 |