| Param | Original file | Final file |
|---|---|---|
| Filename | modeM0/AS1A10_045T09_9000004072_28220cztM0_level2.evt | modeM0/AS1A10_045T09_9000004072_28220cztM0_level2_quad_clean.evt |
| Size (bytes) | 1,402,153,920 | 200,416,320 |
| Size | 1.3 GB | 191.1 MB |
| Events in quadrant A | 9,296,839 | 1,234,669 |
| Events in quadrant B | 9,871,717 | 1,251,191 |
| Events in quadrant C | 9,064,817 | 1,197,351 |
| Events in quadrant D | 13,027,569 | 1,157,287 |
| Mode M0 | |||
|---|---|---|---|
| Quadrant | BADHDUFLAG | Total packets | Discarded packets |
| A | 0 | 39235 | 0 |
| B | 0 | 40613 | 0 |
| C | 0 | 37993 | 0 |
| D | 0 | 50691 | 0 |
| Mode M9 | |||
|---|---|---|---|
| Quadrant | BADHDUFLAG | Total packets | Discarded packets |
| A | 0 | 19 | 0 |
| B | 0 | 19 | 0 |
| C | 0 | 19 | 0 |
| D | 0 | 19 | 0 |
| Quadrant | Total seconds | Saturated seconds | Saturation percentage |
|---|---|---|---|
| A | 17824 | 214 | 1.200628% |
| B | 17825 | 444 | 2.490884% |
| C | 17825 | 350 | 1.963534% |
| D | 17825 | 841 | 4.718093% |
Noise dominated data is calculated using 1-second bins in cleaned event files. If a bin has >2000 counts, and if more than 50% of those come from <1% of pixels, then it is considered to be noise-dominated and hence unusable.
| Quadrant | # 1 sec bins | Bins with >0 counts | Bins with >2000 counts | High rate bins dominated by noise | Noise dominated (total time) | Noise dominated (detector-on time) | Marked lightcurve |
|---|---|---|---|---|---|---|---|
| A | 19799 | 17824 | 23 | 23 | 0.12% | 0.13% | 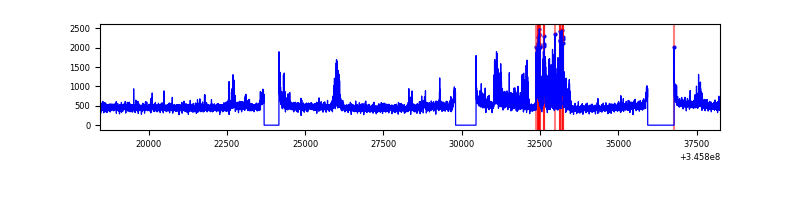 |
| B | 19800 | 17825 | 195 | 195 | 0.98% | 1.09% | 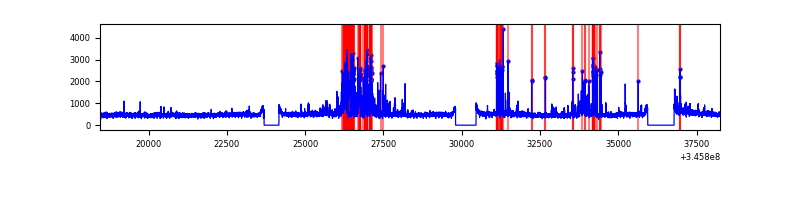 |
| C | 19800 | 17825 | 41 | 41 | 0.21% | 0.23% | 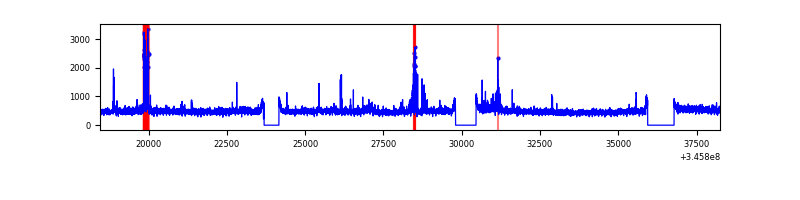 |
| D | 19800 | 17825 | 657 | 657 | 3.32% | 3.69% | 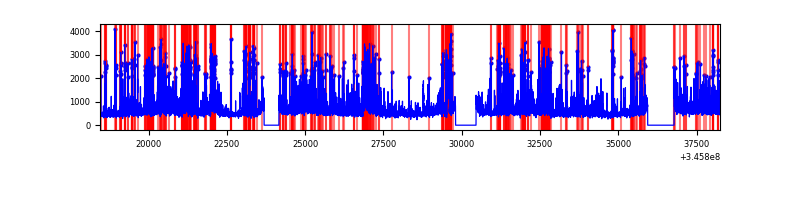 |
Top three noisy pixels from each quadrant. If the there are fewer than three noisy pixels in the level2.evt file, extra rows are filled as -1
| Pixel properties | Quadrant properties | ||||||
|---|---|---|---|---|---|---|---|
| Quadrant | DetID | PixID | Counts | Sigma | Mean | Median | Sigma |
| A | 12 | 16 | 846486 | 1957.37 | 2152 | 2109 | 431.4 |
| A | 12 | 194 | 147185 | 336.3 | 2152 | 2109 | 431.4 |
| A | 13 | 254 | 25945 | 55.25 | 2152 | 2109 | 431.4 |
| B | 10 | 245 | 1461001 | 3561.4 | 2122 | 2065 | 409.7 |
| B | 12 | 111 | 52462 | 123.02 | 2122 | 2065 | 409.7 |
| B | 11 | 111 | 47974 | 112.07 | 2122 | 2065 | 409.7 |
| C | 3 | 233 | 430960 | 887.98 | 2061 | 2071 | 483.0 |
| C | 14 | 238 | 326024 | 670.72 | 2061 | 2071 | 483.0 |
| C | 9 | 221 | 199552 | 408.87 | 2061 | 2071 | 483.0 |
| D | 1 | 52 | 3536380 | 7179.86 | 2061 | 2005 | 492.3 |
| D | 2 | 250 | 559866 | 1133.26 | 2061 | 2005 | 492.3 |
| D | 5 | 222 | 447065 | 904.11 | 2061 | 2005 | 492.3 |
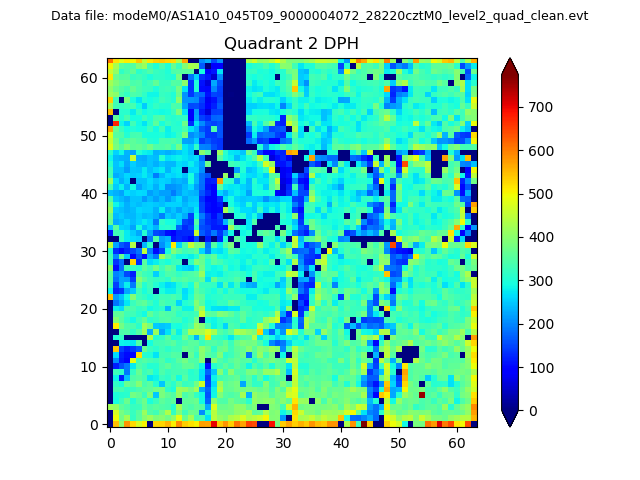
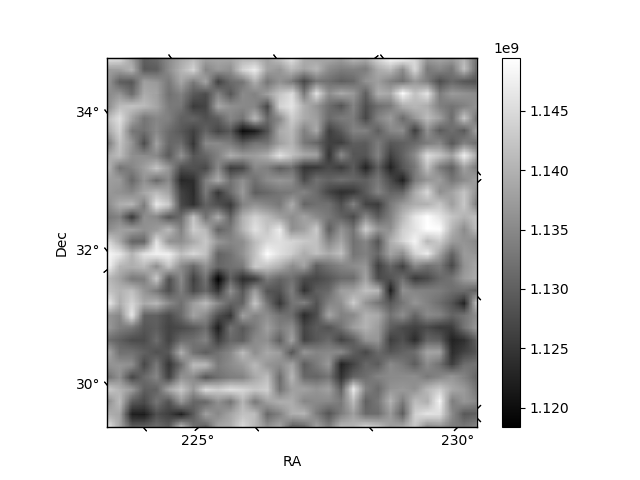
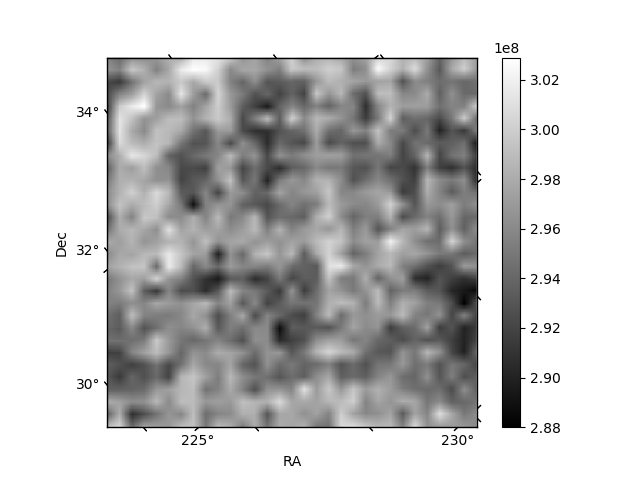
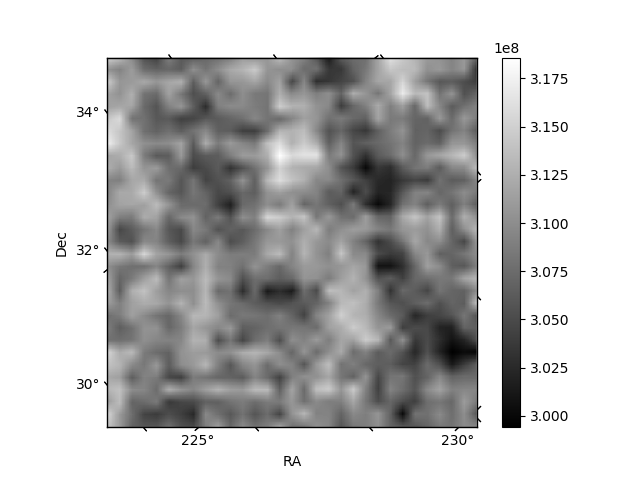
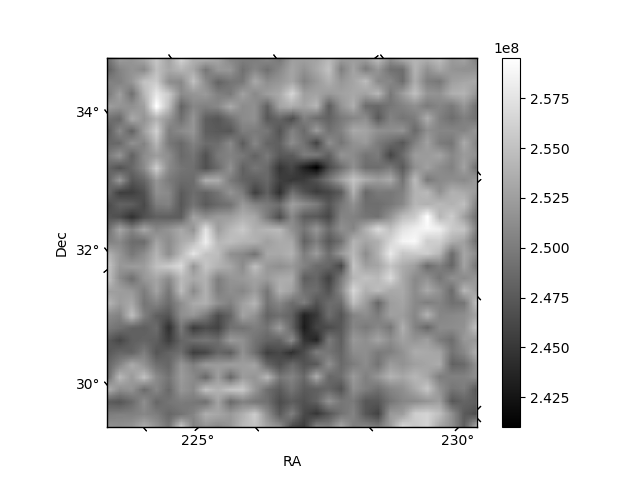
Histogram calculated using DETX and DETY for each event in the final _common_clean file
| Quadrant A | 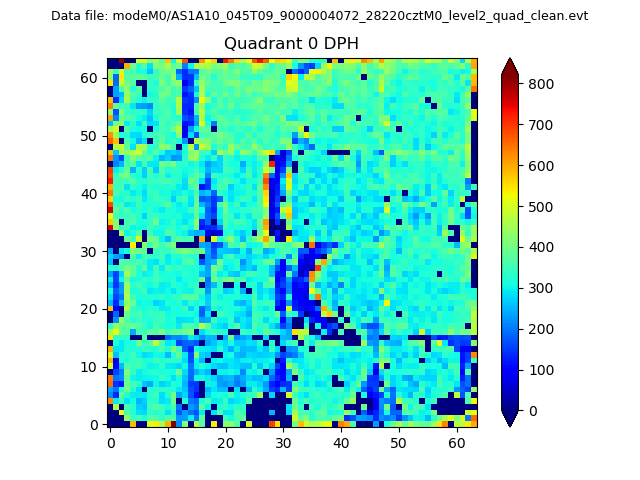 |
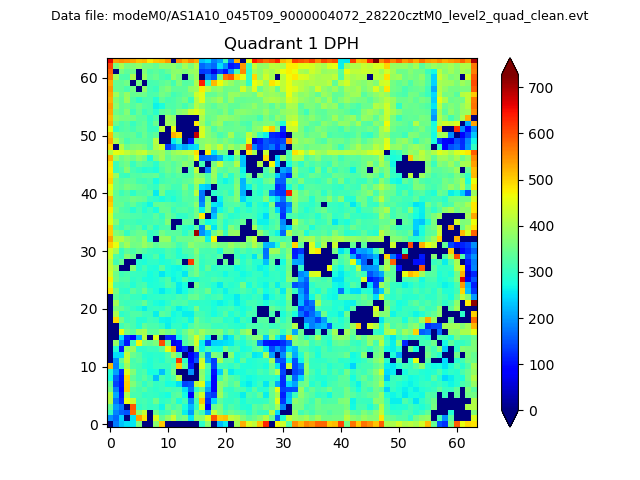 |
Quadrant B |
|---|---|---|---|
| Quadrant D | 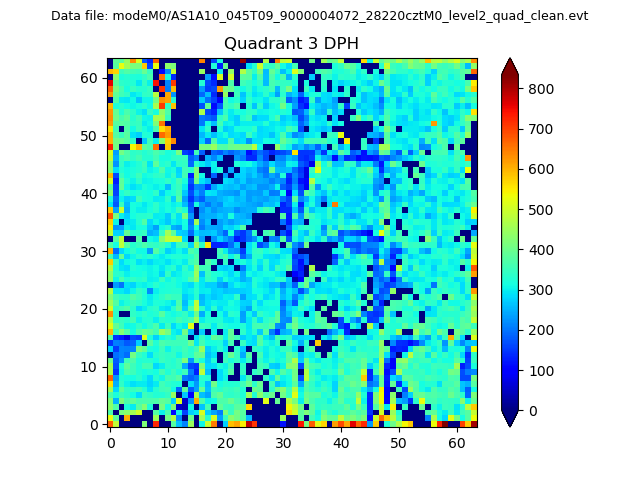 |
 |
Quadrant C |
| Plot type | Count rate plots | Images |
|---|---|---|
| Comparison with Poisson distribution Blue bars denote a histogram of data divided into 1 sec bins. Red curve is a Poisson curve with rate = median count rate of data. |
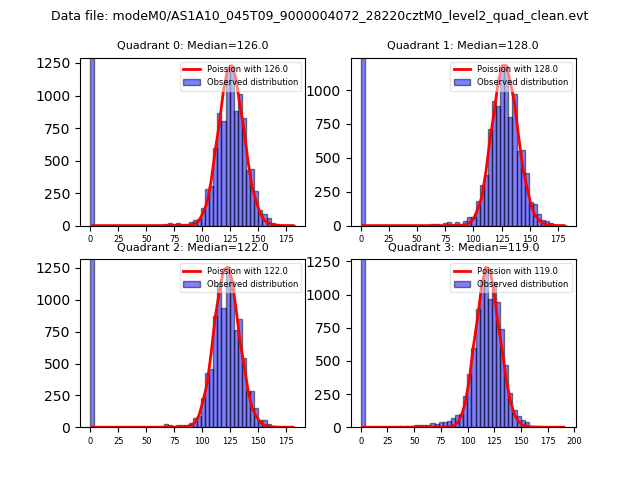 |
 |
| Quadrant-wise count rates Data is divided into 100 sec bins |
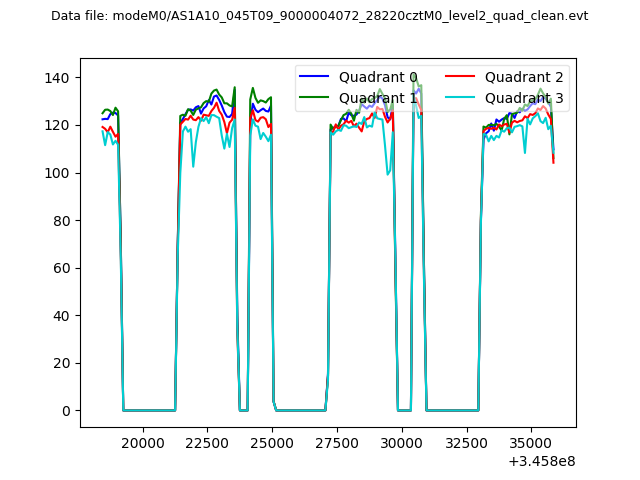 |
|
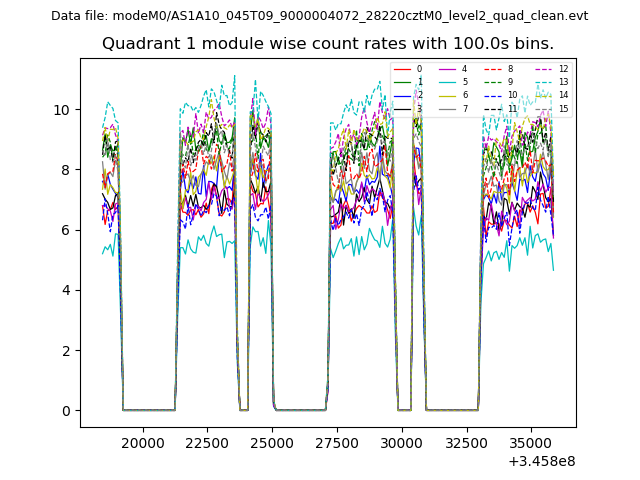
| Module-wise count rates for Quadrant A Data is divided into 100 sec bins |
 |
 |
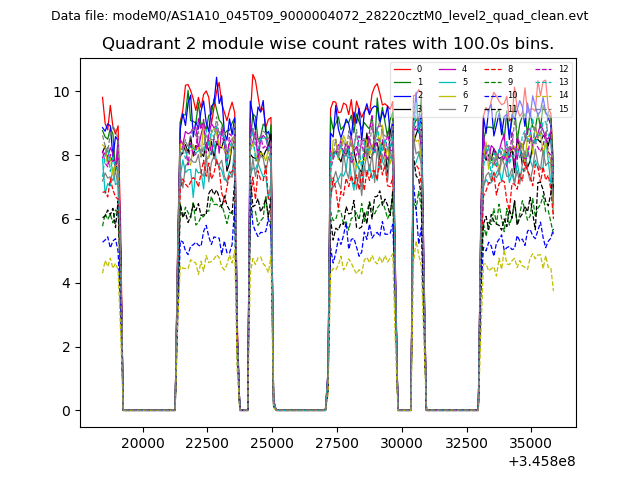
| Module-wise count rates for Quadrant B Data is divided into 100 sec bins |
 |
 |
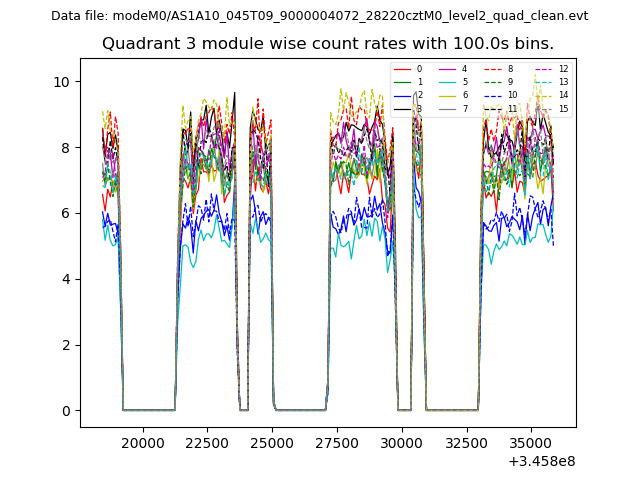
| Module-wise count rates for Quadrant C Data is divided into 100 sec bins |
 |
 |
| Module-wise count rates for Quadrant D Data is divided into 100 sec bins |
 |
 |
| Parameter | Plot |
|---|---|
| CZT HV Monitor | 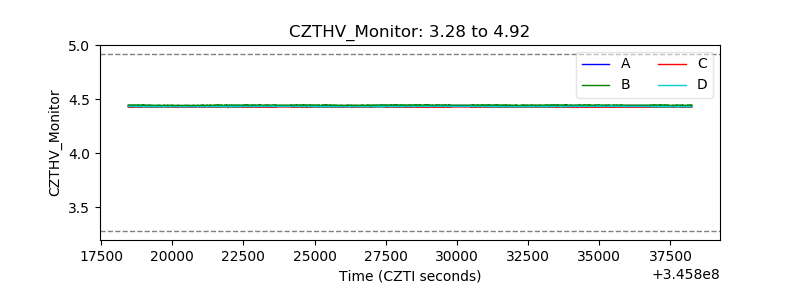 |
| D_VDD | 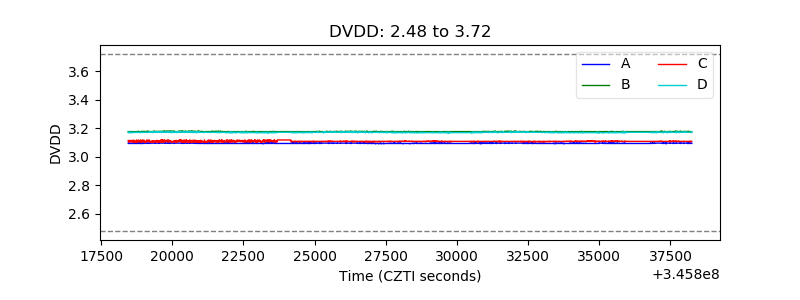 |
| Temperature 1 | 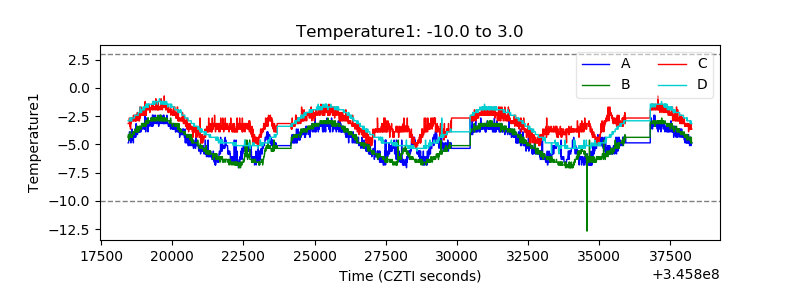 |
| Veto HV Monitor | 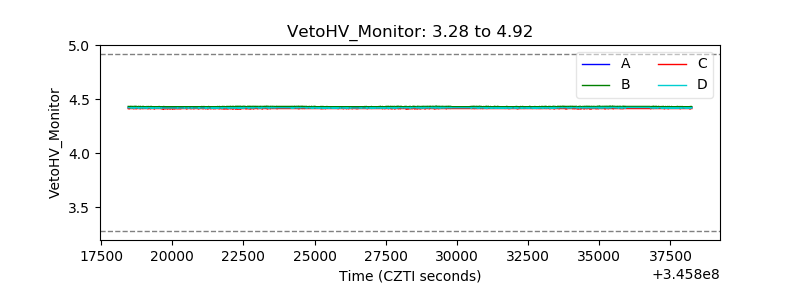 |
| Veto LLD |  |
| Alpha Counter | 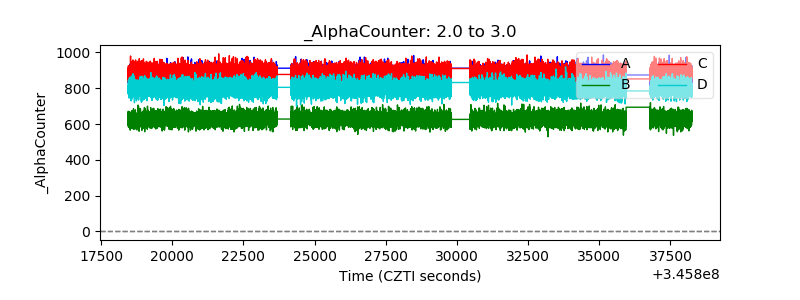 |
| _CPM_Rate | 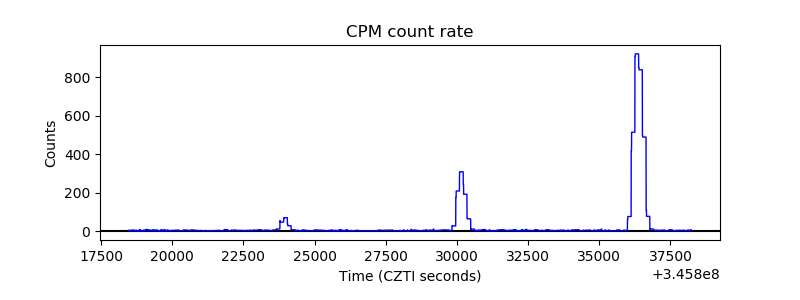 |
| CZT Counter | 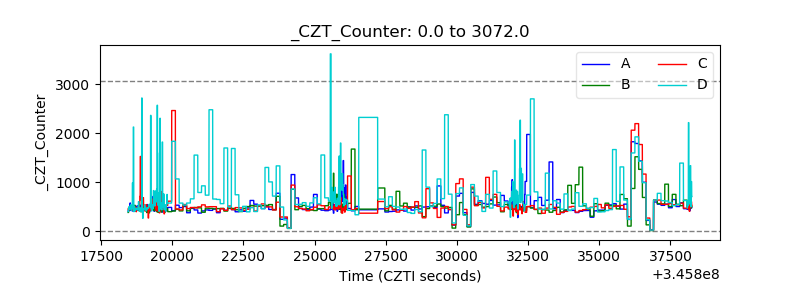 |
| +2.5 Volts monitor |  |
| +5 Volts monitor | 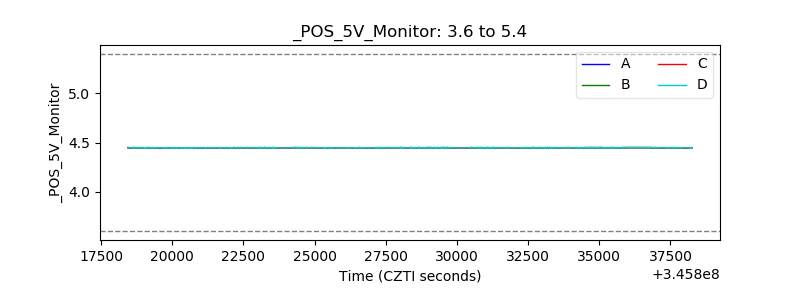 |
| _ROLL_ROT | 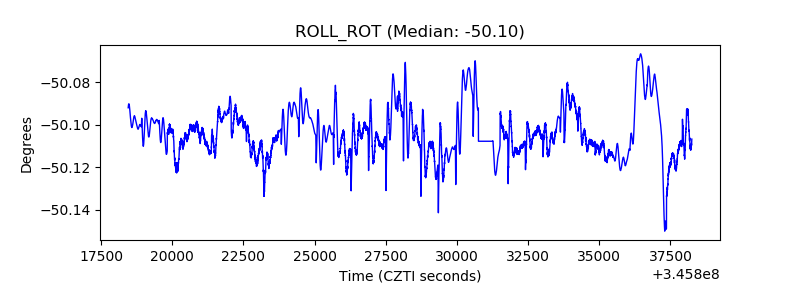 |
| _Roll_DEC | 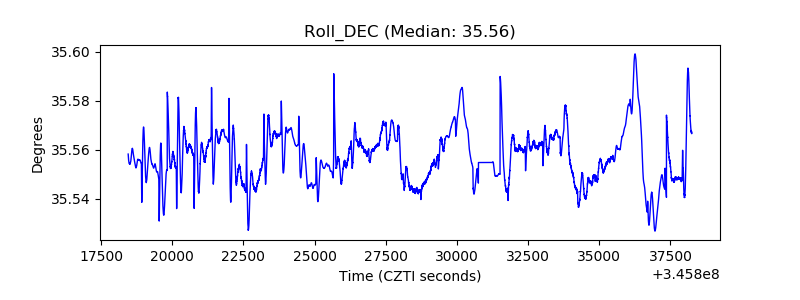 |
| _Roll_RA | 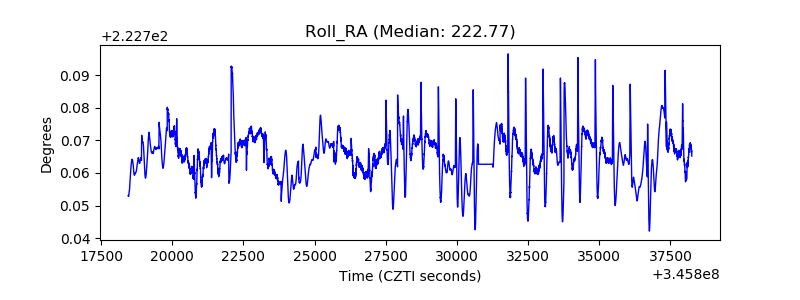 |
| Veto Counter | 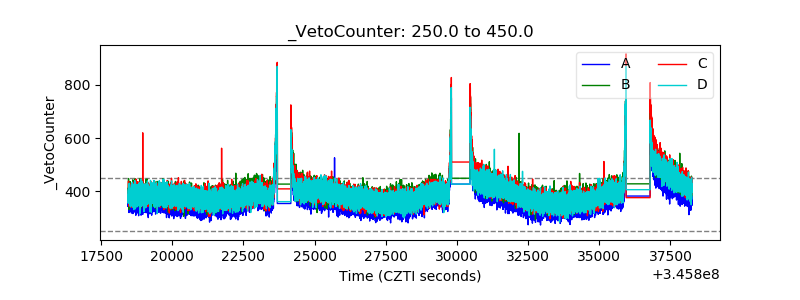 |