| Param | Original file | Final file |
|---|---|---|
| Filename | modeM0/AS1A10_045T09_9000004072_28221cztM0_level2.evt | modeM0/AS1A10_045T09_9000004072_28221cztM0_level2_quad_clean.evt |
| Size (bytes) | 542,761,920 | 66,104,640 |
| Size | 517.6 MB | 63.0 MB |
| Events in quadrant A | 3,231,713 | 395,370 |
| Events in quadrant B | 3,738,541 | 398,465 |
| Events in quadrant C | 3,330,107 | 387,088 |
| Events in quadrant D | 5,692,980 | 363,310 |
| Mode M0 | |||
|---|---|---|---|
| Quadrant | BADHDUFLAG | Total packets | Discarded packets |
| A | 0 | 13862 | 0 |
| B | 0 | 15446 | 0 |
| C | 0 | 14042 | 0 |
| D | 0 | 21345 | 0 |
| Mode M9 | |||
|---|---|---|---|
| Quadrant | BADHDUFLAG | Total packets | Discarded packets |
| A | 0 | 16 | 0 |
| B | 0 | 17 | 0 |
| C | 0 | 17 | 0 |
| D | 0 | 17 | 0 |
| Quadrant | Total seconds | Saturated seconds | Saturation percentage |
|---|---|---|---|
| A | 6559 | 41 | 0.625095% |
| B | 6559 | 89 | 1.356914% |
| C | 6559 | 98 | 1.494130% |
| D | 6558 | 461 | 7.029582% |
Noise dominated data is calculated using 1-second bins in cleaned event files. If a bin has >2000 counts, and if more than 50% of those come from <1% of pixels, then it is considered to be noise-dominated and hence unusable.
| Quadrant | # 1 sec bins | Bins with >0 counts | Bins with >2000 counts | High rate bins dominated by noise | Noise dominated (total time) | Noise dominated (detector-on time) | Marked lightcurve |
|---|---|---|---|---|---|---|---|
| A | 7564 | 6559 | 1 | 1 | 0.01% | 0.02% | 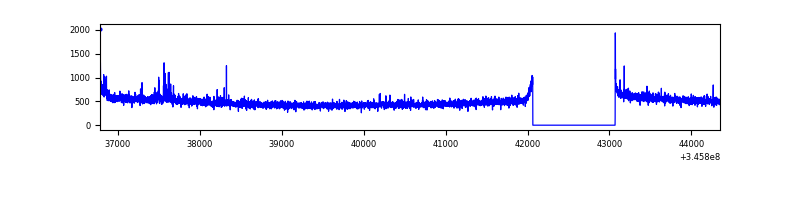 |
| B | 7564 | 6559 | 23 | 23 | 0.30% | 0.35% | 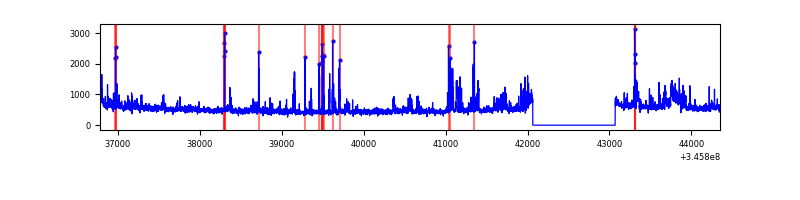 |
| C | 7564 | 6559 | 0 | 0 | 0.00% | 0.00% | 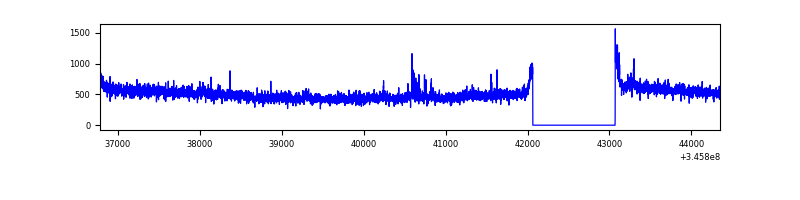 |
| D | 7563 | 6558 | 355 | 355 | 4.69% | 5.41% |  |
Top three noisy pixels from each quadrant. If the there are fewer than three noisy pixels in the level2.evt file, extra rows are filled as -1
| Pixel properties | Quadrant properties | ||||||
|---|---|---|---|---|---|---|---|
| Quadrant | DetID | PixID | Counts | Sigma | Mean | Median | Sigma |
| A | 12 | 16 | 37820 | 223.44 | 823 | 805 | 165.7 |
| A | 12 | 194 | 11979 | 67.45 | 823 | 805 | 165.7 |
| A | 8 | 192 | 11822 | 66.5 | 823 | 805 | 165.7 |
| B | 10 | 245 | 522239 | 3333.91 | 814 | 793 | 156.4 |
| B | 12 | 111 | 19669 | 120.69 | 814 | 793 | 156.4 |
| B | 11 | 111 | 17752 | 108.43 | 814 | 793 | 156.4 |
| C | 14 | 238 | 127897 | 676.21 | 797 | 803 | 187.9 |
| C | 1 | 16 | 45425 | 237.41 | 797 | 803 | 187.9 |
| C | 9 | 221 | 23454 | 120.51 | 797 | 803 | 187.9 |
| D | 1 | 52 | 1989544 | 10608.35 | 782 | 760 | 187.5 |
| D | 7 | 238 | 350984 | 1868.13 | 782 | 760 | 187.5 |
| D | 8 | 195 | 174592 | 927.24 | 782 | 760 | 187.5 |
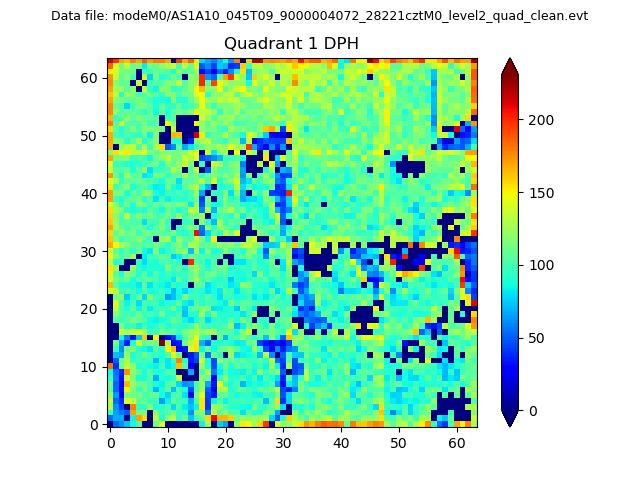
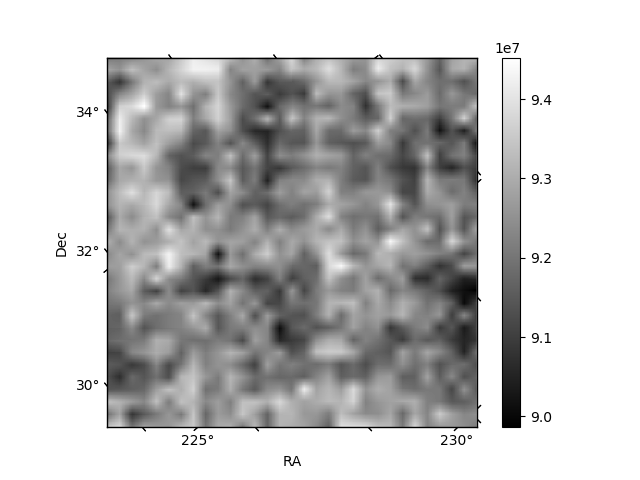
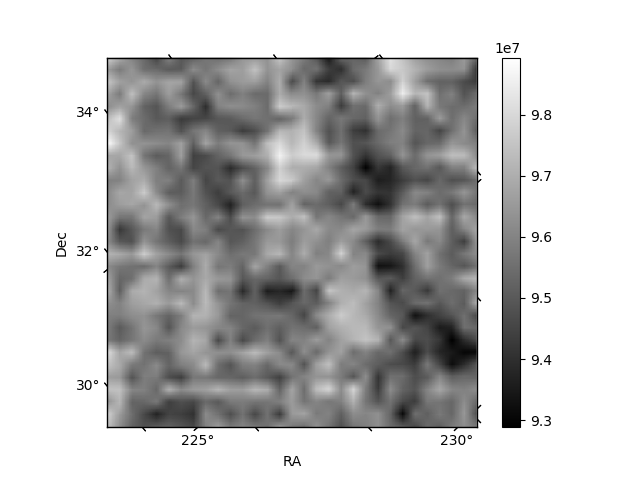
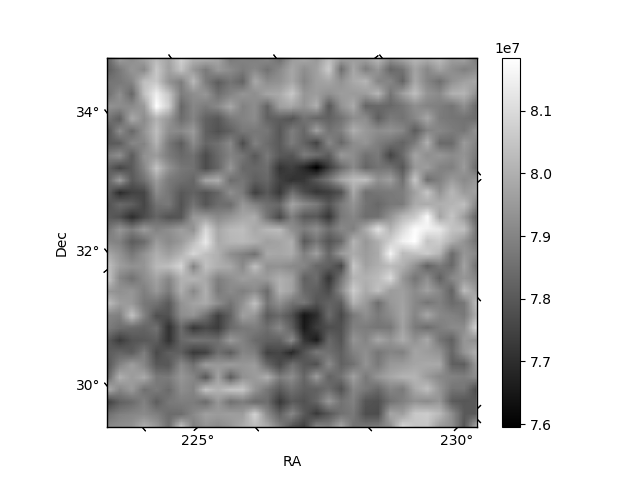
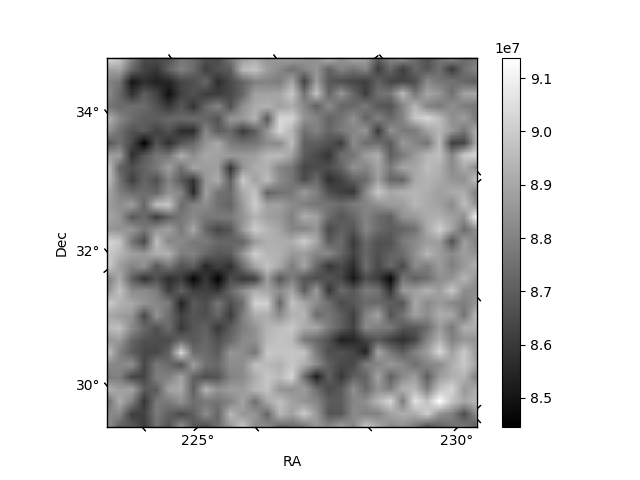
Histogram calculated using DETX and DETY for each event in the final _common_clean file
| Quadrant A | 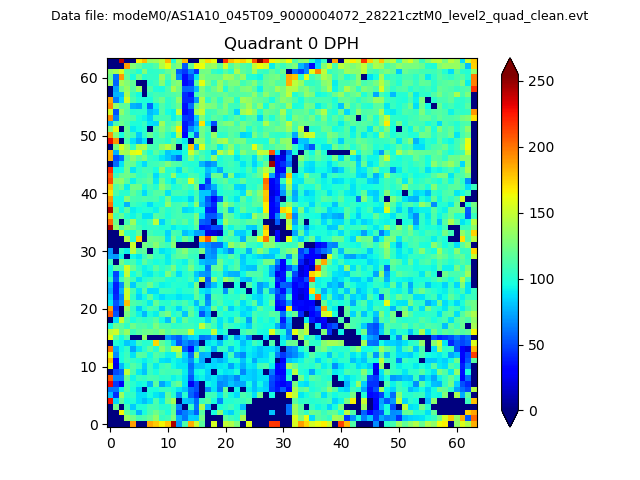 |
 |
Quadrant B |
|---|---|---|---|
| Quadrant D | 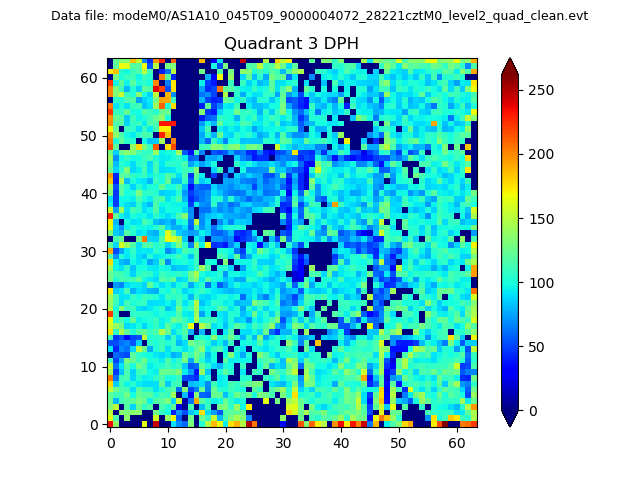 |
 |
Quadrant C |
| Plot type | Count rate plots | Images |
|---|---|---|
| Comparison with Poisson distribution Blue bars denote a histogram of data divided into 1 sec bins. Red curve is a Poisson curve with rate = median count rate of data. |
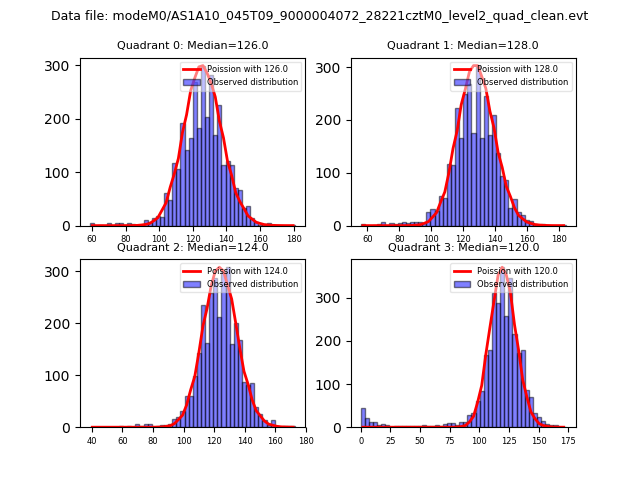 |
 |
| Quadrant-wise count rates Data is divided into 100 sec bins |
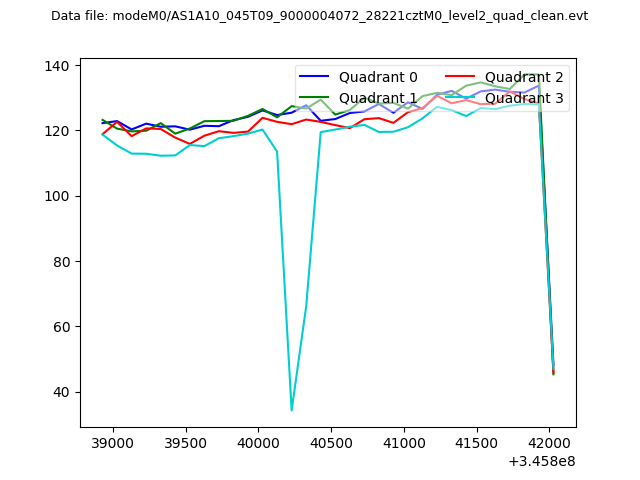 |
|
| Module-wise count rates for Quadrant A Data is divided into 100 sec bins |
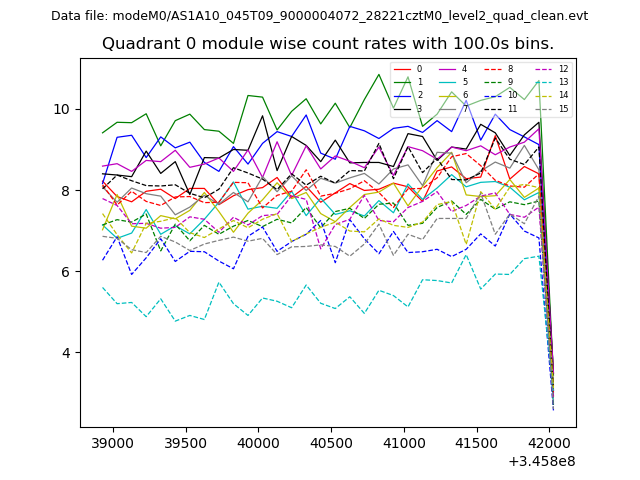 |
 |
| Module-wise count rates for Quadrant B Data is divided into 100 sec bins |
 |
 |
| Module-wise count rates for Quadrant C Data is divided into 100 sec bins |
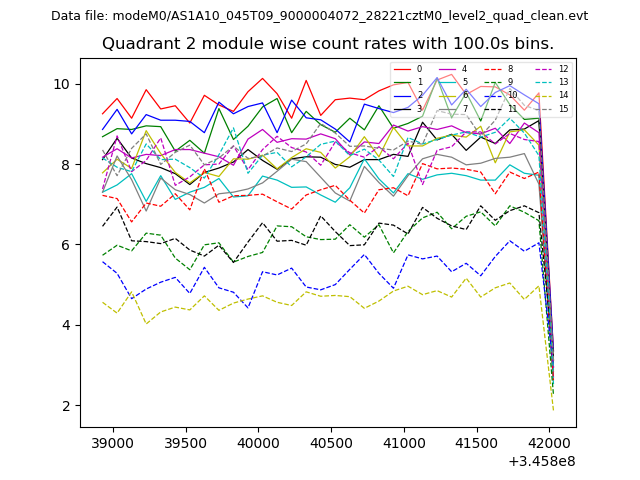 |
 |
| Module-wise count rates for Quadrant D Data is divided into 100 sec bins |
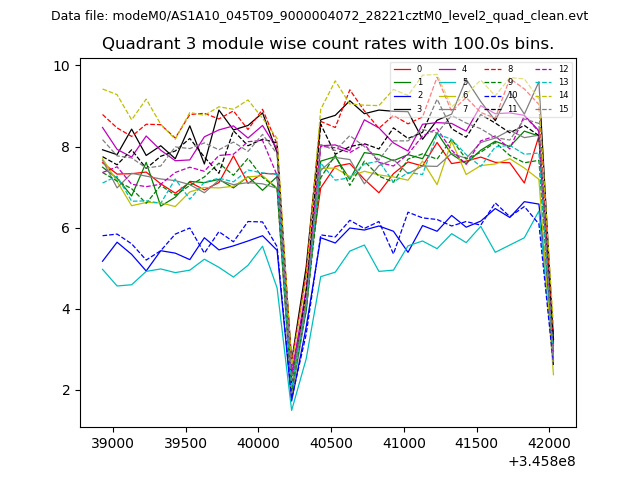 |
 |
| Parameter | Plot |
|---|---|
| CZT HV Monitor | 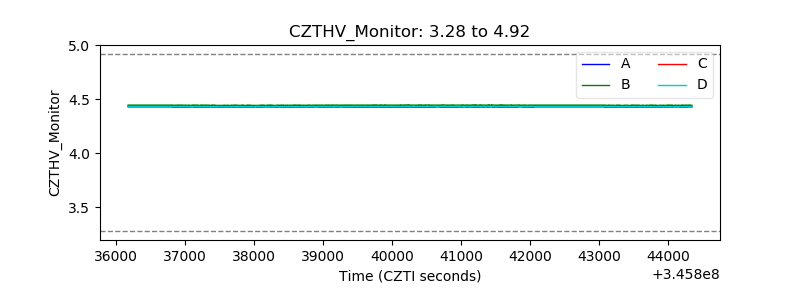 |
| D_VDD | 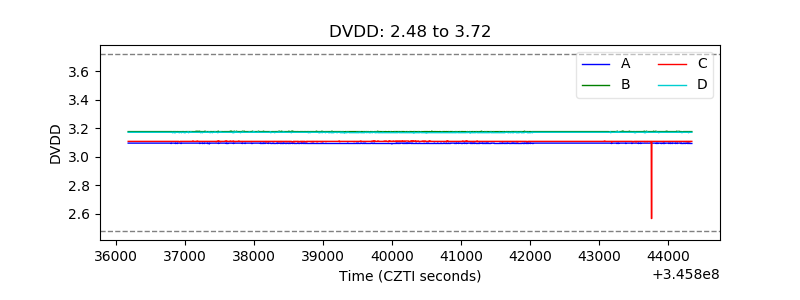 |
| Temperature 1 |  |
| Veto HV Monitor | 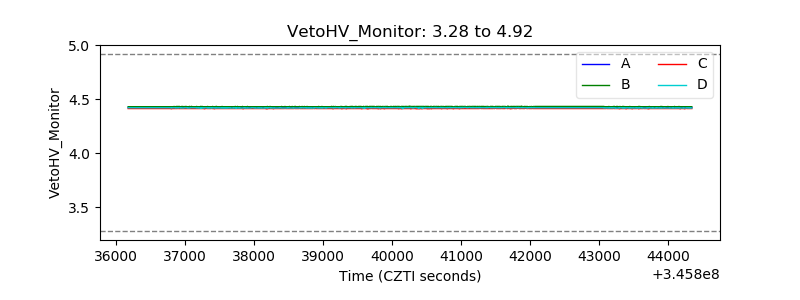 |
| Veto LLD | 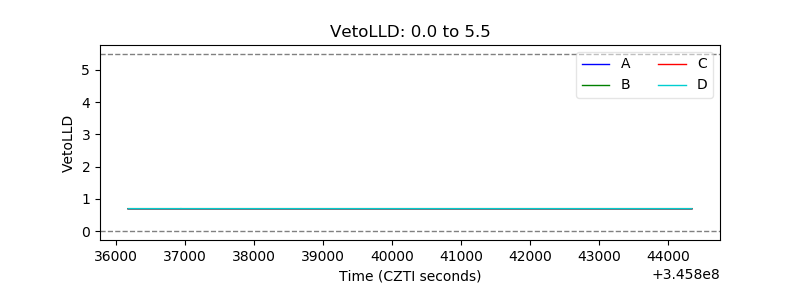 |
| Alpha Counter | 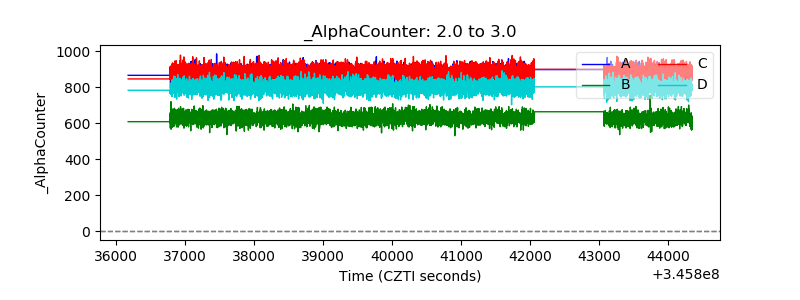 |
| _CPM_Rate | 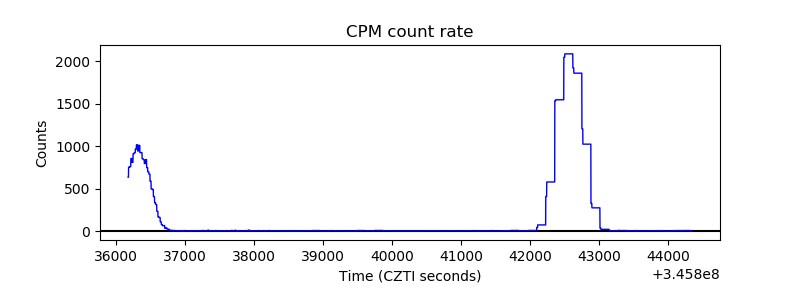 |
| CZT Counter |  |
| +2.5 Volts monitor | 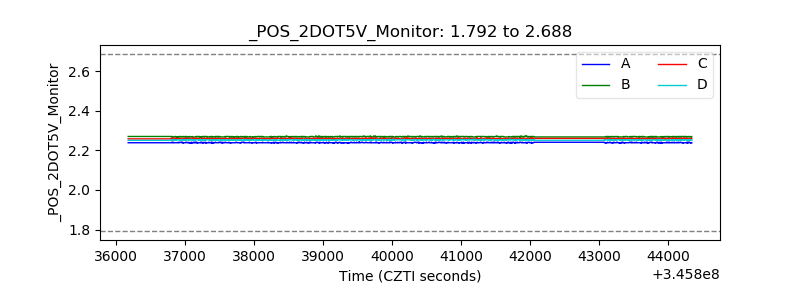 |
| +5 Volts monitor | 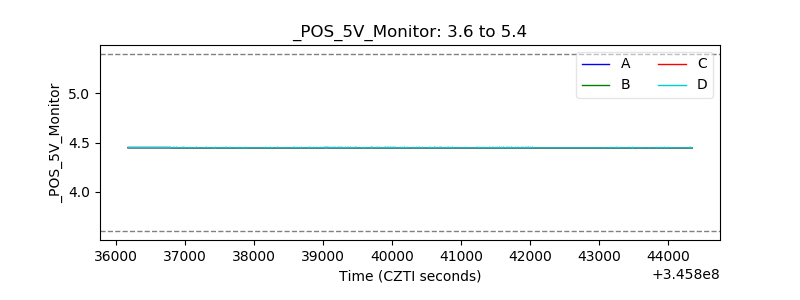 |
| _ROLL_ROT | 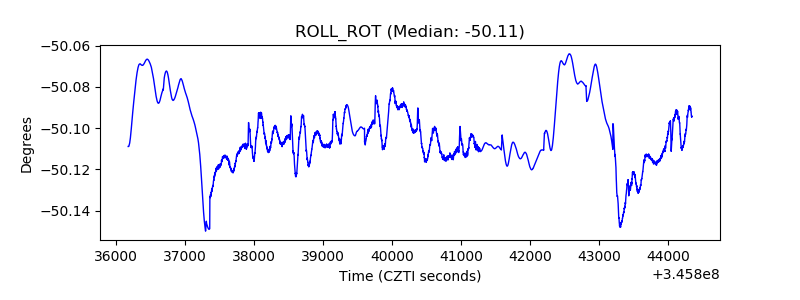 |
| _Roll_DEC | 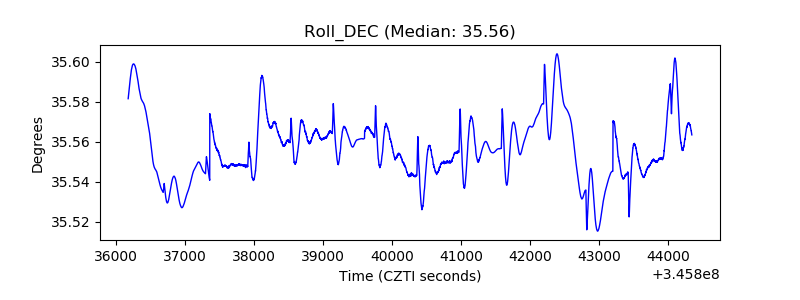 |
| _Roll_RA | 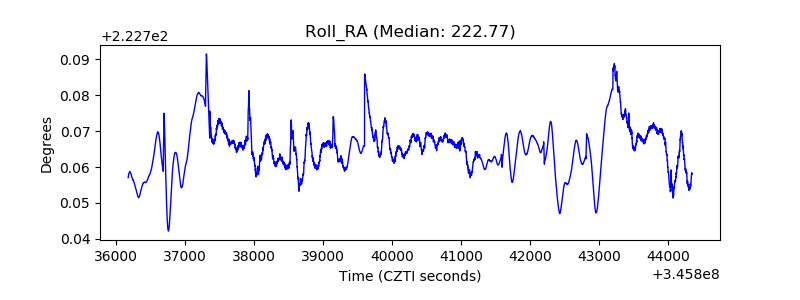 |
| Veto Counter | 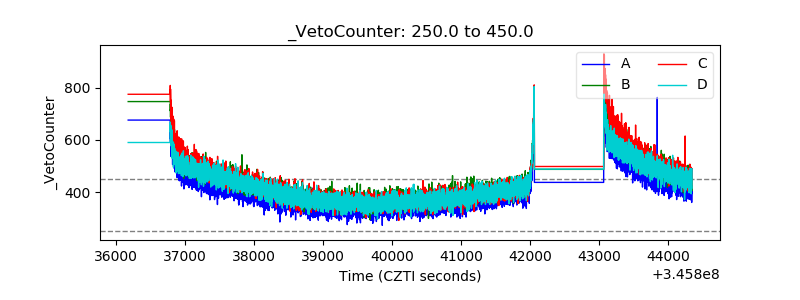 |