| Param | Original file | Final file |
|---|---|---|
| Filename | modeM0/AS1A10_045T09_9000004072_28223cztM0_level2.evt | modeM0/AS1A10_045T09_9000004072_28223cztM0_level2_quad_clean.evt |
| Size (bytes) | 227,632,320 | 16,729,920 |
| Size | 217.1 MB | 16.0 MB |
| Events in quadrant A | 1,167,028 | 85,879 |
| Events in quadrant B | 1,453,490 | 85,545 |
| Events in quadrant C | 1,222,182 | 85,358 |
| Events in quadrant D | 2,891,163 | 80,753 |
| Mode M0 | |||
|---|---|---|---|
| Quadrant | BADHDUFLAG | Total packets | Discarded packets |
| A | 0 | 4958 | 0 |
| B | 0 | 5900 | 0 |
| C | 0 | 5121 | 0 |
| D | 0 | 10230 | 0 |
| Quadrant | Total seconds | Saturated seconds | Saturation percentage |
|---|---|---|---|
| A | 2334 | 2 | 0.085690% |
| B | 2335 | 36 | 1.541756% |
| C | 2335 | 26 | 1.113490% |
| D | 2335 | 204 | 8.736617% |
Noise dominated data is calculated using 1-second bins in cleaned event files. If a bin has >2000 counts, and if more than 50% of those come from <1% of pixels, then it is considered to be noise-dominated and hence unusable.
| Quadrant | # 1 sec bins | Bins with >0 counts | Bins with >2000 counts | High rate bins dominated by noise | Noise dominated (total time) | Noise dominated (detector-on time) | Marked lightcurve |
|---|---|---|---|---|---|---|---|
| A | 2334 | 2334 | 0 | 0 | 0.00% | 0.00% | 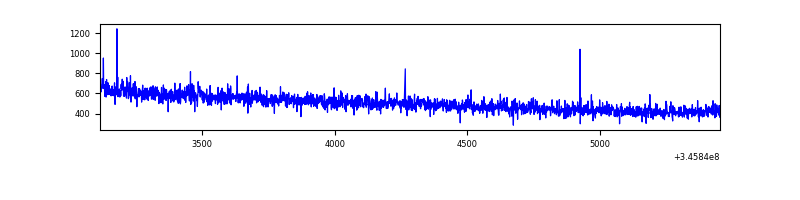 |
| B | 2335 | 2335 | 17 | 17 | 0.73% | 0.73% | 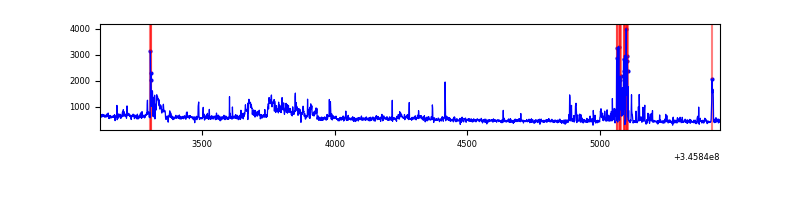 |
| C | 2335 | 2335 | 0 | 0 | 0.00% | 0.00% | 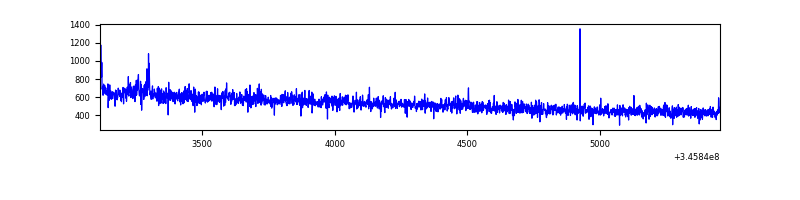 |
| D | 2335 | 2335 | 145 | 145 | 6.21% | 6.21% | 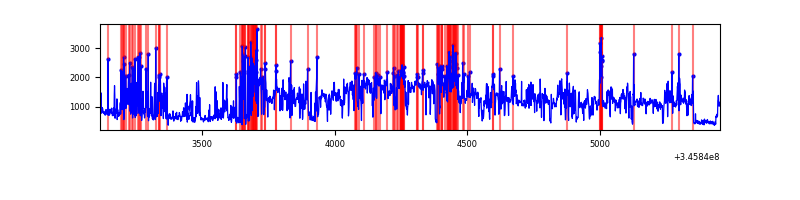 |
Top three noisy pixels from each quadrant. If the there are fewer than three noisy pixels in the level2.evt file, extra rows are filled as -1
| Pixel properties | Quadrant properties | ||||||
|---|---|---|---|---|---|---|---|
| Quadrant | DetID | PixID | Counts | Sigma | Mean | Median | Sigma |
| A | 13 | 254 | 3860 | 57.84 | 301 | 296 | 61.6 |
| A | 3 | 137 | 2899 | 42.25 | 301 | 296 | 61.6 |
| A | 0 | 226 | 2550 | 36.58 | 301 | 296 | 61.6 |
| B | 10 | 245 | 264853 | 4501.85 | 299 | 292 | 58.8 |
| B | 12 | 111 | 7068 | 115.3 | 299 | 292 | 58.8 |
| B | 0 | 230 | 6708 | 109.18 | 299 | 292 | 58.8 |
| C | 14 | 238 | 48530 | 679.07 | 296 | 299 | 71.0 |
| C | 1 | 16 | 8794 | 119.61 | 296 | 299 | 71.0 |
| C | 3 | 233 | 8185 | 111.03 | 296 | 299 | 71.0 |
| D | 1 | 52 | 1652364 | 23567.52 | 289 | 281 | 70.1 |
| D | 2 | 250 | 50659 | 718.66 | 289 | 281 | 70.1 |
| D | 8 | 195 | 34176 | 483.52 | 289 | 281 | 70.1 |
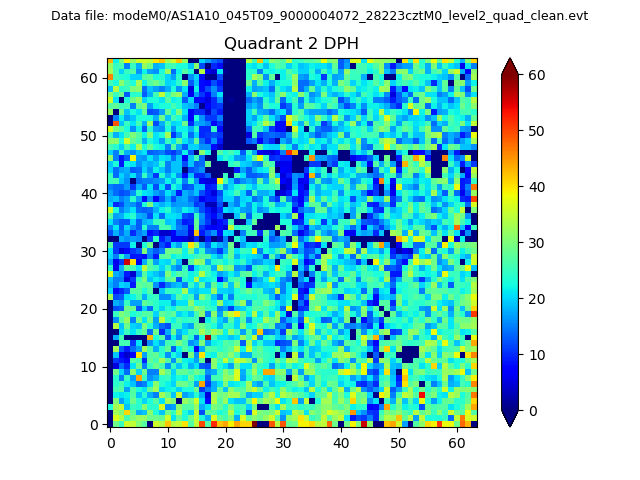
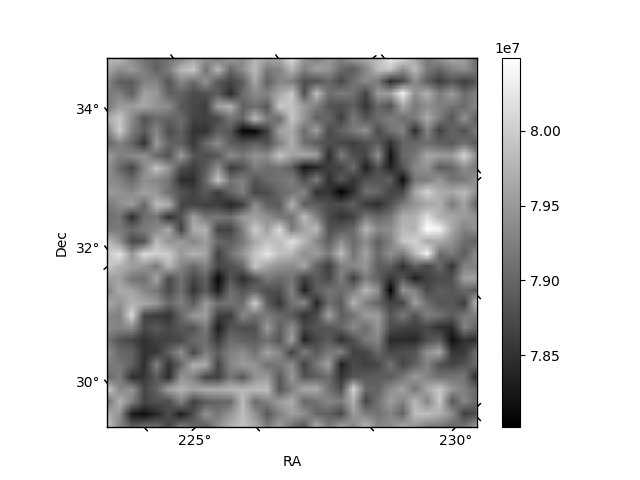
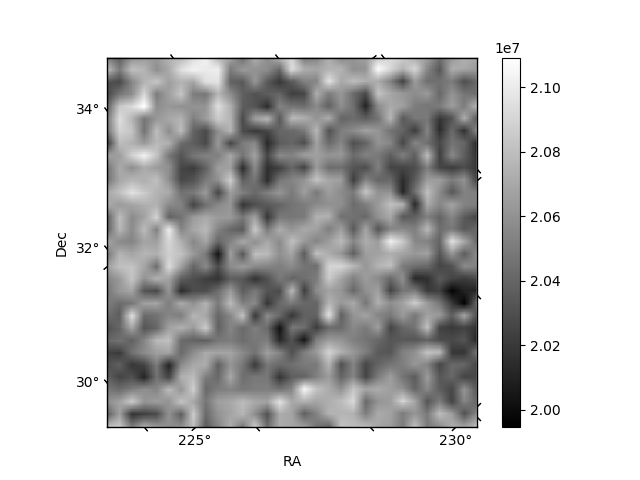
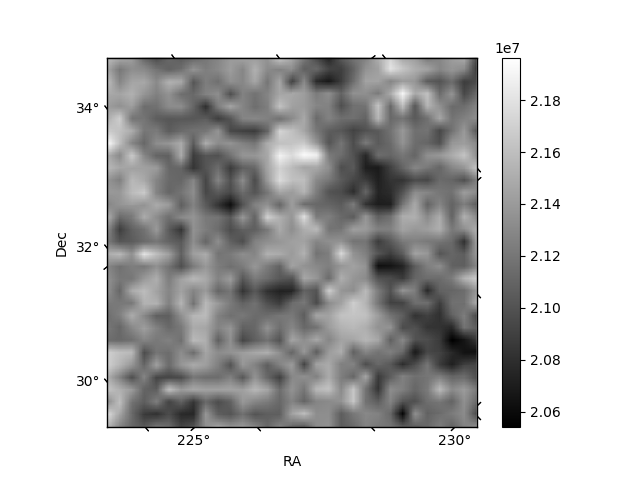
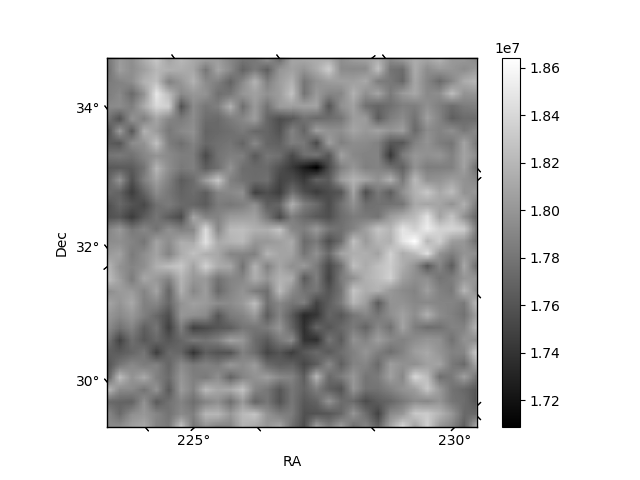
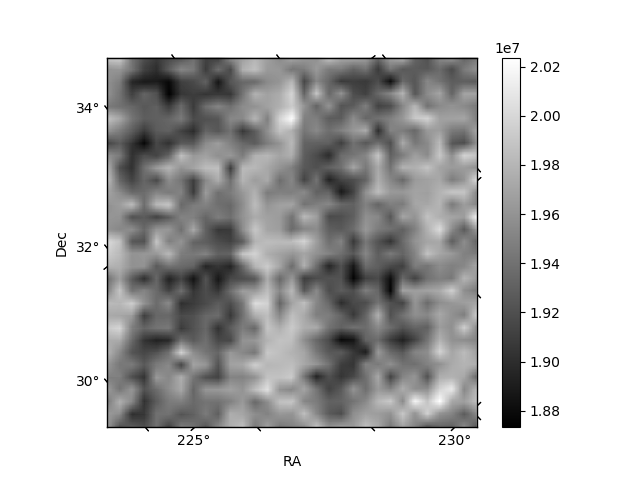
Histogram calculated using DETX and DETY for each event in the final _common_clean file
| Quadrant A | 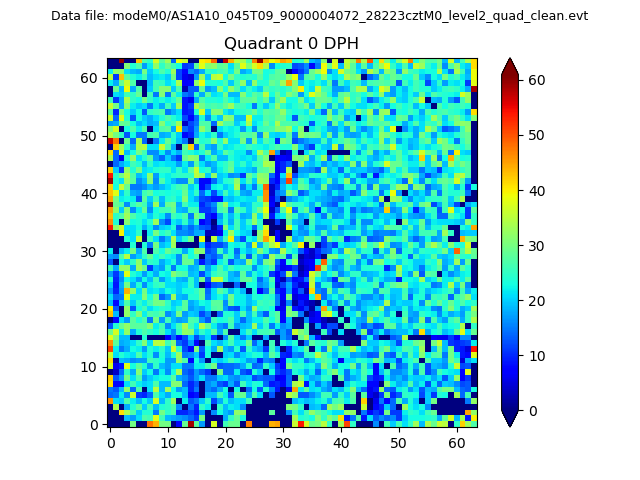 |
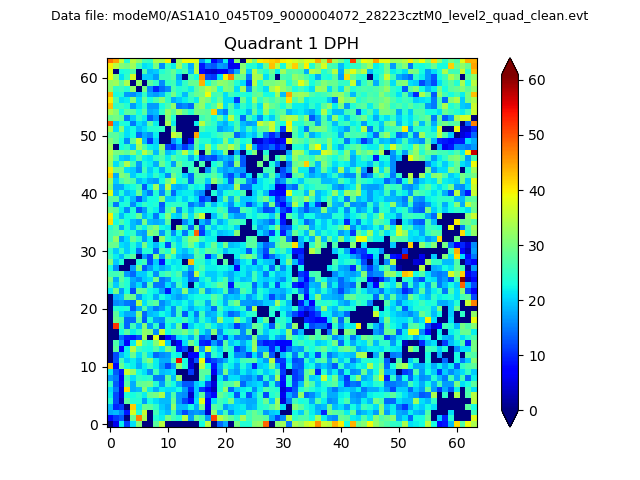 |
Quadrant B |
|---|---|---|---|
| Quadrant D | 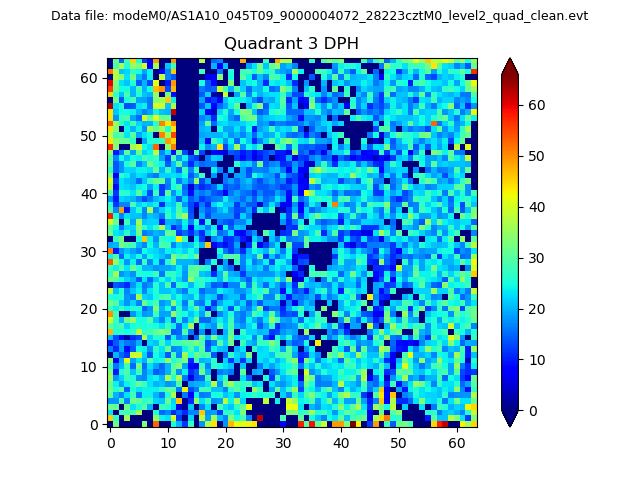 |
 |
Quadrant C |
| Plot type | Count rate plots | Images |
|---|---|---|
| Comparison with Poisson distribution Blue bars denote a histogram of data divided into 1 sec bins. Red curve is a Poisson curve with rate = median count rate of data. |
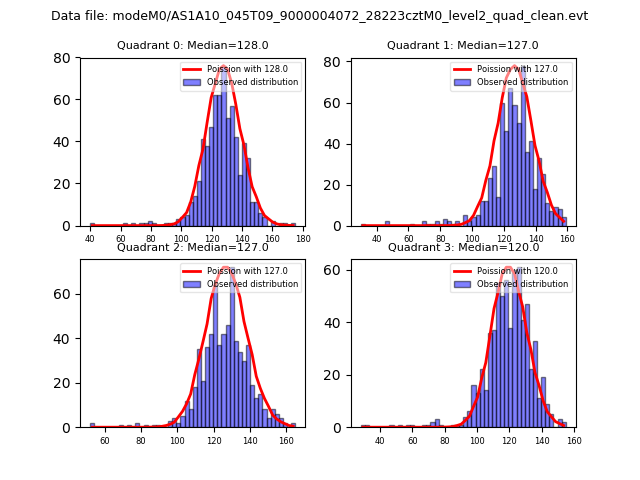 |
 |
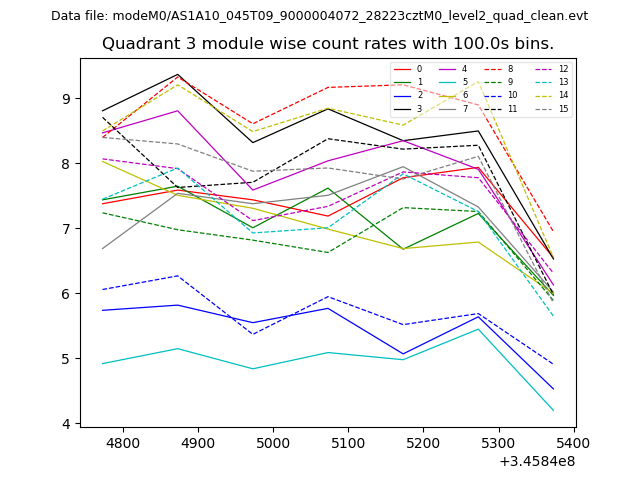
| Quadrant-wise count rates Data is divided into 100 sec bins |
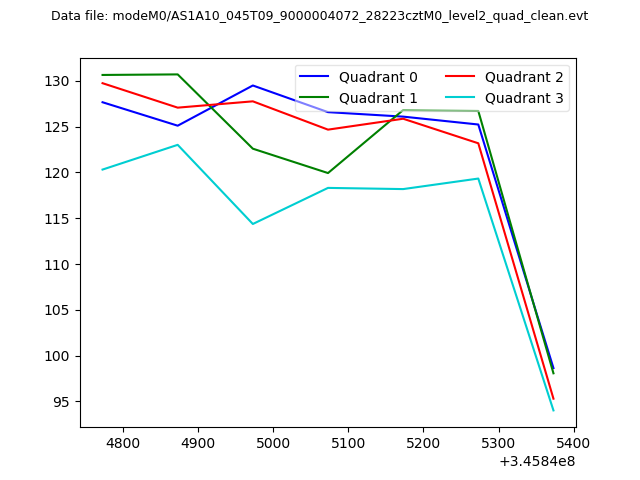 |
|
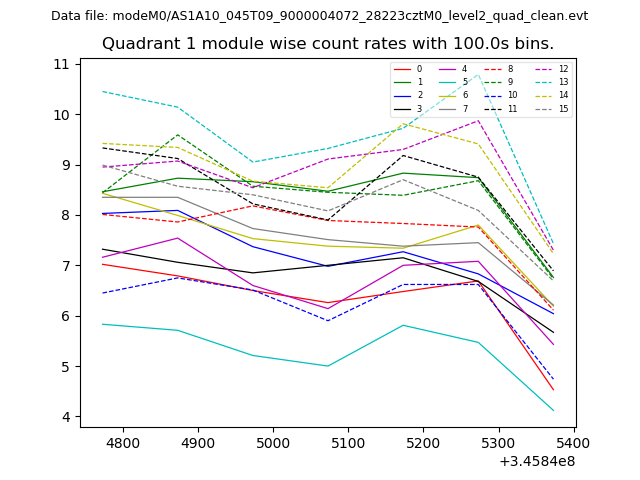
| Module-wise count rates for Quadrant A Data is divided into 100 sec bins |
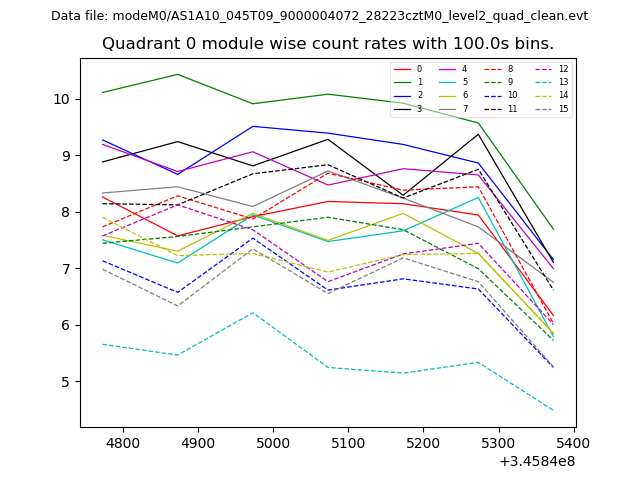 |
 |
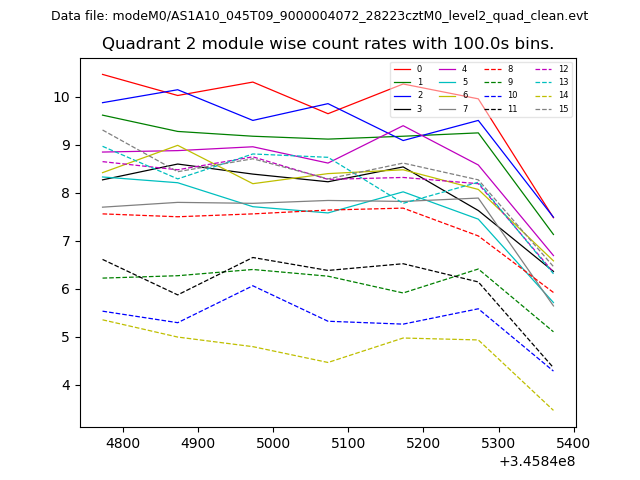
| Module-wise count rates for Quadrant B Data is divided into 100 sec bins |
 |
 |
| Module-wise count rates for Quadrant C Data is divided into 100 sec bins |
 |
 |
| Module-wise count rates for Quadrant D Data is divided into 100 sec bins |
 |
 |
| Parameter | Plot |
|---|---|
| CZT HV Monitor | 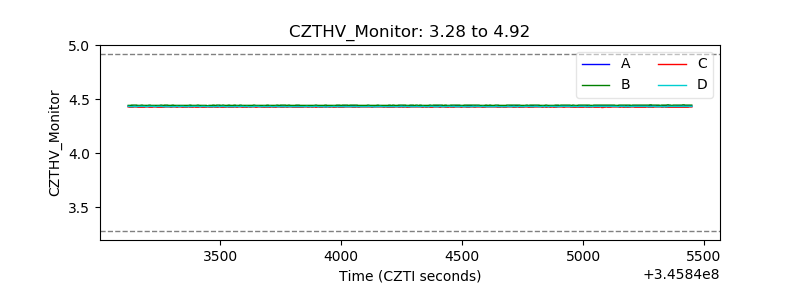 |
| D_VDD | 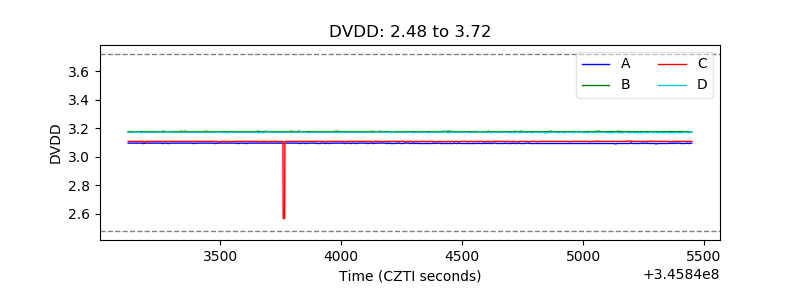 |
| Temperature 1 | 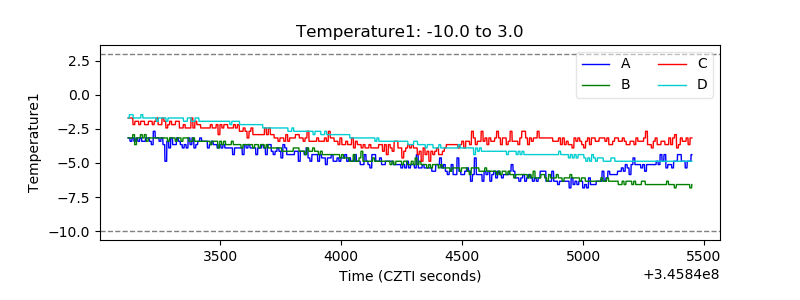 |
| Veto HV Monitor |  |
| Veto LLD | 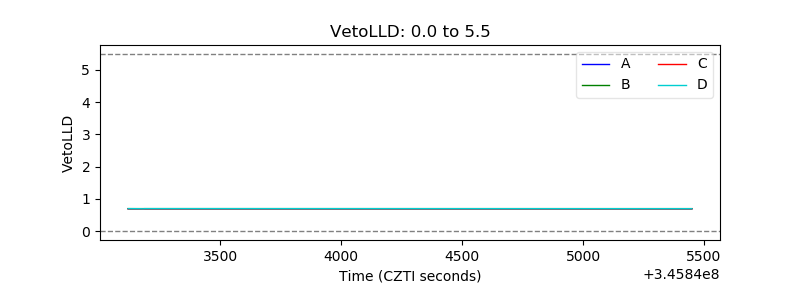 |
| Alpha Counter |  |
| _CPM_Rate | 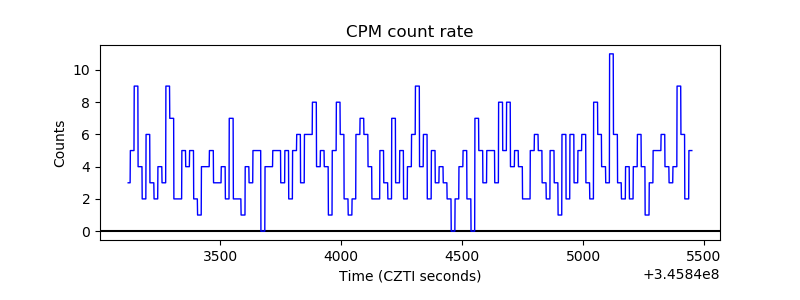 |
| CZT Counter | 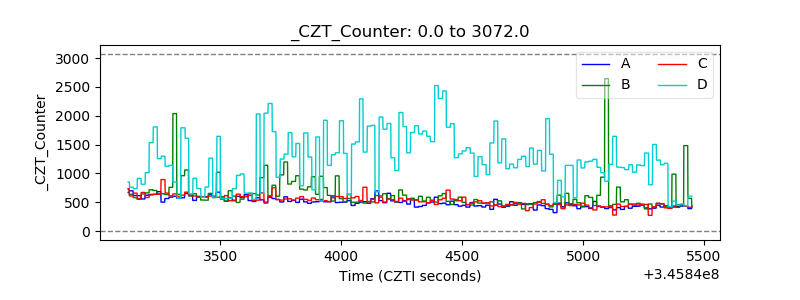 |
| +2.5 Volts monitor |  |
| +5 Volts monitor |  |
| _ROLL_ROT | 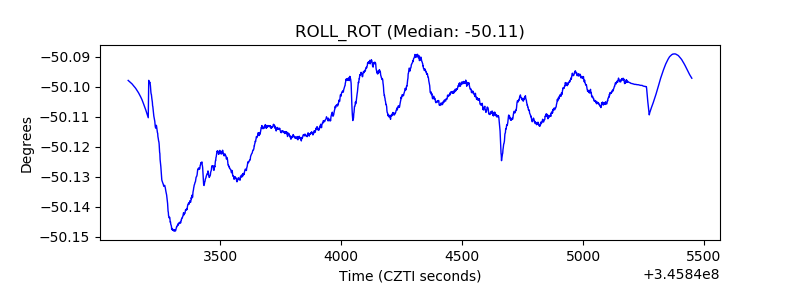 |
| _Roll_DEC | 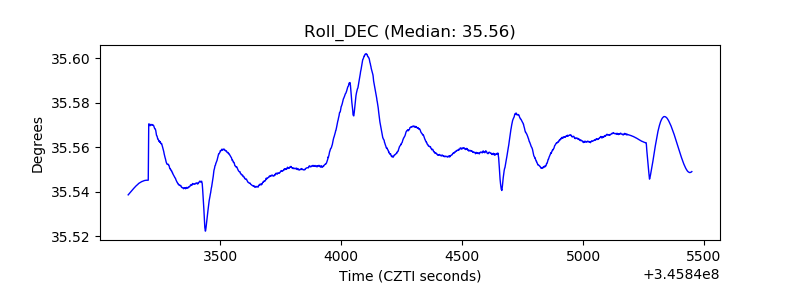 |
| _Roll_RA | 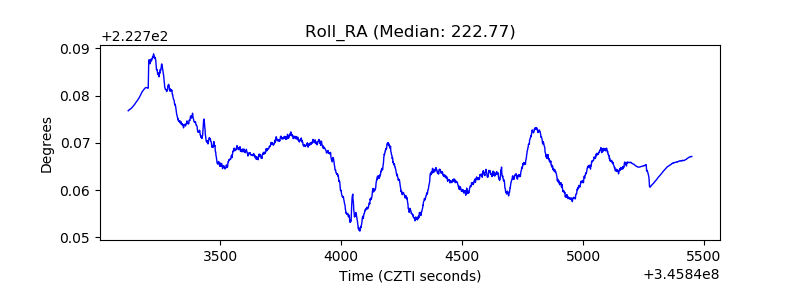 |
| Veto Counter | 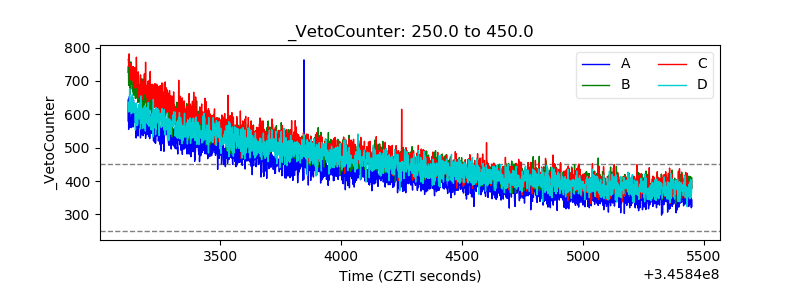 |