| Param | Original file | Final file |
|---|---|---|
| Filename | modeM0/AS1C05_019T04_9000004074cztM0_level2.fits | modeM0/AS1C05_019T04_9000004074cztM0_level2_quad_clean.evt |
| Size (bytes) | 916,488,000 | 998,763,840 |
| Size | 874.0 MB | 952.5 MB |
| Events in quadrant A | 5,678,226 | 6,254,023 |
| Events in quadrant B | 5,444,414 | 6,290,403 |
| Events in quadrant C | 5,535,968 | 5,967,429 |
| Events in quadrant D | 4,684,400 | 5,326,586 |
| Mode M9 | |||
|---|---|---|---|
| Quadrant | BADHDUFLAG | Total packets | Discarded packets |
| A | 0 | 169 | 0 |
| B | 0 | 169 | 0 |
| C | 0 | 169 | 0 |
| D | 0 | 169 | 0 |
| Mode M0 | |||
|---|---|---|---|
| Quadrant | BADHDUFLAG | Total packets | Discarded packets |
| A | 0 | 194197 | 0 |
| B | 0 | 210328 | 0 |
| C | 0 | 199572 | 0 |
| D | 0 | 272377 | 0 |
| Mode SS | |||
|---|---|---|---|
| Quadrant | BADHDUFLAG | Total packets | Discarded packets |
| A | 0 | 1912 | 0 |
| B | 0 | 1912 | 0 |
| C | 0 | 1912 | 0 |
| D | 0 | 1912 | 0 |
| Quadrant | Total seconds | Saturated seconds | Saturation percentage |
|---|---|---|---|
| A | 93512 | 793 | 0.848020% |
| B | 93512 | 1487 | 1.590170% |
| C | 93511 | 1466 | 1.567730% |
| D | 93512 | 5819 | 6.222731% |
Noise dominated data is calculated using 1-second bins in cleaned event files. If a bin has >2000 counts, and if more than 50% of those come from <1% of pixels, then it is considered to be noise-dominated and hence unusable.
| Quadrant | # 1 sec bins | Bins with >0 counts | Bins with >2000 counts | High rate bins dominated by noise | Noise dominated (total time) | Noise dominated (detector-on time) | Marked lightcurve |
|---|---|---|---|---|---|---|---|
| A | 110717 | 93503 | 0 | 0 | 0.00% | 0.00% | 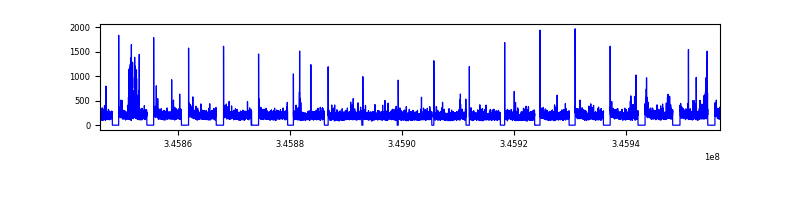 |
| B | 110717 | 93503 | 0 | 0 | 0.00% | 0.00% | 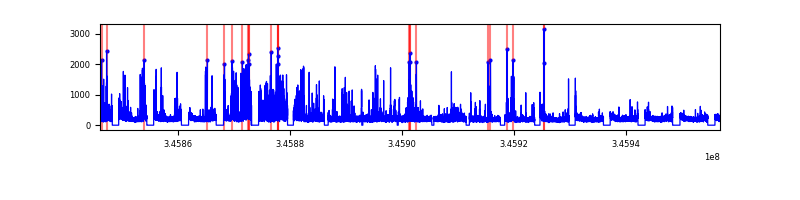 |
| C | 110717 | 93504 | 0 | 0 | 0.00% | 0.00% |  |
| D | 110717 | 93454 | 0 | 0 | 0.00% | 0.00% | 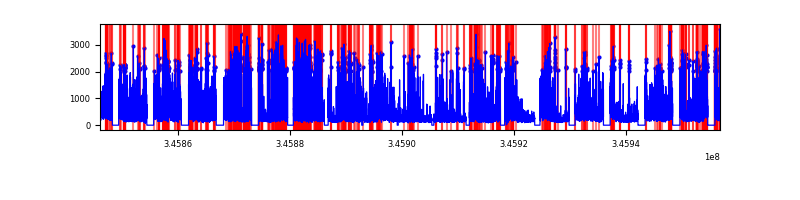 |
Top three noisy pixels from each quadrant. If the there are fewer than three noisy pixels in the level2.evt file, extra rows are filled as -1
| Pixel properties | Quadrant properties | ||||||
|---|---|---|---|---|---|---|---|
| Quadrant | DetID | PixID | Counts | Sigma | Mean | Median | Sigma |
| A | 0 | 29 | 5596 | 11.57 | 1480 | 1395 | 363.2 |
| A | 7 | 110 | 4593 | 8.81 | 1480 | 1395 | 363.2 |
| A | 0 | 30 | 4329 | 8.08 | 1480 | 1395 | 363.2 |
| B | 2 | 9 | 4317 | 10.51 | 1442 | 1383 | 279.2 |
| B | 2 | 8 | 3663 | 8.17 | 1442 | 1383 | 279.2 |
| B | 5 | 128 | 3561 | 7.8 | 1442 | 1383 | 279.2 |
| C | 1 | 80 | 4330 | 7.97 | 1462 | 1375 | 370.7 |
| C | 1 | 81 | 4302 | 7.9 | 1462 | 1375 | 370.7 |
| C | 12 | 241 | 3990 | 7.05 | 1462 | 1375 | 370.7 |
| D | 7 | 3 | 3324 | 5.97 | 1335 | 1218 | 352.6 |
| D | 6 | 231 | 3320 | 5.96 | 1335 | 1218 | 352.6 |
| D | 6 | 67 | 3252 | 5.77 | 1335 | 1218 | 352.6 |
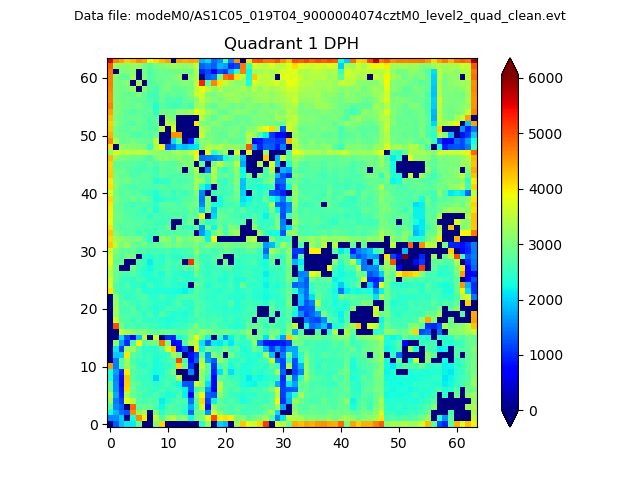
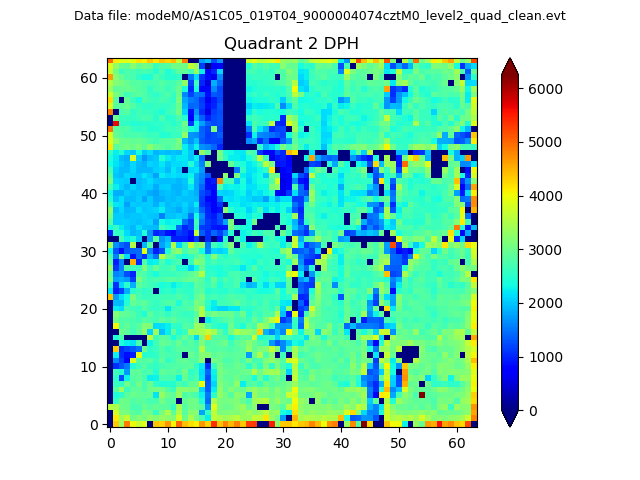
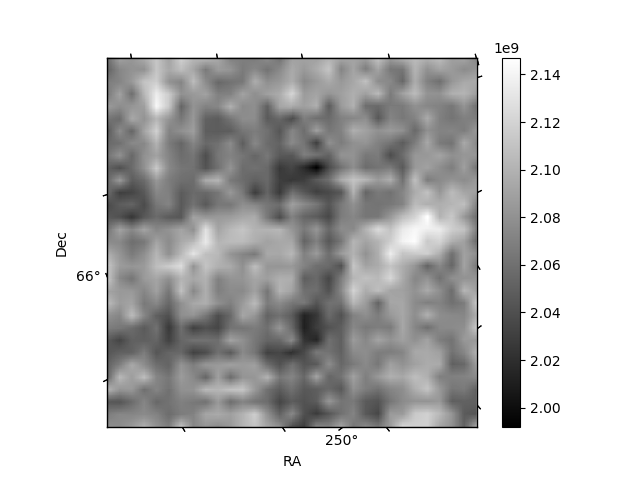
Histogram calculated using DETX and DETY for each event in the final _common_clean file
| Quadrant A | 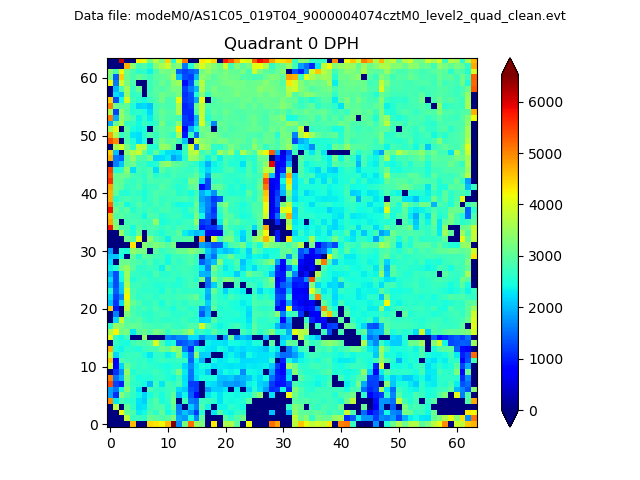 |
 |
Quadrant B |
|---|---|---|---|
| Quadrant D |  |
 |
Quadrant C |
| Plot type | Count rate plots | Images |
|---|---|---|
| Comparison with Poisson distribution Blue bars denote a histogram of data divided into 1 sec bins. Red curve is a Poisson curve with rate = median count rate of data. |
 |
 |
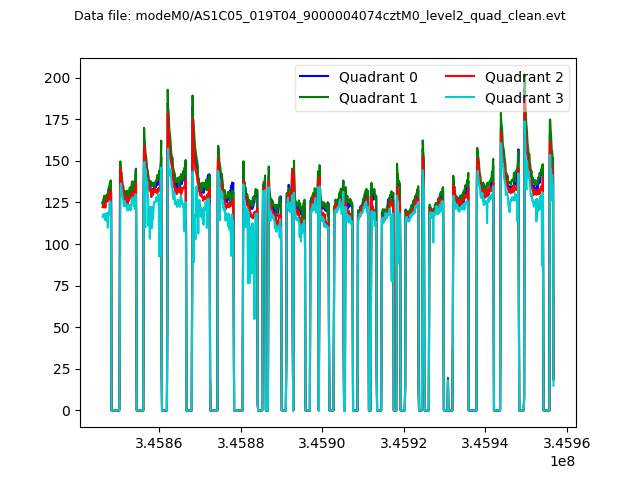
| Quadrant-wise count rates Data is divided into 100 sec bins |
 |
|
| Module-wise count rates for Quadrant A Data is divided into 100 sec bins |
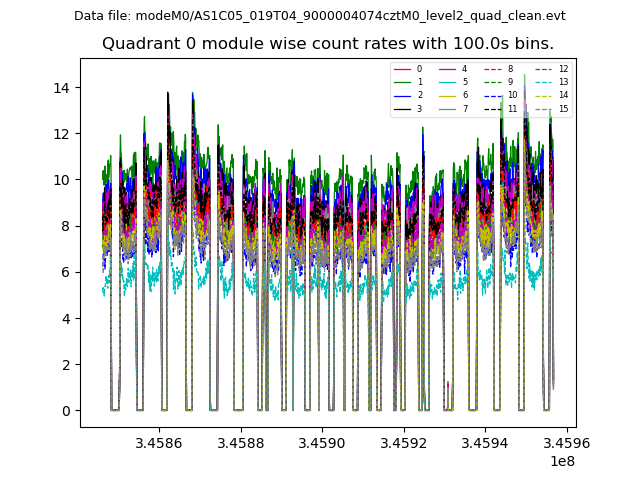 |
 |
| Module-wise count rates for Quadrant B Data is divided into 100 sec bins |
 |
 |
| Module-wise count rates for Quadrant C Data is divided into 100 sec bins |
 |
 |
| Module-wise count rates for Quadrant D Data is divided into 100 sec bins |
 |
 |
| Parameter | Plot |
|---|---|
| CZT HV Monitor |  |
| D_VDD | 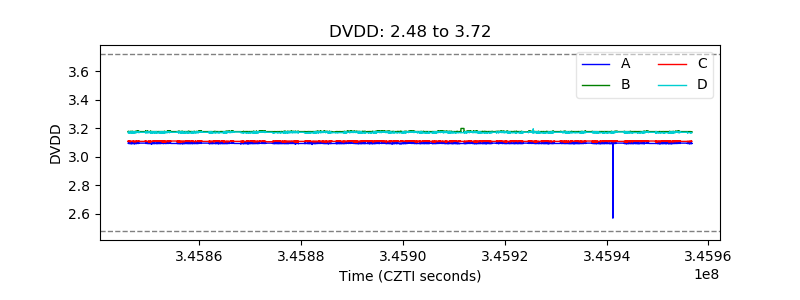 |
| Temperature 1 | 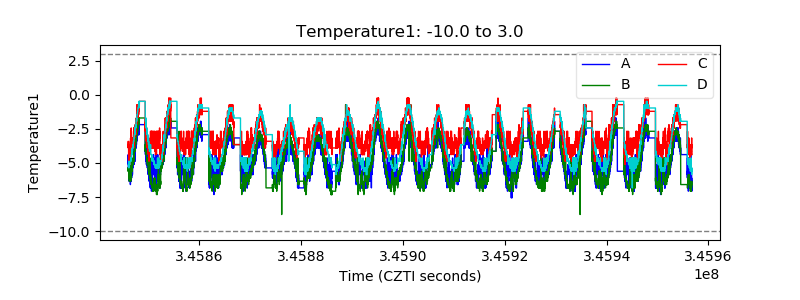 |
| Veto HV Monitor |  |
| Veto LLD | 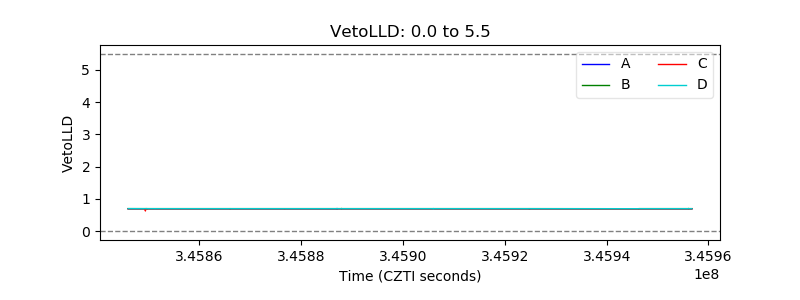 |
| Alpha Counter |  |
| _CPM_Rate |  |
| CZT Counter |  |
| +2.5 Volts monitor |  |
| +5 Volts monitor |  |
| _ROLL_ROT |  |
| _Roll_DEC | 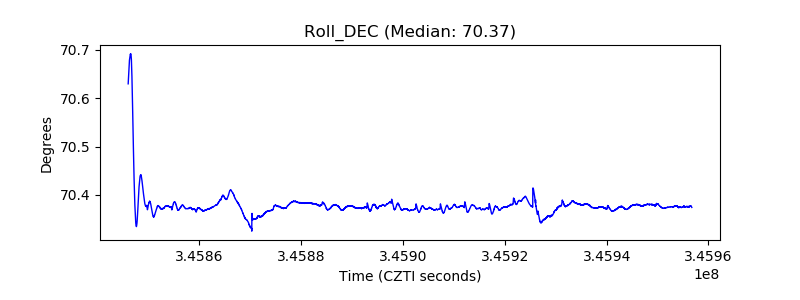 |
| _Roll_RA |  |
| Veto Counter |  |