| Param | Original file | Final file |
|---|---|---|
| Filename | modeM0/AS1C05_019T04_9000004074_28223cztM0_level2.evt | modeM0/AS1C05_019T04_9000004074_28223cztM0_level2_quad_clean.evt |
| Size (bytes) | 312,243,840 | 51,963,840 |
| Size | 297.8 MB | 49.6 MB |
| Events in quadrant A | 1,751,022 | 338,490 |
| Events in quadrant B | 2,049,095 | 343,855 |
| Events in quadrant C | 1,814,368 | 332,081 |
| Events in quadrant D | 3,600,707 | 308,108 |
| Mode M9 | |||
|---|---|---|---|
| Quadrant | BADHDUFLAG | Total packets | Discarded packets |
| A | 0 | 11 | 0 |
| B | 0 | 11 | 0 |
| C | 0 | 11 | 0 |
| D | 0 | 11 | 0 |
| Mode M0 | |||
|---|---|---|---|
| Quadrant | BADHDUFLAG | Total packets | Discarded packets |
| A | 0 | 7478 | 0 |
| B | 0 | 8380 | 0 |
| C | 0 | 7732 | 0 |
| D | 0 | 13144 | 0 |
| Quadrant | Total seconds | Saturated seconds | Saturation percentage |
|---|---|---|---|
| A | 3533 | 30 | 0.849137% |
| B | 3533 | 38 | 1.075573% |
| C | 3533 | 55 | 1.556751% |
| D | 3532 | 254 | 7.191393% |
Noise dominated data is calculated using 1-second bins in cleaned event files. If a bin has >2000 counts, and if more than 50% of those come from <1% of pixels, then it is considered to be noise-dominated and hence unusable.
| Quadrant | # 1 sec bins | Bins with >0 counts | Bins with >2000 counts | High rate bins dominated by noise | Noise dominated (total time) | Noise dominated (detector-on time) | Marked lightcurve |
|---|---|---|---|---|---|---|---|
| A | 4673 | 3534 | 2 | 2 | 0.04% | 0.06% | 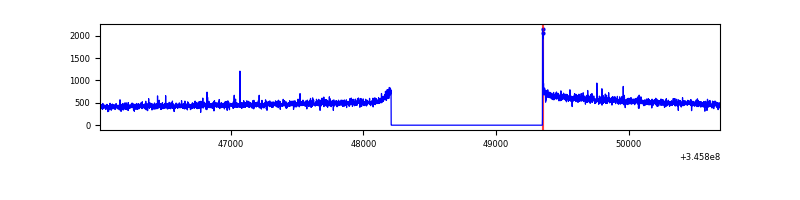 |
| B | 4673 | 3534 | 13 | 13 | 0.28% | 0.37% | 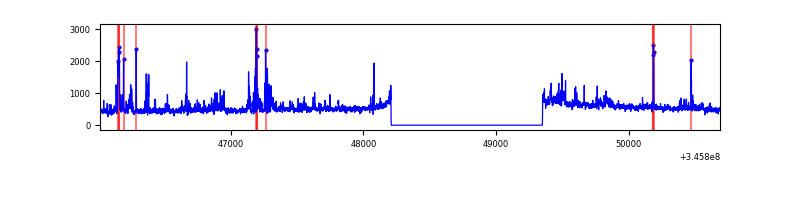 |
| C | 4673 | 3533 | 0 | 0 | 0.00% | 0.00% | 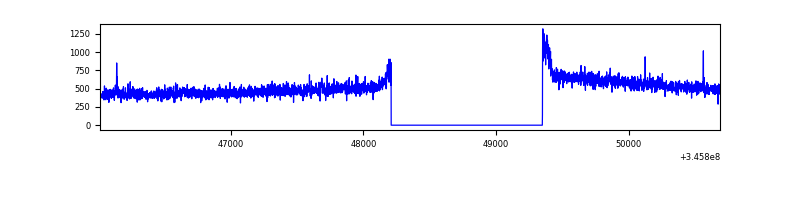 |
| D | 4672 | 3533 | 175 | 175 | 3.75% | 4.95% | 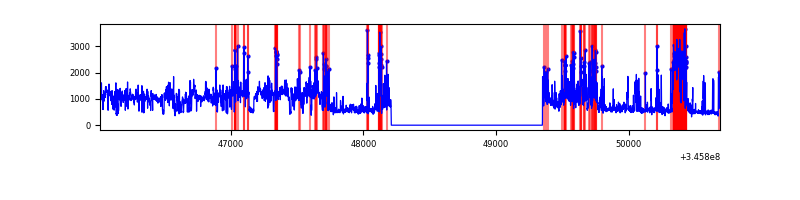 |
Top three noisy pixels from each quadrant. If the there are fewer than three noisy pixels in the level2.evt file, extra rows are filled as -1
| Pixel properties | Quadrant properties | ||||||
|---|---|---|---|---|---|---|---|
| Quadrant | DetID | PixID | Counts | Sigma | Mean | Median | Sigma |
| A | 8 | 192 | 7124 | 73.65 | 450 | 442 | 90.7 |
| A | 13 | 254 | 5688 | 57.82 | 450 | 442 | 90.7 |
| A | 3 | 137 | 4311 | 42.64 | 450 | 442 | 90.7 |
| B | 10 | 245 | 266395 | 3078.1 | 447 | 435 | 86.4 |
| B | 12 | 111 | 10326 | 114.47 | 447 | 435 | 86.4 |
| B | 4 | 200 | 9666 | 106.83 | 447 | 435 | 86.4 |
| C | 14 | 238 | 70722 | 695.62 | 433 | 435 | 101.0 |
| C | 3 | 233 | 25148 | 244.58 | 433 | 435 | 101.0 |
| C | 1 | 16 | 25064 | 243.75 | 433 | 435 | 101.0 |
| D | 1 | 52 | 1370144 | 13585.48 | 426 | 414 | 100.8 |
| D | 2 | 250 | 370477 | 3670.42 | 426 | 414 | 100.8 |
| D | 8 | 195 | 64064 | 631.3 | 426 | 414 | 100.8 |
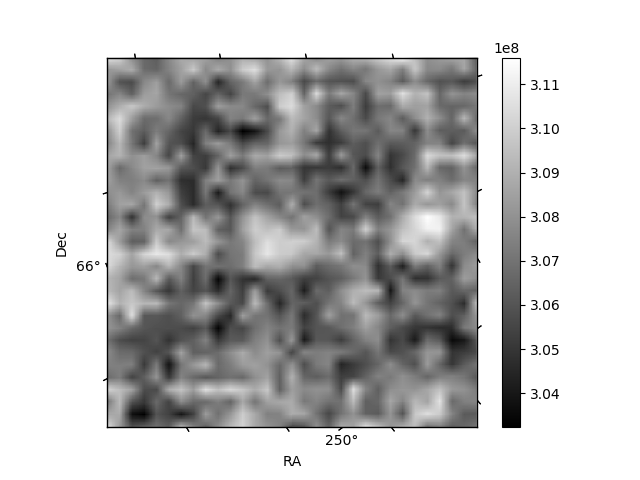
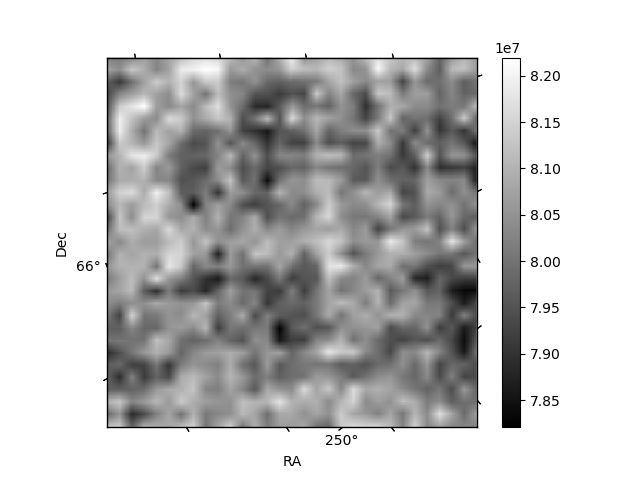
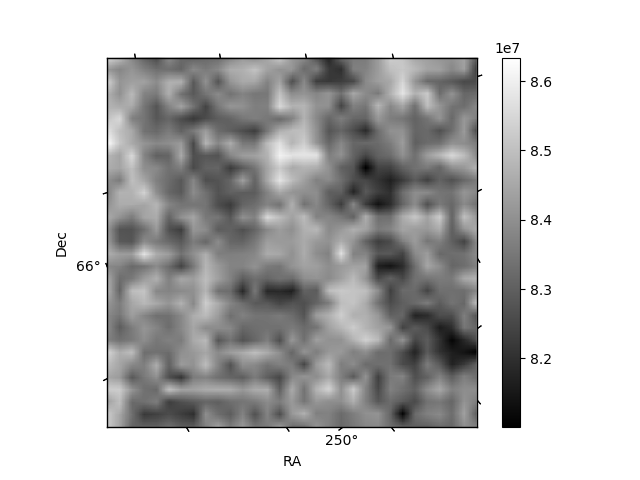
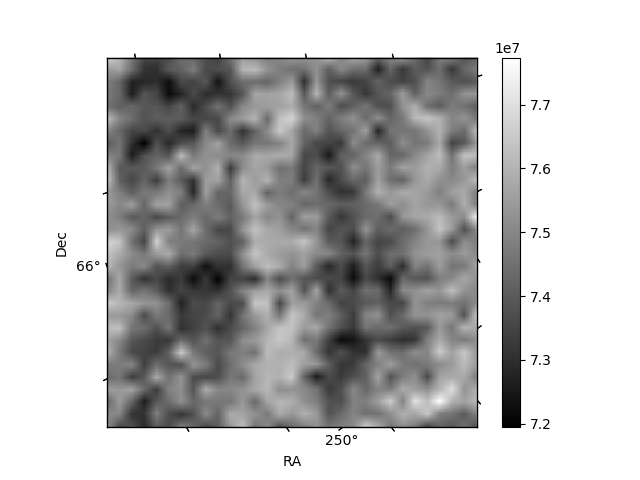
Histogram calculated using DETX and DETY for each event in the final _common_clean file
| Quadrant A | 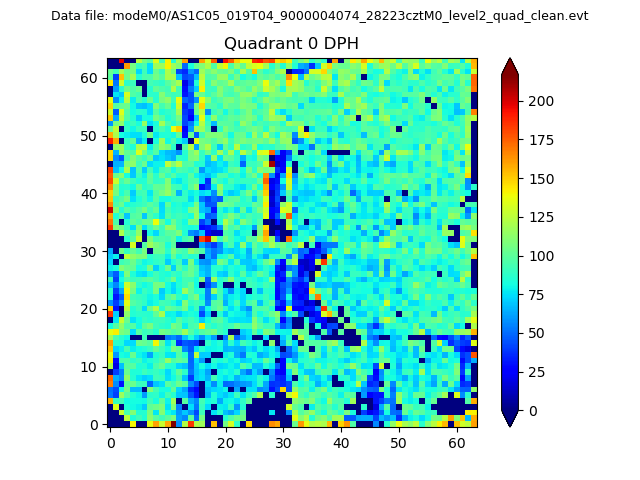 |
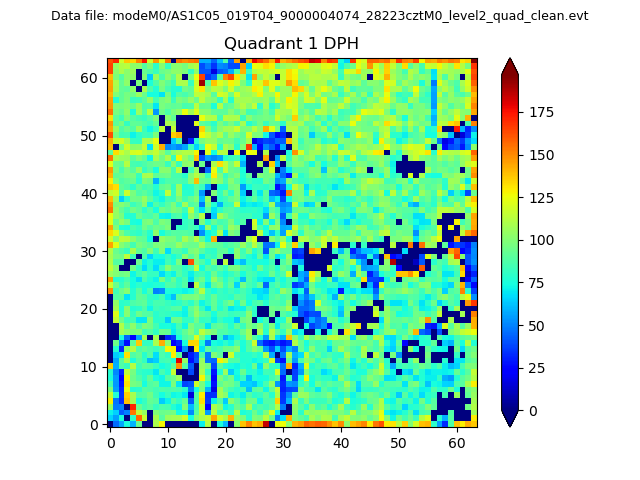 |
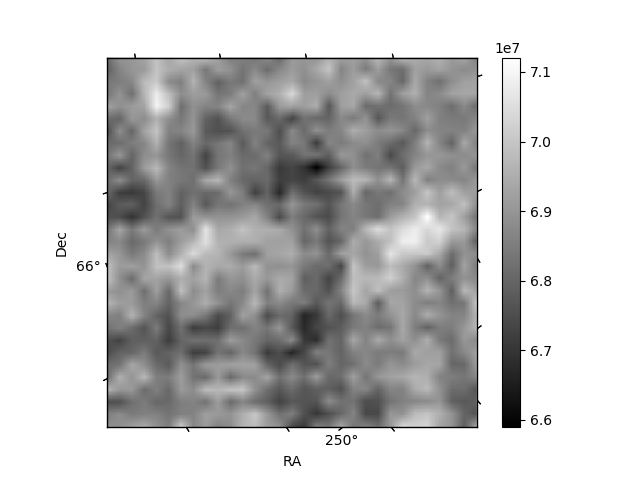
Quadrant B |
|---|---|---|---|
| Quadrant D |  |
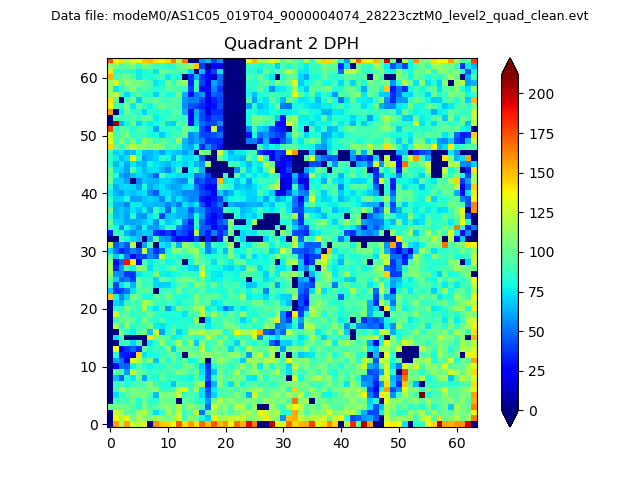 |
Quadrant C |
| Plot type | Count rate plots | Images |
|---|---|---|
| Comparison with Poisson distribution Blue bars denote a histogram of data divided into 1 sec bins. Red curve is a Poisson curve with rate = median count rate of data. |
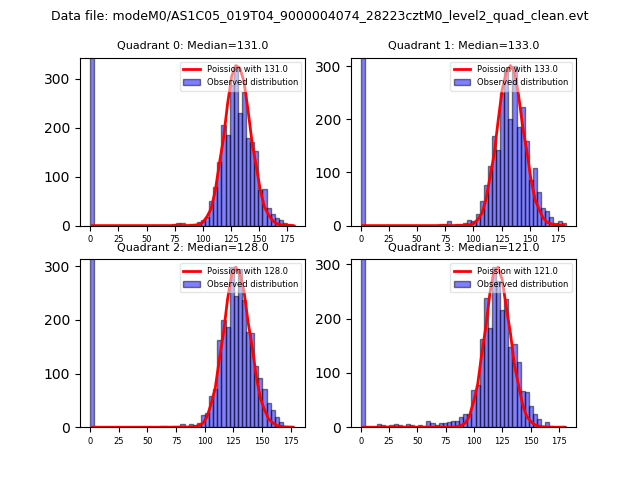 |
 |
| Quadrant-wise count rates Data is divided into 100 sec bins |
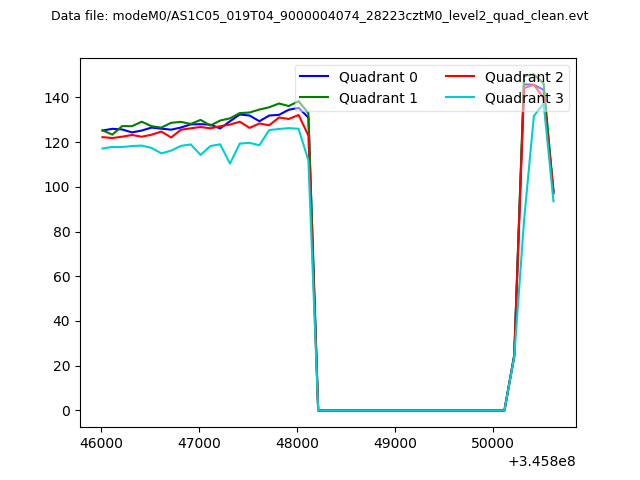 |
|
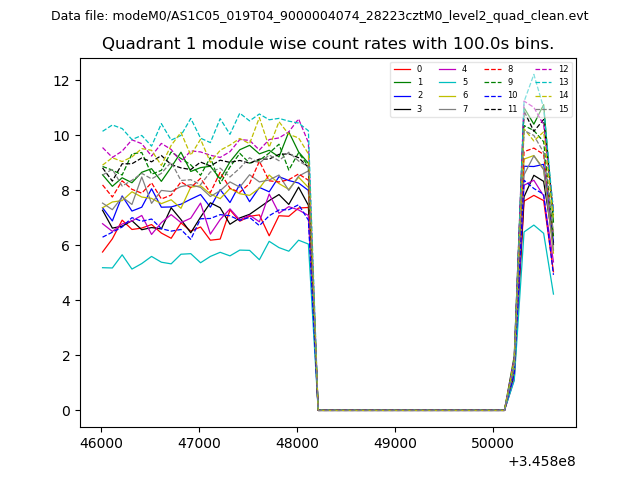
| Module-wise count rates for Quadrant A Data is divided into 100 sec bins |
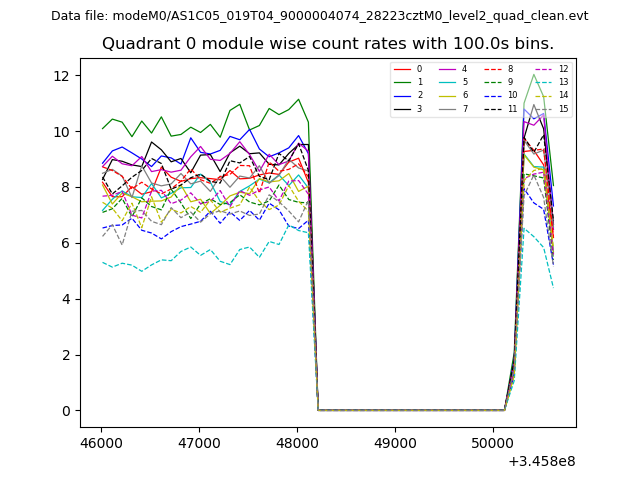 |
 |
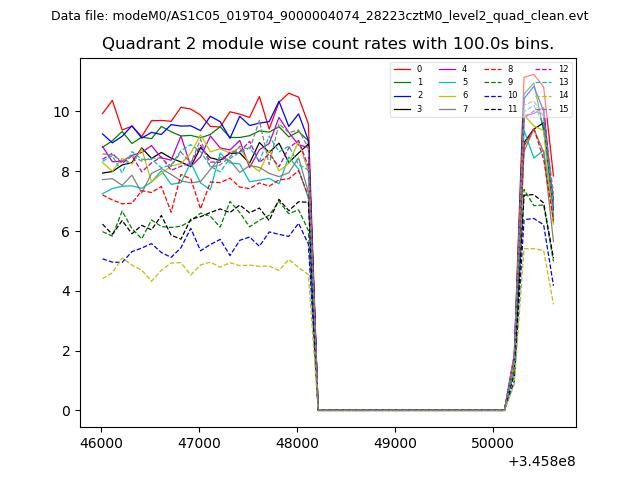
| Module-wise count rates for Quadrant B Data is divided into 100 sec bins |
 |
 |
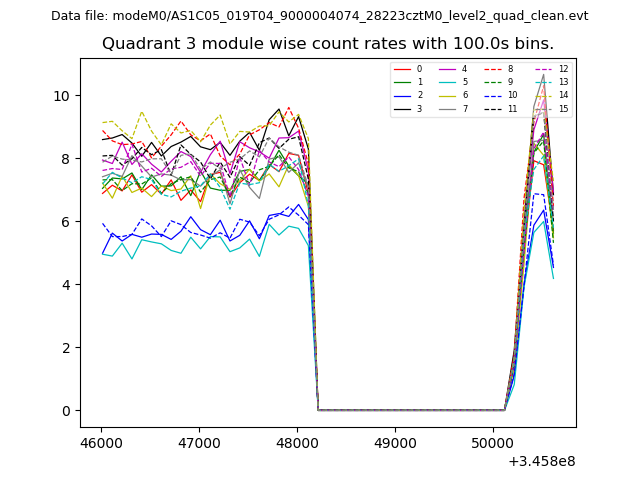
| Module-wise count rates for Quadrant C Data is divided into 100 sec bins |
 |
 |
| Module-wise count rates for Quadrant D Data is divided into 100 sec bins |
 |
 |
| Parameter | Plot |
|---|---|
| CZT HV Monitor | 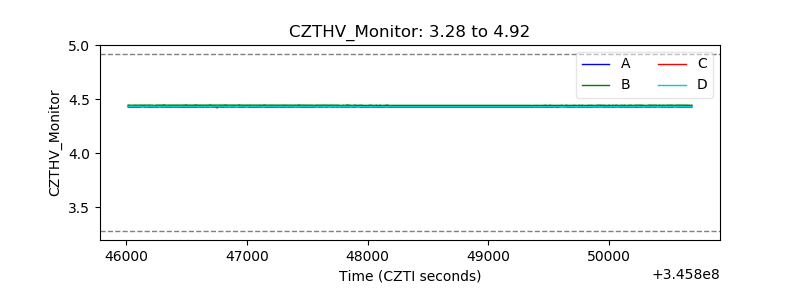 |
| D_VDD | 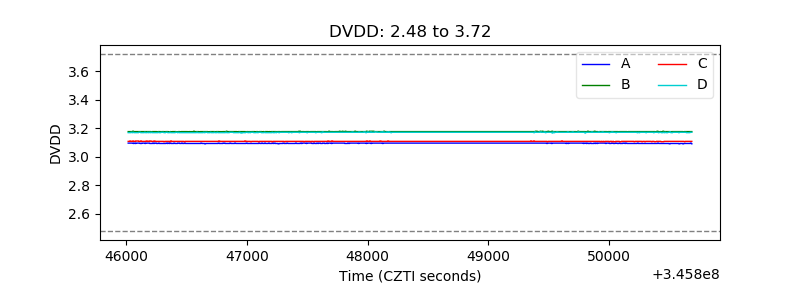 |
| Temperature 1 | 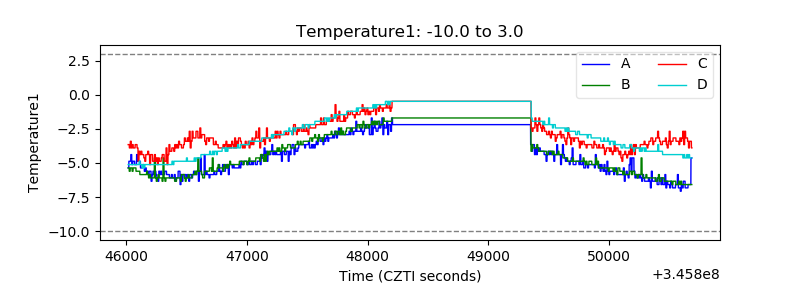 |
| Veto HV Monitor | 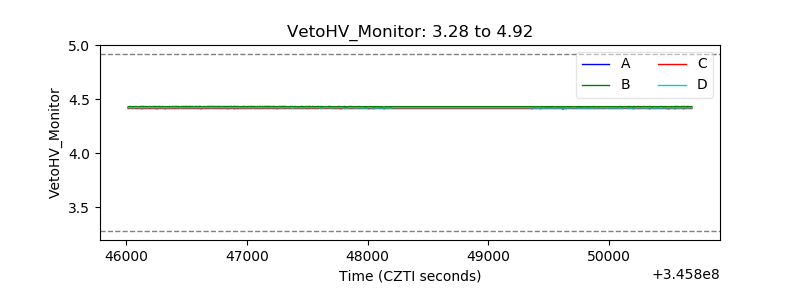 |
| Veto LLD | 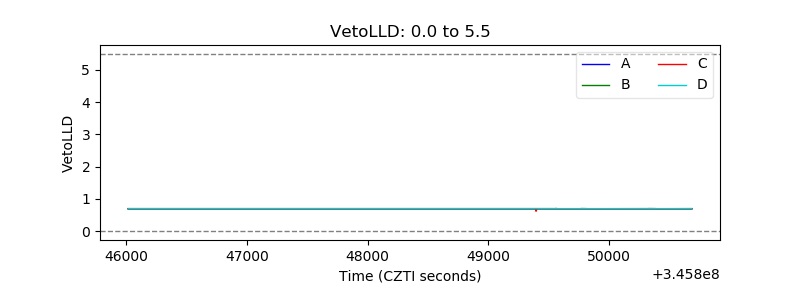 |
| Alpha Counter | 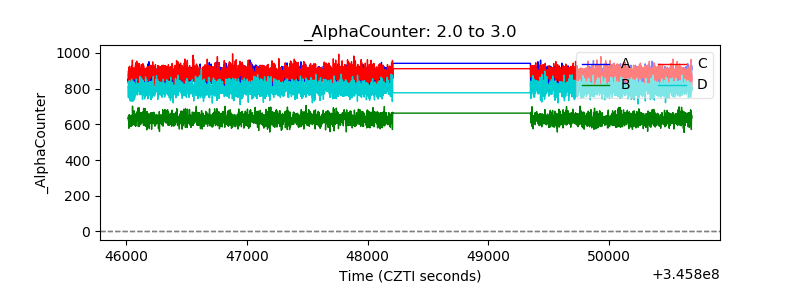 |
| _CPM_Rate | 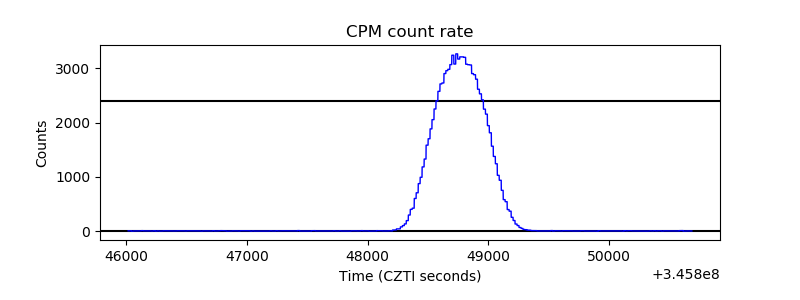 |
| CZT Counter | 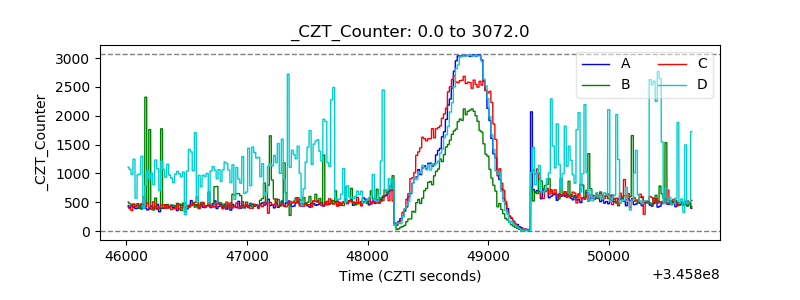 |
| +2.5 Volts monitor |  |
| +5 Volts monitor |  |
| _ROLL_ROT | 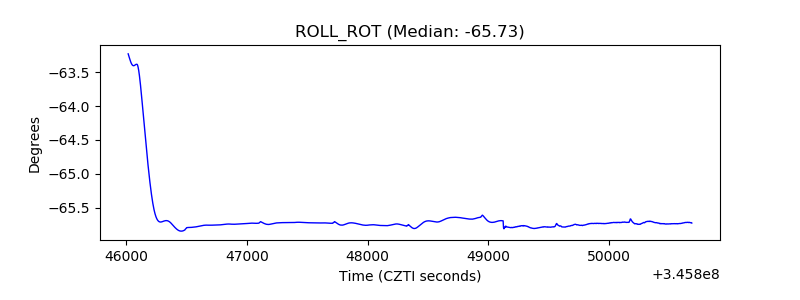 |
| _Roll_DEC | 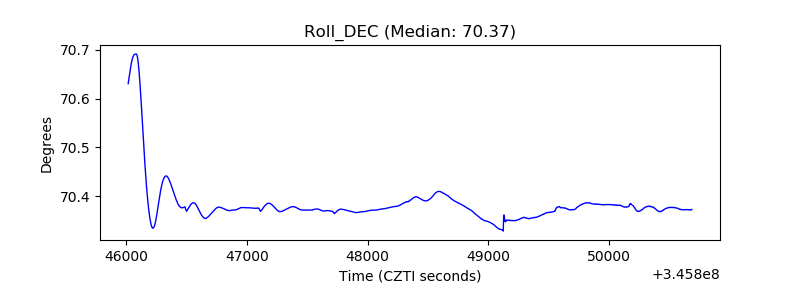 |
| _Roll_RA | 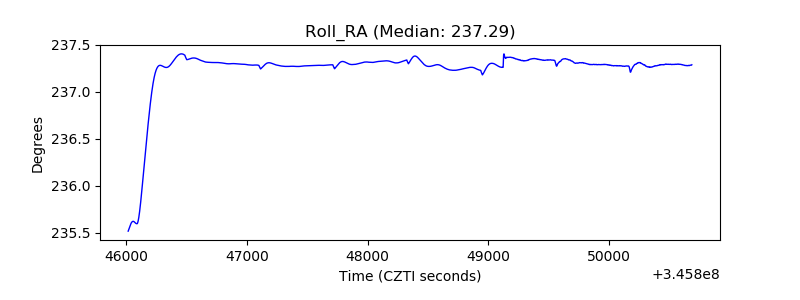 |
| Veto Counter | 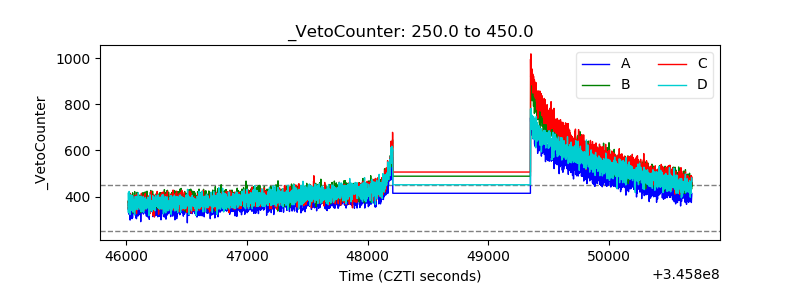 |