| Param | Original file | Final file |
|---|---|---|
| Filename | modeM0/AS1C05_019T04_9000004074_28224cztM0_level2.evt | modeM0/AS1C05_019T04_9000004074_28224cztM0_level2_quad_clean.evt |
| Size (bytes) | 523,751,040 | 104,584,320 |
| Size | 499.5 MB | 99.7 MB |
| Events in quadrant A | 3,437,112 | 687,856 |
| Events in quadrant B | 3,819,113 | 704,785 |
| Events in quadrant C | 3,298,585 | 680,574 |
| Events in quadrant D | 4,869,322 | 643,864 |
| Mode M9 | |||
|---|---|---|---|
| Quadrant | BADHDUFLAG | Total packets | Discarded packets |
| A | 0 | 12 | 0 |
| B | 0 | 12 | 0 |
| C | 0 | 12 | 0 |
| D | 0 | 12 | 0 |
| Mode M0 | |||
|---|---|---|---|
| Quadrant | BADHDUFLAG | Total packets | Discarded packets |
| A | 0 | 14367 | 0 |
| B | 0 | 15695 | 0 |
| C | 0 | 14117 | 0 |
| D | 0 | 18888 | 0 |
| Quadrant | Total seconds | Saturated seconds | Saturation percentage |
|---|---|---|---|
| A | 6451 | 42 | 0.651062% |
| B | 6451 | 86 | 1.333127% |
| C | 6452 | 96 | 1.487911% |
| D | 6452 | 399 | 6.184129% |
Noise dominated data is calculated using 1-second bins in cleaned event files. If a bin has >2000 counts, and if more than 50% of those come from <1% of pixels, then it is considered to be noise-dominated and hence unusable.
| Quadrant | # 1 sec bins | Bins with >0 counts | Bins with >2000 counts | High rate bins dominated by noise | Noise dominated (total time) | Noise dominated (detector-on time) | Marked lightcurve |
|---|---|---|---|---|---|---|---|
| A | 7671 | 6452 | 2 | 2 | 0.03% | 0.03% | 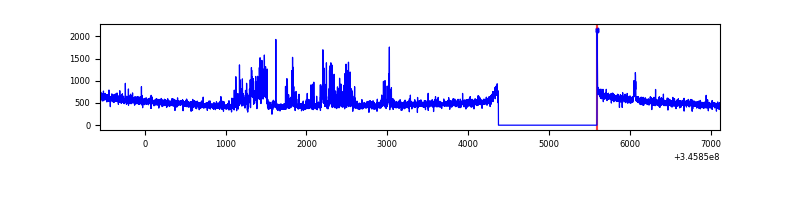 |
| B | 7671 | 6451 | 17 | 17 | 0.22% | 0.26% | 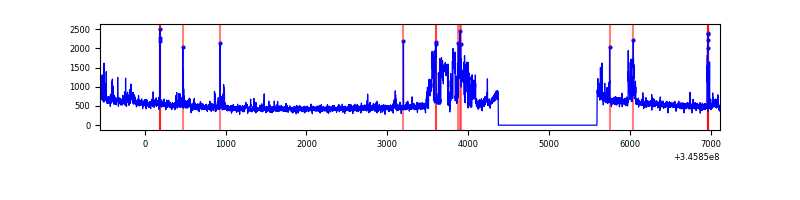 |
| C | 7672 | 6453 | 0 | 0 | 0.00% | 0.00% | 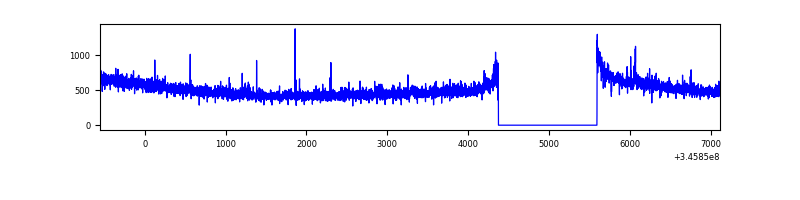 |
| D | 7672 | 6453 | 286 | 286 | 3.73% | 4.43% | 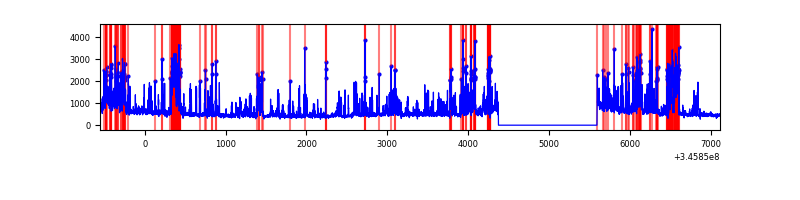 |
Top three noisy pixels from each quadrant. If the there are fewer than three noisy pixels in the level2.evt file, extra rows are filled as -1
| Pixel properties | Quadrant properties | ||||||
|---|---|---|---|---|---|---|---|
| Quadrant | DetID | PixID | Counts | Sigma | Mean | Median | Sigma |
| A | 12 | 16 | 253000 | 1582.31 | 813 | 800 | 159.4 |
| A | 12 | 194 | 42054 | 258.83 | 813 | 800 | 159.4 |
| A | 13 | 254 | 10568 | 61.28 | 813 | 800 | 159.4 |
| B | 10 | 245 | 581529 | 3807.67 | 815 | 796 | 152.5 |
| B | 12 | 111 | 18314 | 114.86 | 815 | 796 | 152.5 |
| B | 0 | 183 | 17055 | 106.6 | 815 | 796 | 152.5 |
| C | 14 | 238 | 130621 | 704.11 | 795 | 802 | 184.4 |
| C | 3 | 233 | 45568 | 242.8 | 795 | 802 | 184.4 |
| C | 1 | 16 | 19648 | 102.22 | 795 | 802 | 184.4 |
| D | 1 | 52 | 1267525 | 6970.44 | 775 | 753 | 181.7 |
| D | 2 | 250 | 454006 | 2494.04 | 775 | 753 | 181.7 |
| D | 8 | 195 | 80948 | 441.27 | 775 | 753 | 181.7 |
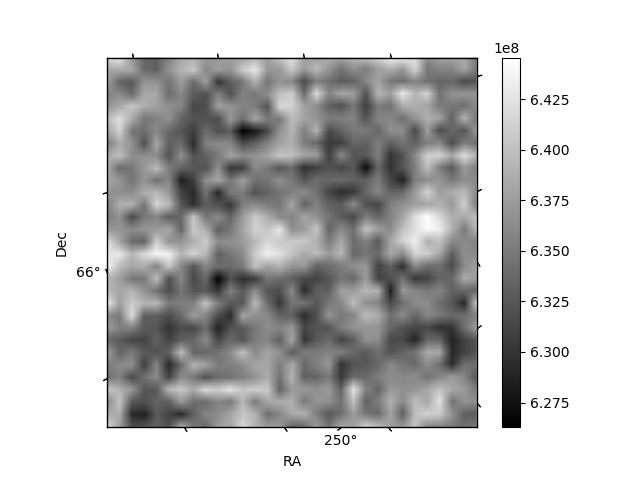
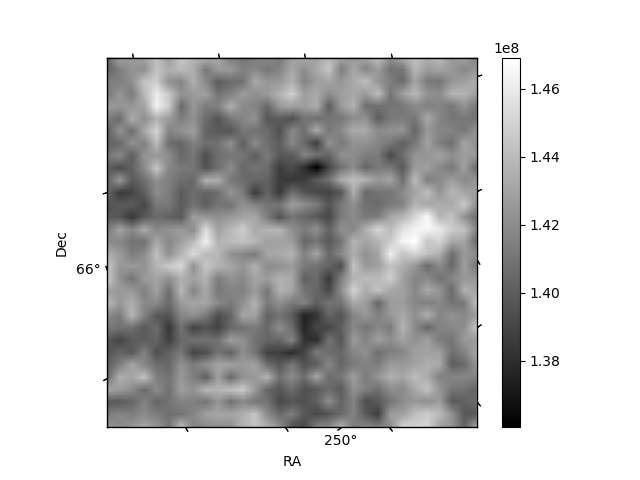
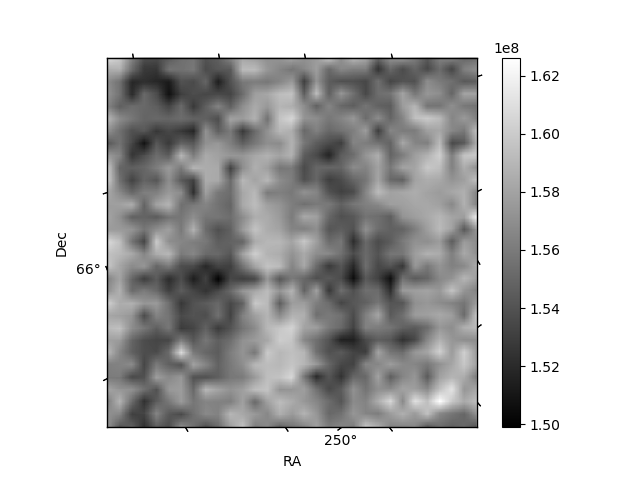
Histogram calculated using DETX and DETY for each event in the final _common_clean file
| Quadrant A | 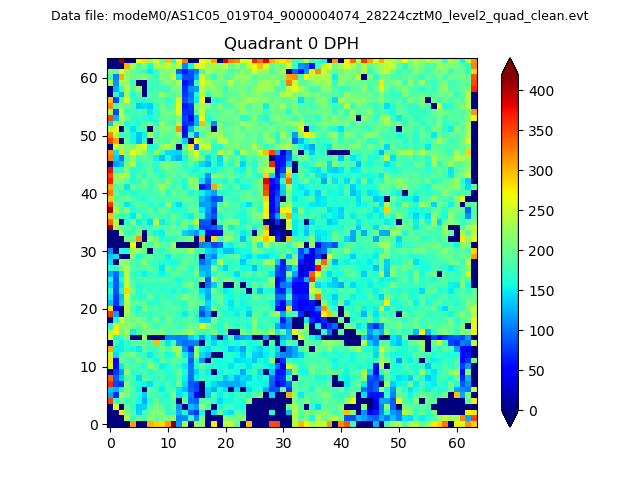 |
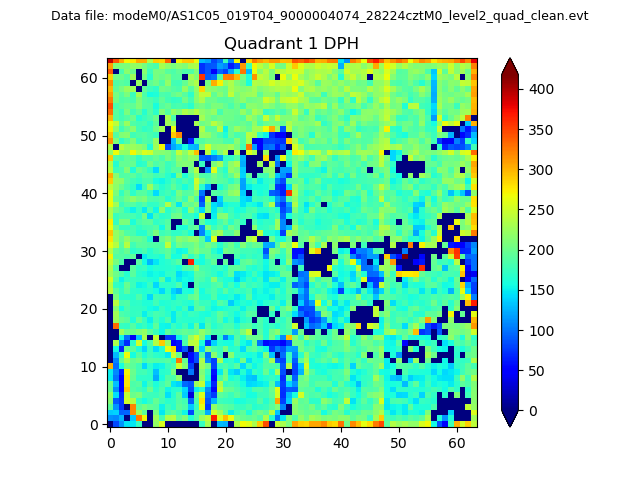 |
Quadrant B |
|---|---|---|---|
| Quadrant D | 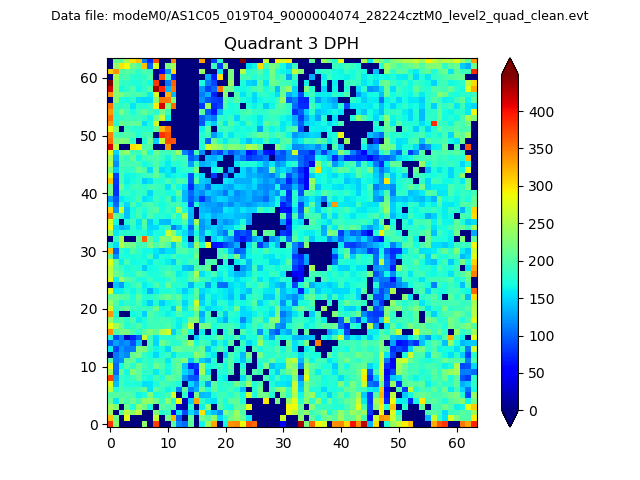 |
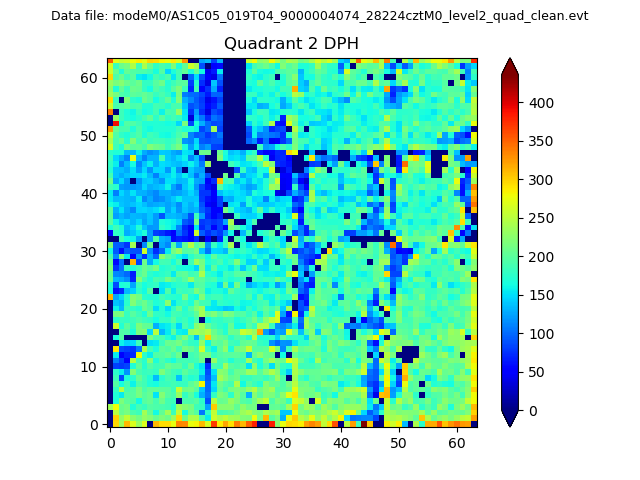 |
Quadrant C |
| Plot type | Count rate plots | Images |
|---|---|---|
| Comparison with Poisson distribution Blue bars denote a histogram of data divided into 1 sec bins. Red curve is a Poisson curve with rate = median count rate of data. |
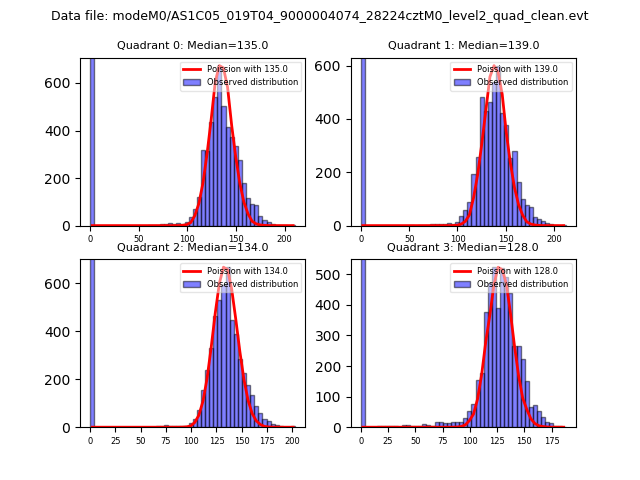 |
 |
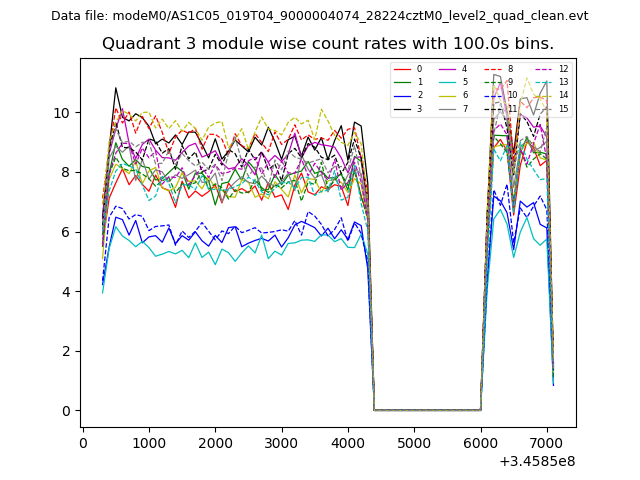
| Quadrant-wise count rates Data is divided into 100 sec bins |
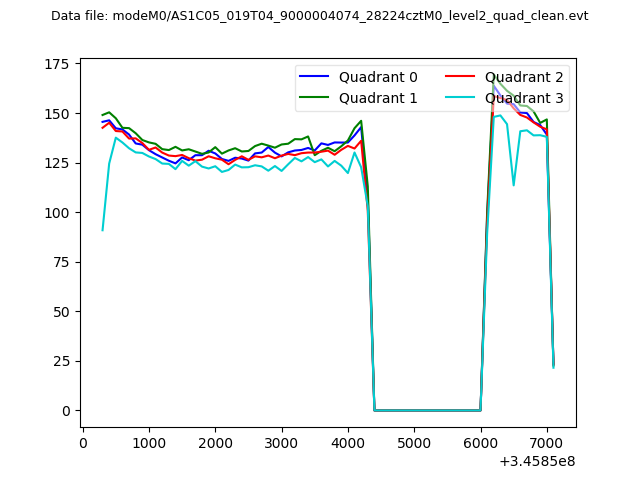 |
|
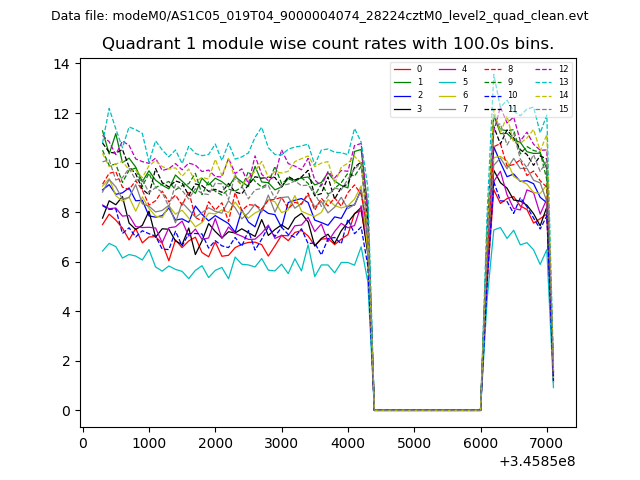
| Module-wise count rates for Quadrant A Data is divided into 100 sec bins |
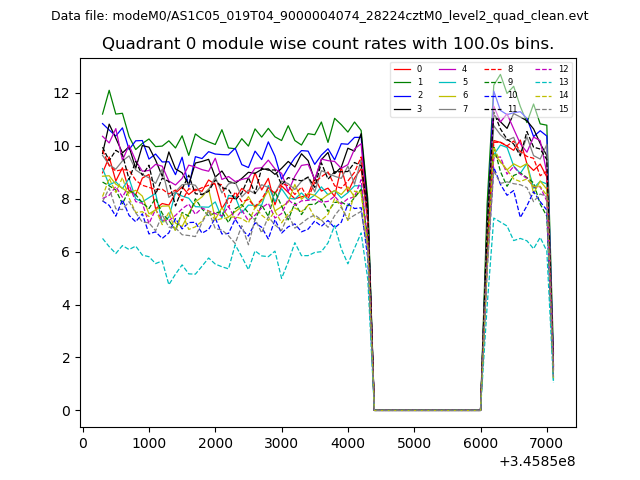 |
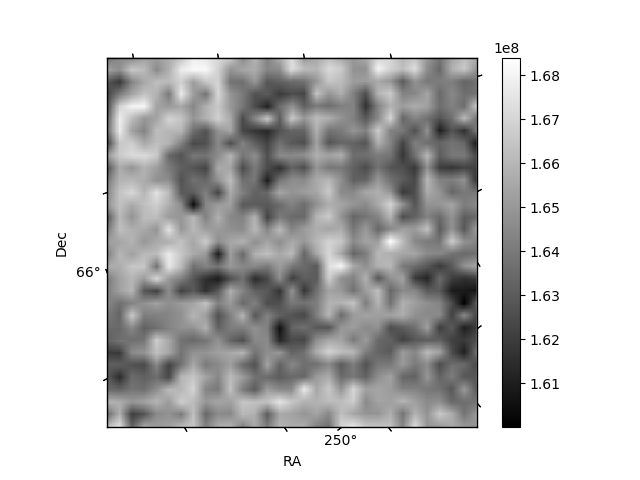 |
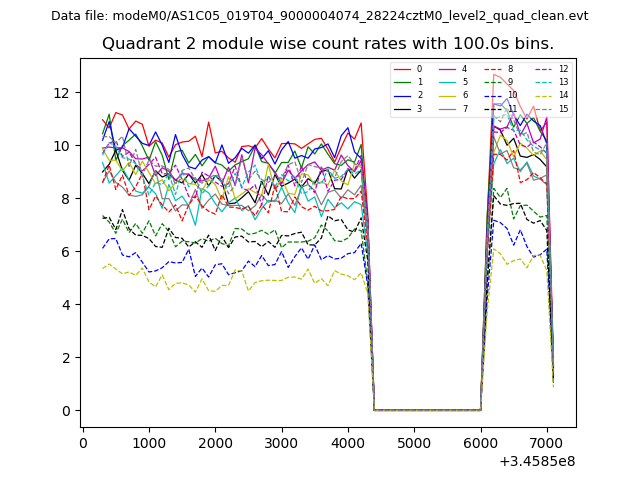
| Module-wise count rates for Quadrant B Data is divided into 100 sec bins |
 |
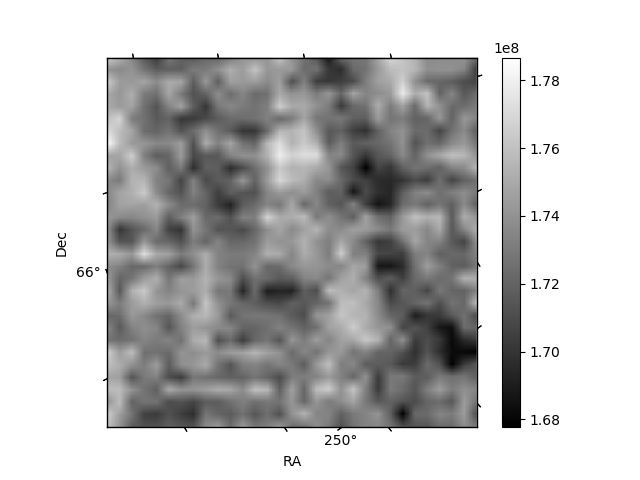 |
| Module-wise count rates for Quadrant C Data is divided into 100 sec bins |
 |
 |
| Module-wise count rates for Quadrant D Data is divided into 100 sec bins |
 |
 |
| Parameter | Plot |
|---|---|
| CZT HV Monitor | 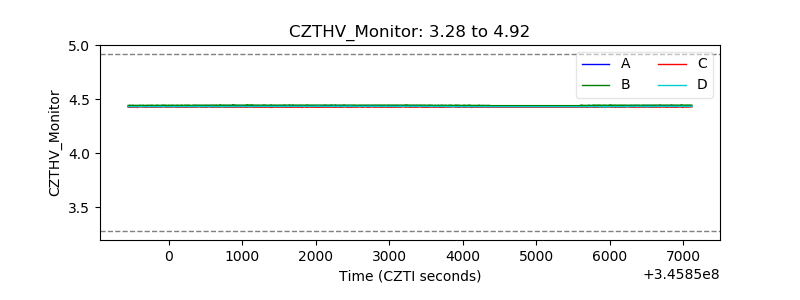 |
| D_VDD | 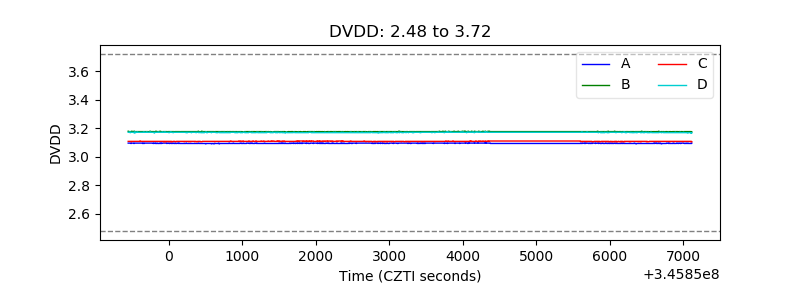 |
| Temperature 1 | 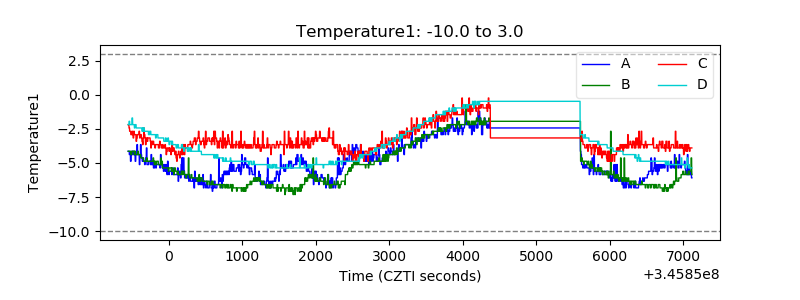 |
| Veto HV Monitor | 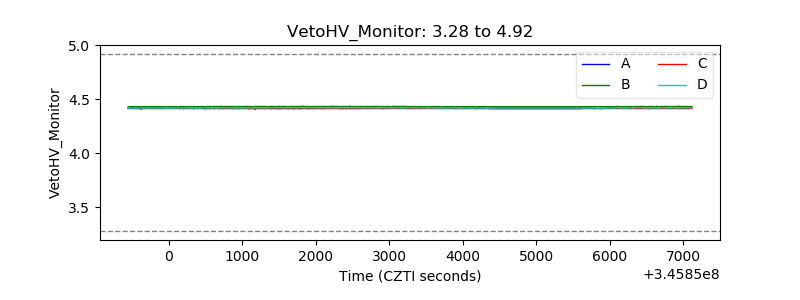 |
| Veto LLD | 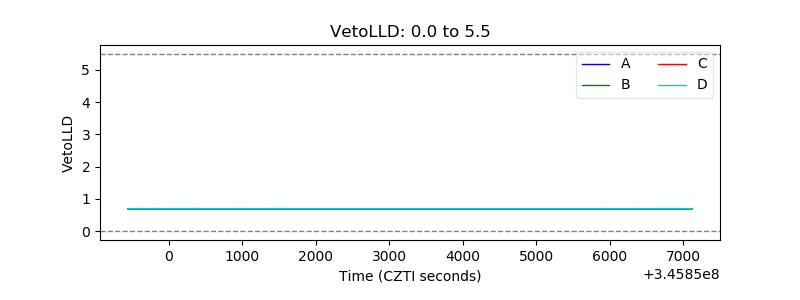 |
| Alpha Counter | 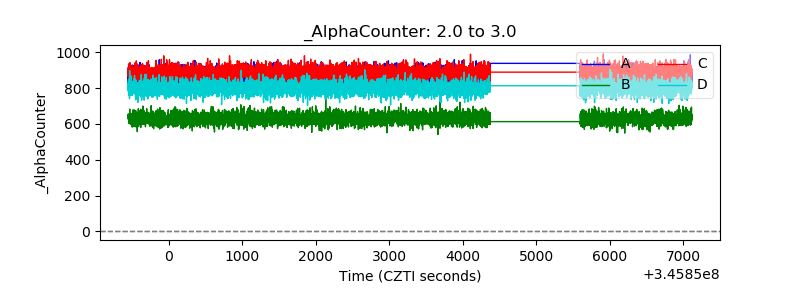 |
| _CPM_Rate | 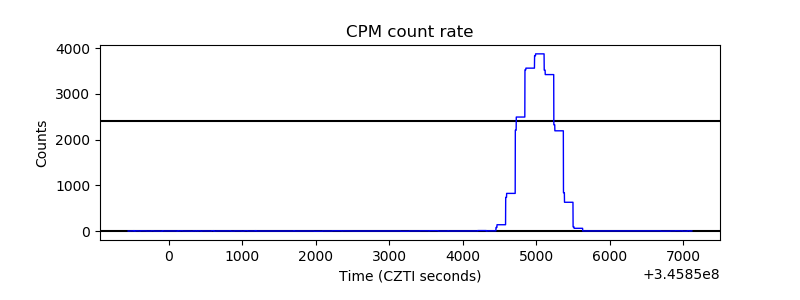 |
| CZT Counter |  |
| +2.5 Volts monitor |  |
| +5 Volts monitor | 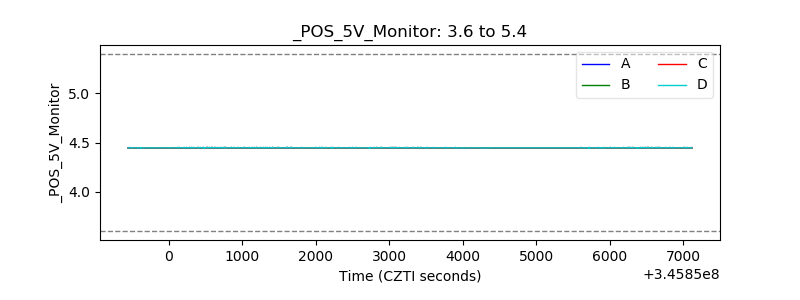 |
| _ROLL_ROT | 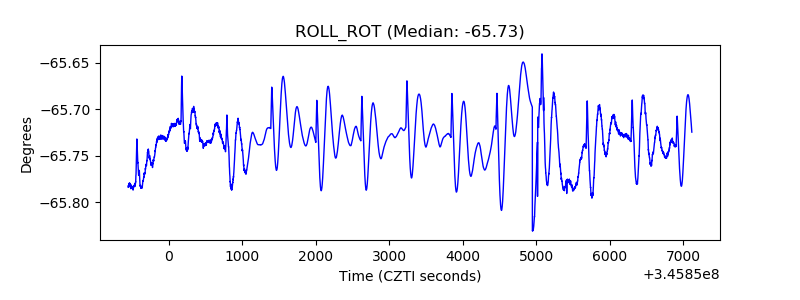 |
| _Roll_DEC | 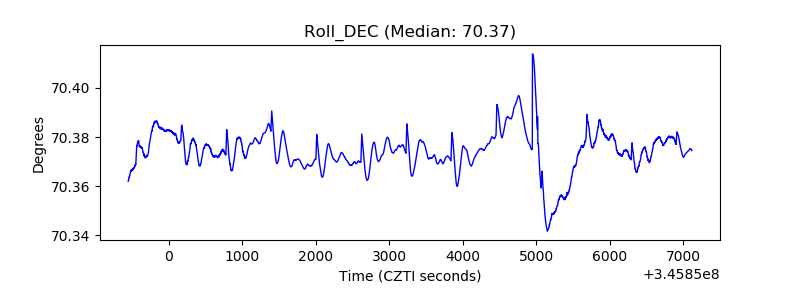 |
| _Roll_RA | 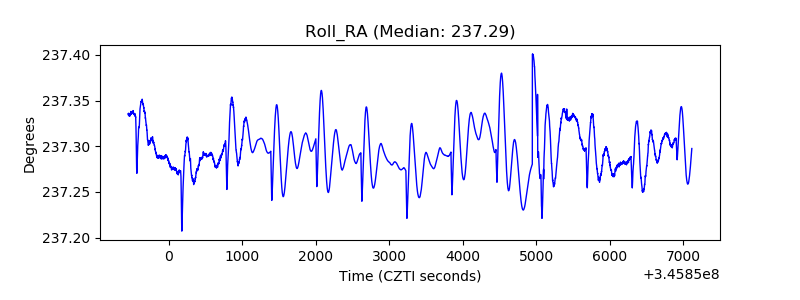 |
| Veto Counter | 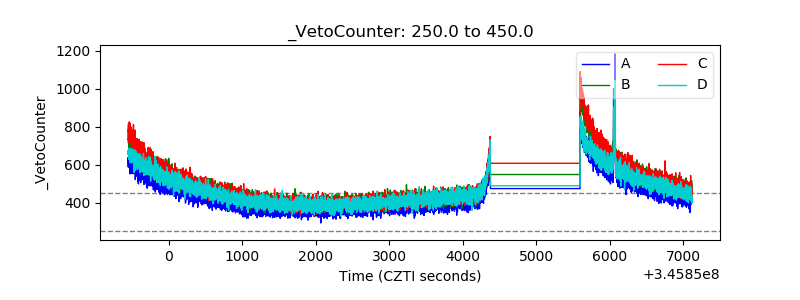 |