| Param | Original file | Final file |
|---|---|---|
| Filename | modeM0/AS1C05_019T04_9000004074_28225cztM0_level2.evt | modeM0/AS1C05_019T04_9000004074_28225cztM0_level2_quad_clean.evt |
| Size (bytes) | 542,952,000 | 122,325,120 |
| Size | 517.8 MB | 116.7 MB |
| Events in quadrant A | 3,104,126 | 837,000 |
| Events in quadrant B | 3,290,154 | 860,340 |
| Events in quadrant C | 3,262,536 | 817,741 |
| Events in quadrant D | 6,359,990 | 750,476 |
| Mode M9 | |||
|---|---|---|---|
| Quadrant | BADHDUFLAG | Total packets | Discarded packets |
| A | 0 | 13 | 0 |
| B | 0 | 13 | 0 |
| C | 0 | 13 | 0 |
| D | 0 | 13 | 0 |
| Mode M0 | |||
|---|---|---|---|
| Quadrant | BADHDUFLAG | Total packets | Discarded packets |
| A | 0 | 13260 | 0 |
| B | 0 | 13773 | 0 |
| C | 0 | 13810 | 0 |
| D | 0 | 23185 | 0 |
| Quadrant | Total seconds | Saturated seconds | Saturation percentage |
|---|---|---|---|
| A | 6293 | 44 | 0.699190% |
| B | 6293 | 78 | 1.239472% |
| C | 6294 | 83 | 1.318716% |
| D | 6294 | 712 | 11.312361% |
Noise dominated data is calculated using 1-second bins in cleaned event files. If a bin has >2000 counts, and if more than 50% of those come from <1% of pixels, then it is considered to be noise-dominated and hence unusable.
| Quadrant | # 1 sec bins | Bins with >0 counts | Bins with >2000 counts | High rate bins dominated by noise | Noise dominated (total time) | Noise dominated (detector-on time) | Marked lightcurve |
|---|---|---|---|---|---|---|---|
| A | 7583 | 6294 | 0 | 0 | 0.00% | 0.00% | 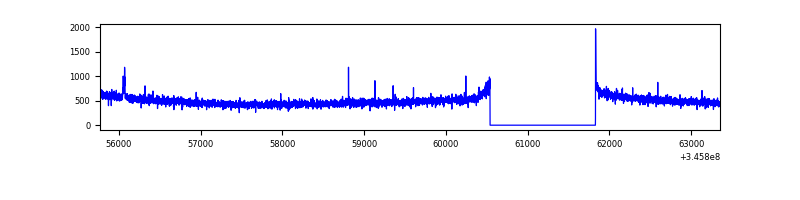 |
| B | 7583 | 6293 | 6 | 6 | 0.08% | 0.10% | 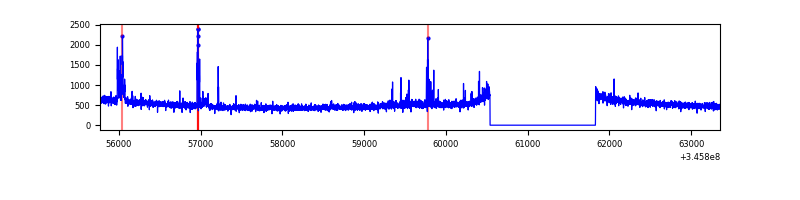 |
| C | 7584 | 6295 | 0 | 0 | 0.00% | 0.00% |  |
| D | 7584 | 6295 | 733 | 733 | 9.67% | 11.64% |  |
Top three noisy pixels from each quadrant. If the there are fewer than three noisy pixels in the level2.evt file, extra rows are filled as -1
| Pixel properties | Quadrant properties | ||||||
|---|---|---|---|---|---|---|---|
| Quadrant | DetID | PixID | Counts | Sigma | Mean | Median | Sigma |
| A | 13 | 254 | 9643 | 55.64 | 803 | 791 | 159.1 |
| A | 3 | 137 | 7204 | 40.31 | 803 | 791 | 159.1 |
| A | 0 | 226 | 6808 | 37.82 | 803 | 791 | 159.1 |
| B | 10 | 245 | 95501 | 632.24 | 803 | 783 | 149.8 |
| B | 0 | 230 | 32570 | 212.18 | 803 | 783 | 149.8 |
| B | 12 | 111 | 17974 | 114.75 | 803 | 783 | 149.8 |
| C | 14 | 238 | 129571 | 723.59 | 775 | 781 | 178.0 |
| C | 3 | 233 | 97190 | 541.66 | 775 | 781 | 178.0 |
| C | 1 | 16 | 7609 | 38.36 | 775 | 781 | 178.0 |
| D | 1 | 52 | 2921220 | 16423.27 | 749 | 726 | 177.8 |
| D | 5 | 222 | 359248 | 2016.13 | 749 | 726 | 177.8 |
| D | 2 | 250 | 109164 | 609.8 | 749 | 726 | 177.8 |
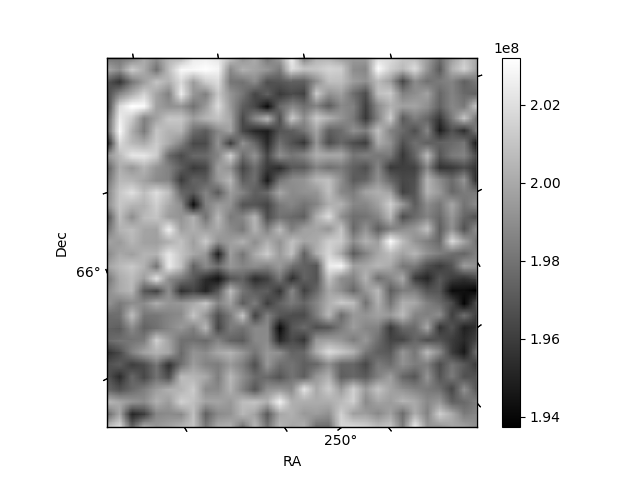
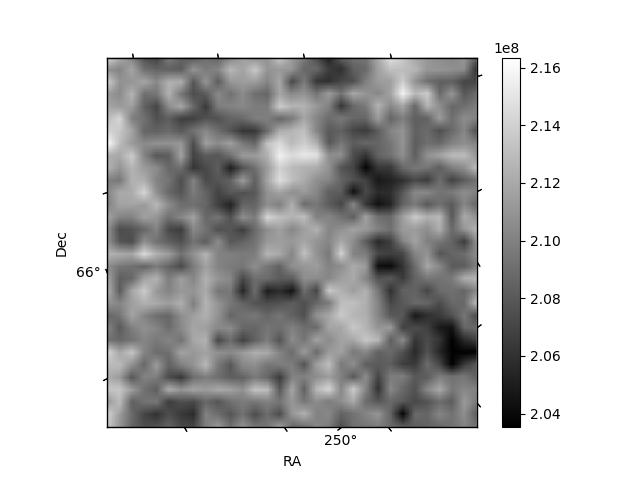
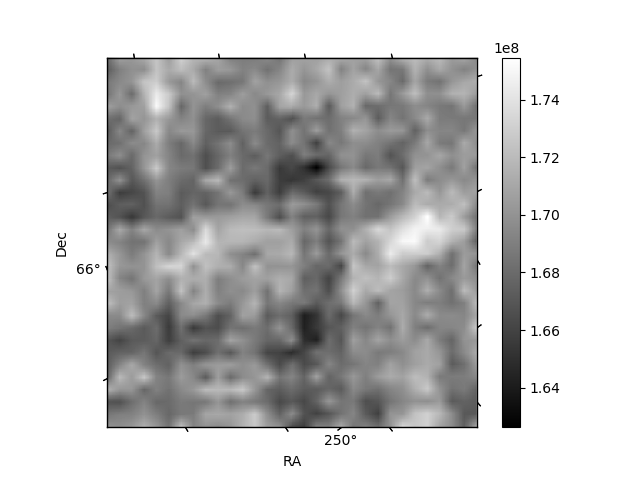
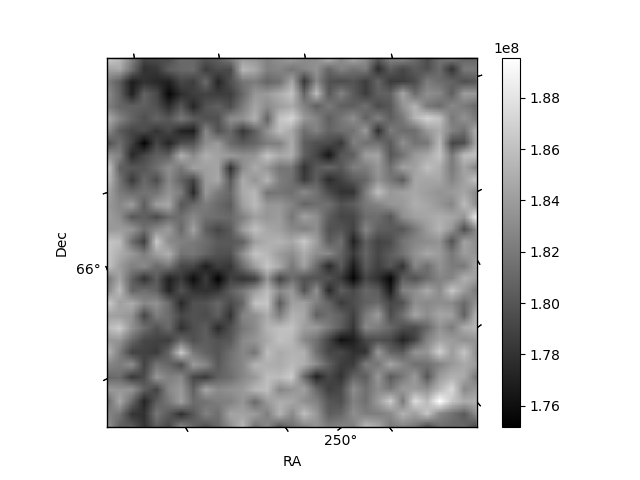
Histogram calculated using DETX and DETY for each event in the final _common_clean file
| Quadrant A |  |
 |
Quadrant B |
|---|---|---|---|
| Quadrant D |  |
 |
Quadrant C |
| Plot type | Count rate plots | Images |
|---|---|---|
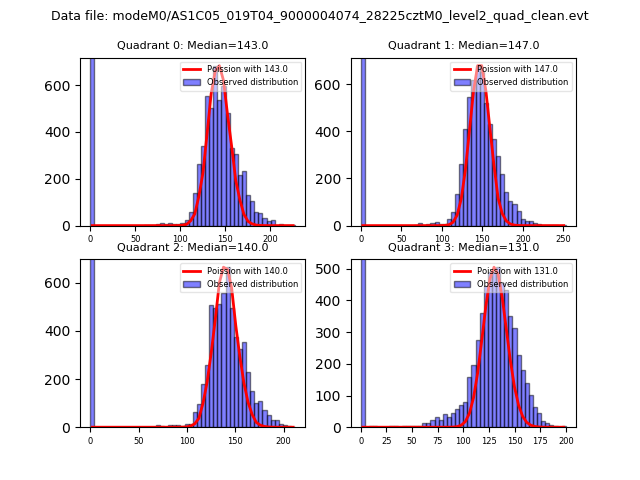
| Comparison with Poisson distribution Blue bars denote a histogram of data divided into 1 sec bins. Red curve is a Poisson curve with rate = median count rate of data. |
 |
 |
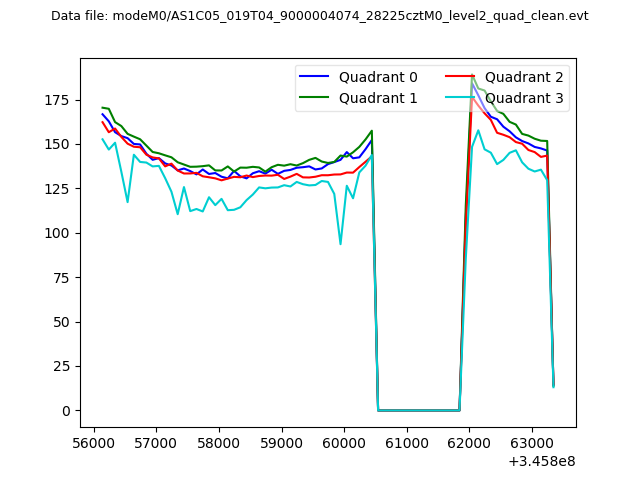
| Quadrant-wise count rates Data is divided into 100 sec bins |
 |
|
| Module-wise count rates for Quadrant A Data is divided into 100 sec bins |
 |
 |
| Module-wise count rates for Quadrant B Data is divided into 100 sec bins |
 |
 |
| Module-wise count rates for Quadrant C Data is divided into 100 sec bins |
 |
 |
| Module-wise count rates for Quadrant D Data is divided into 100 sec bins |
 |
 |
| Parameter | Plot |
|---|---|
| CZT HV Monitor |  |
| D_VDD | 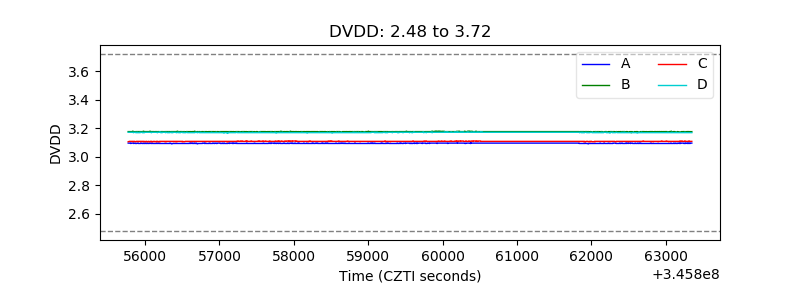 |
| Temperature 1 |  |
| Veto HV Monitor |  |
| Veto LLD |  |
| Alpha Counter |  |
| _CPM_Rate | 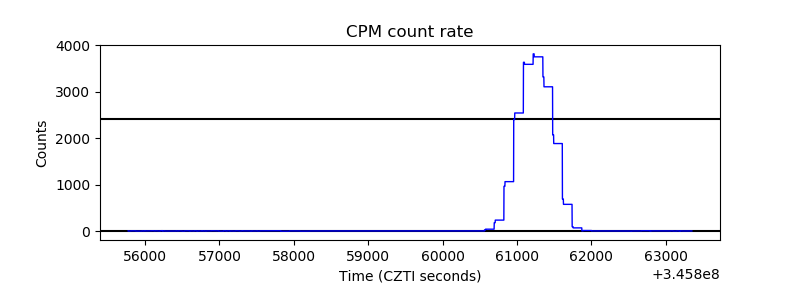 |
| CZT Counter |  |
| +2.5 Volts monitor |  |
| +5 Volts monitor |  |
| _ROLL_ROT |  |
| _Roll_DEC |  |
| _Roll_RA |  |
| Veto Counter |  |