| Param | Original file | Final file |
|---|---|---|
| Filename | modeM0/AS1C05_019T04_9000004074_28226cztM0_level2.evt | modeM0/AS1C05_019T04_9000004074_28226cztM0_level2_quad_clean.evt |
| Size (bytes) | 570,265,920 | 130,086,720 |
| Size | 543.8 MB | 124.1 MB |
| Events in quadrant A | 3,193,360 | 905,679 |
| Events in quadrant B | 3,492,556 | 930,976 |
| Events in quadrant C | 3,254,916 | 875,547 |
| Events in quadrant D | 6,893,244 | 778,345 |
| Mode M9 | |||
|---|---|---|---|
| Quadrant | BADHDUFLAG | Total packets | Discarded packets |
| A | 0 | 16 | 0 |
| B | 0 | 17 | 0 |
| C | 0 | 17 | 0 |
| D | 0 | 17 | 0 |
| Mode M0 | |||
|---|---|---|---|
| Quadrant | BADHDUFLAG | Total packets | Discarded packets |
| A | 0 | 13538 | 0 |
| B | 0 | 14482 | 0 |
| C | 0 | 13815 | 0 |
| D | 0 | 24937 | 0 |
| Quadrant | Total seconds | Saturated seconds | Saturation percentage |
|---|---|---|---|
| A | 6443 | 48 | 0.744995% |
| B | 6442 | 83 | 1.288420% |
| C | 6442 | 97 | 1.505744% |
| D | 6442 | 1130 | 17.541136% |
Noise dominated data is calculated using 1-second bins in cleaned event files. If a bin has >2000 counts, and if more than 50% of those come from <1% of pixels, then it is considered to be noise-dominated and hence unusable.
| Quadrant | # 1 sec bins | Bins with >0 counts | Bins with >2000 counts | High rate bins dominated by noise | Noise dominated (total time) | Noise dominated (detector-on time) | Marked lightcurve |
|---|---|---|---|---|---|---|---|
| A | 7763 | 6444 | 1 | 1 | 0.01% | 0.02% | 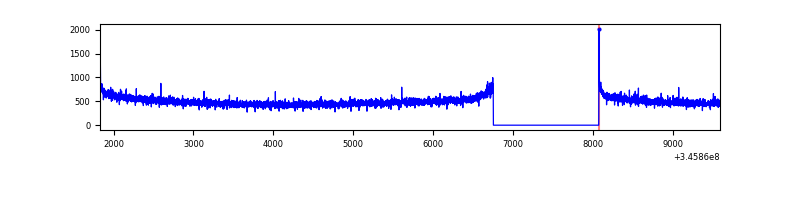 |
| B | 7762 | 6443 | 22 | 22 | 0.28% | 0.34% | 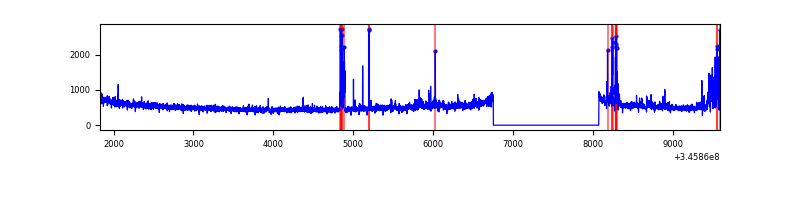 |
| C | 7762 | 6442 | 0 | 0 | 0.00% | 0.00% | 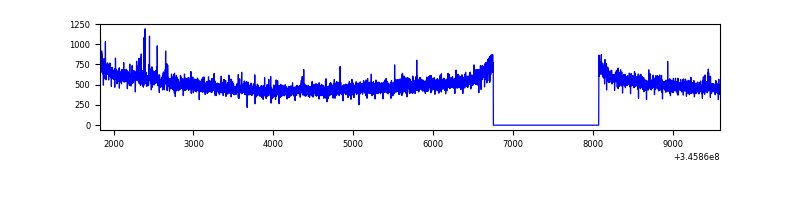 |
| D | 7762 | 6443 | 878 | 878 | 11.31% | 13.63% | 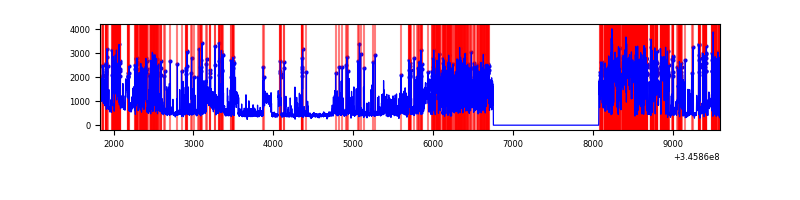 |
Top three noisy pixels from each quadrant. If the there are fewer than three noisy pixels in the level2.evt file, extra rows are filled as -1
| Pixel properties | Quadrant properties | ||||||
|---|---|---|---|---|---|---|---|
| Quadrant | DetID | PixID | Counts | Sigma | Mean | Median | Sigma |
| A | 8 | 192 | 10662 | 59.72 | 825 | 810 | 165.0 |
| A | 13 | 254 | 10446 | 58.41 | 825 | 810 | 165.0 |
| A | 3 | 137 | 7587 | 41.08 | 825 | 810 | 165.0 |
| B | 10 | 245 | 156828 | 1026.8 | 823 | 804 | 152.0 |
| B | 5 | 255 | 58299 | 378.38 | 823 | 804 | 152.0 |
| B | 0 | 183 | 20249 | 127.97 | 823 | 804 | 152.0 |
| C | 14 | 238 | 132949 | 729.97 | 788 | 795 | 181.0 |
| C | 3 | 233 | 45363 | 246.18 | 788 | 795 | 181.0 |
| C | 13 | 61 | 5371 | 25.28 | 788 | 795 | 181.0 |
| D | 1 | 52 | 3520102 | 20119.63 | 736 | 716 | 174.9 |
| D | 5 | 222 | 260210 | 1483.48 | 736 | 716 | 174.9 |
| D | 12 | 233 | 132009 | 750.58 | 736 | 716 | 174.9 |
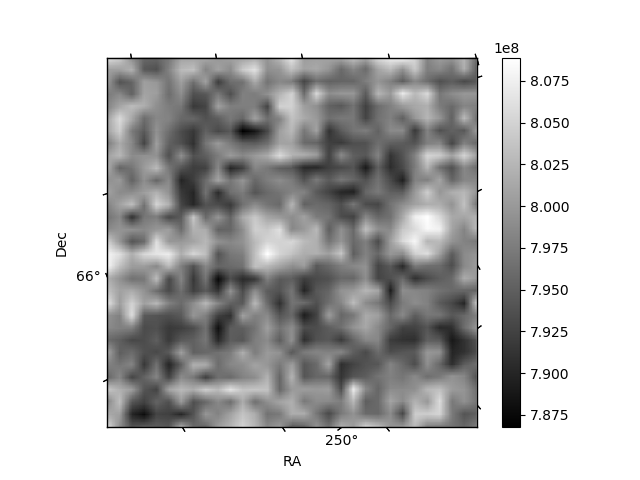
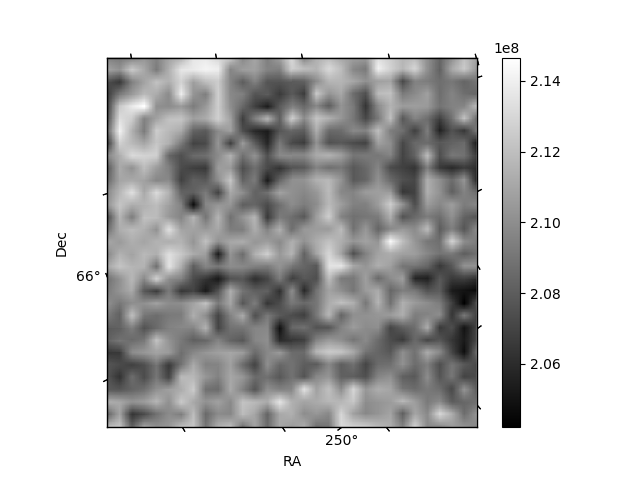
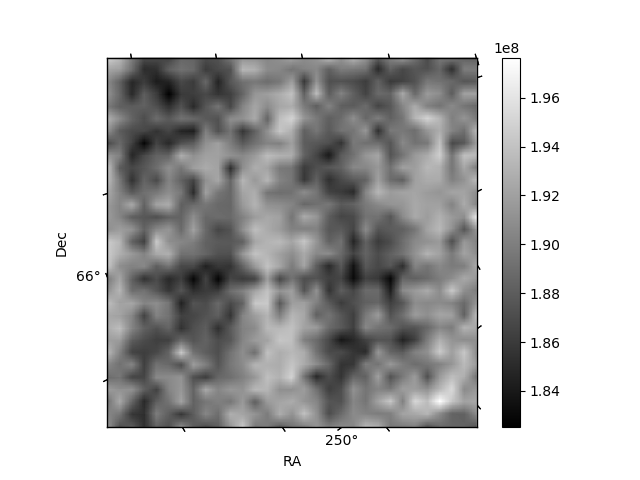
Histogram calculated using DETX and DETY for each event in the final _common_clean file
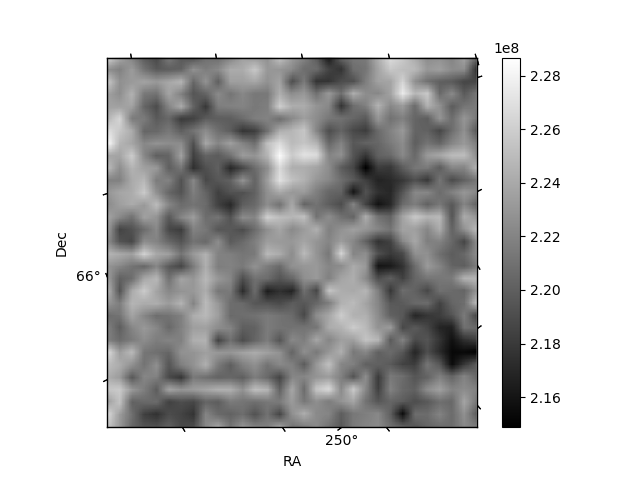
| Quadrant A | 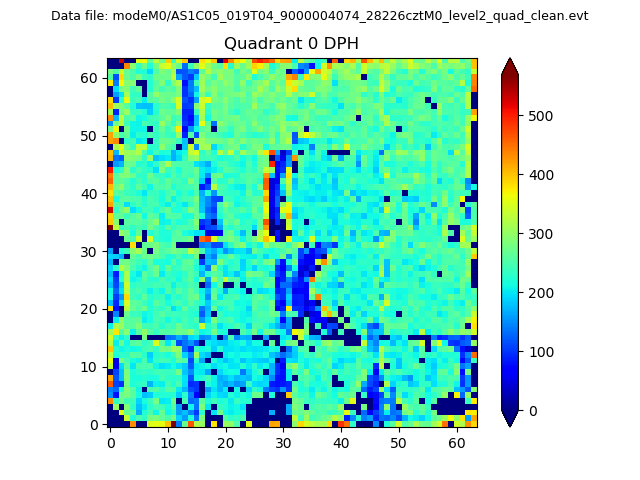 |
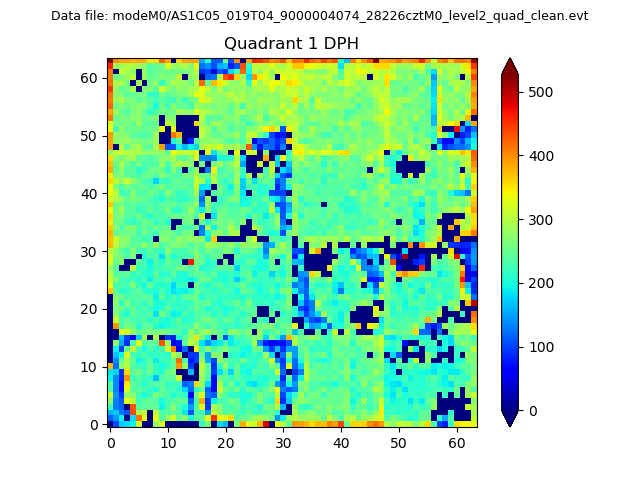 |
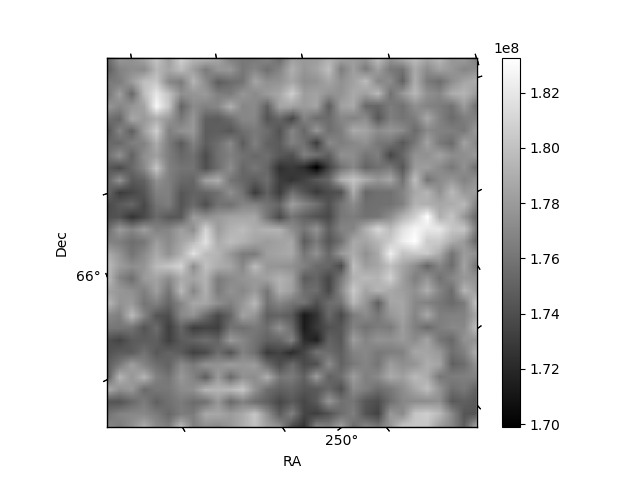
Quadrant B |
|---|---|---|---|
| Quadrant D | 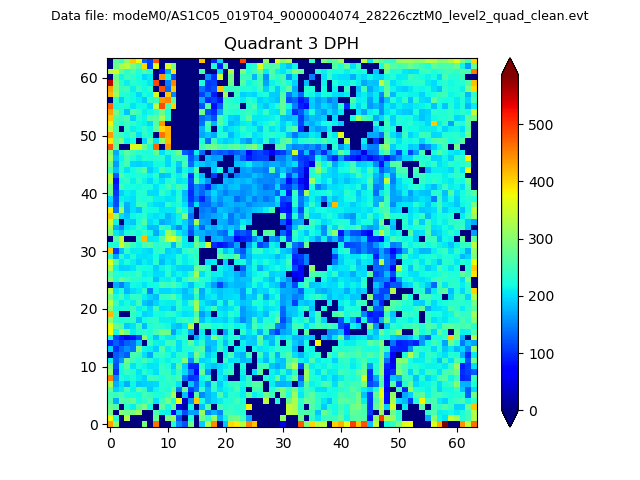 |
 |
Quadrant C |
| Plot type | Count rate plots | Images |
|---|---|---|
| Comparison with Poisson distribution Blue bars denote a histogram of data divided into 1 sec bins. Red curve is a Poisson curve with rate = median count rate of data. |
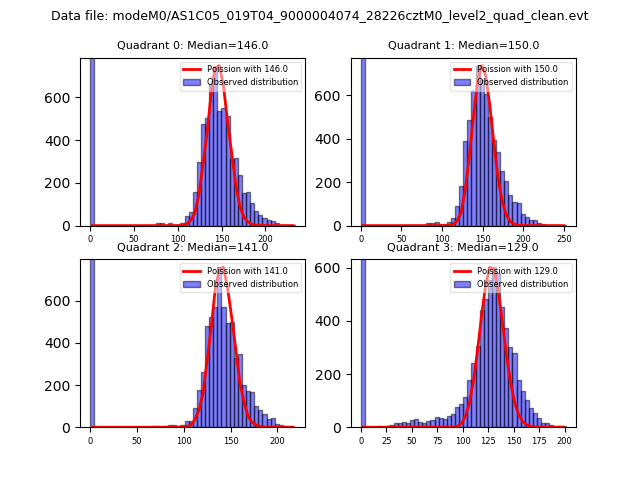 |
 |
| Quadrant-wise count rates Data is divided into 100 sec bins |
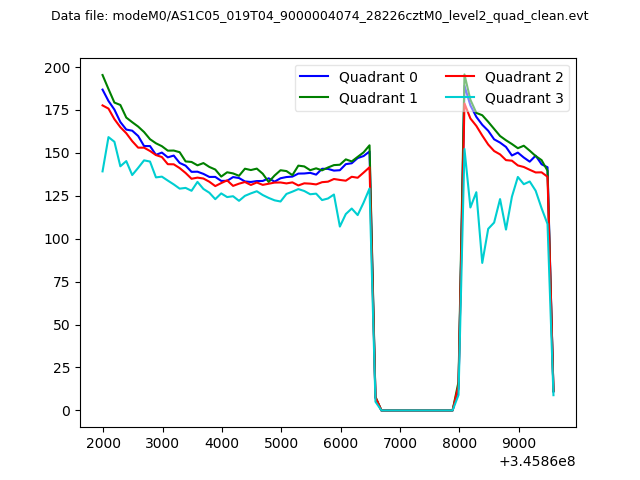 |
|
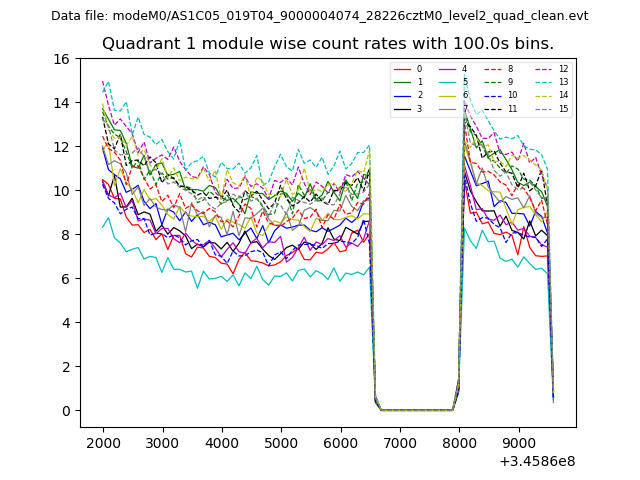
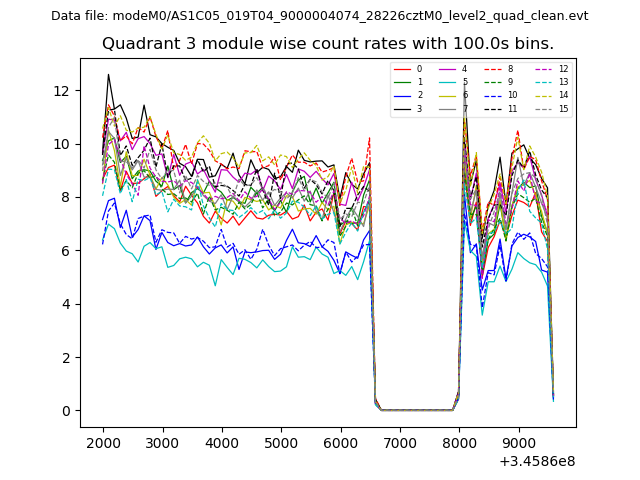
| Module-wise count rates for Quadrant A Data is divided into 100 sec bins |
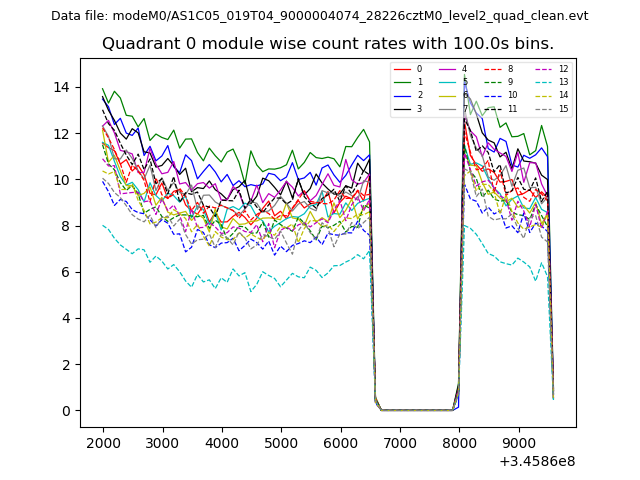 |
 |
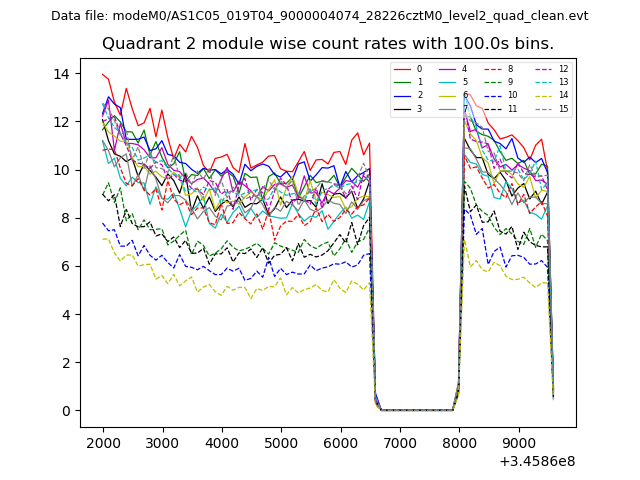
| Module-wise count rates for Quadrant B Data is divided into 100 sec bins |
 |
 |
| Module-wise count rates for Quadrant C Data is divided into 100 sec bins |
 |
 |
| Module-wise count rates for Quadrant D Data is divided into 100 sec bins |
 |
 |
| Parameter | Plot |
|---|---|
| CZT HV Monitor | 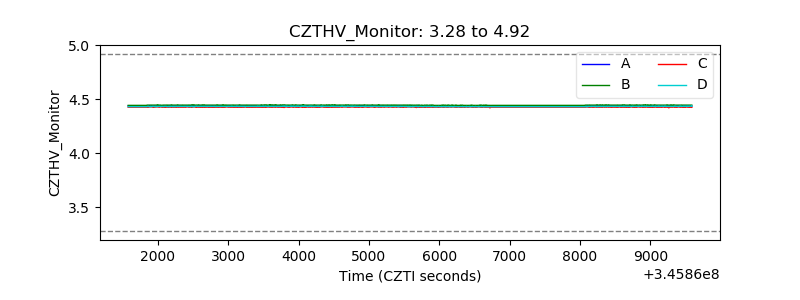 |
| D_VDD | 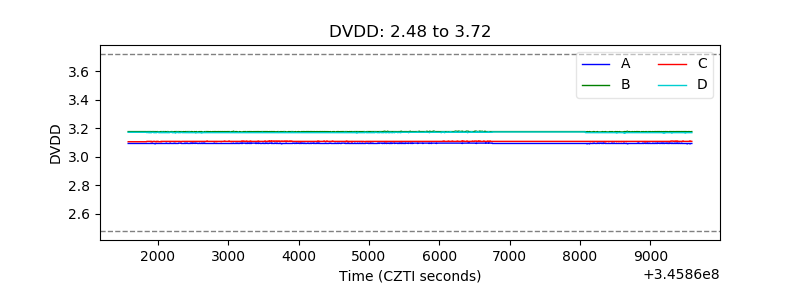 |
| Temperature 1 | 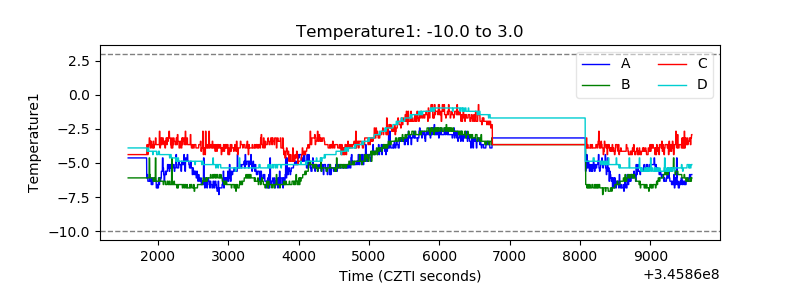 |
| Veto HV Monitor | 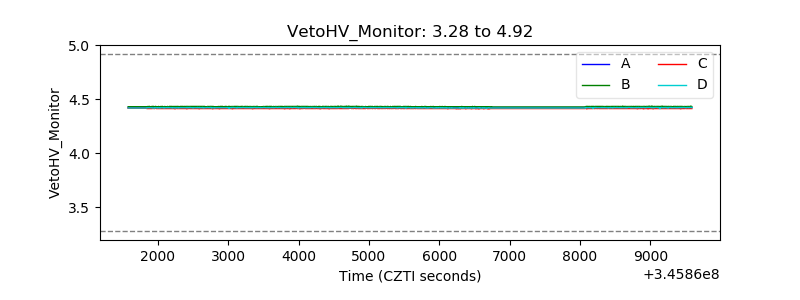 |
| Veto LLD | 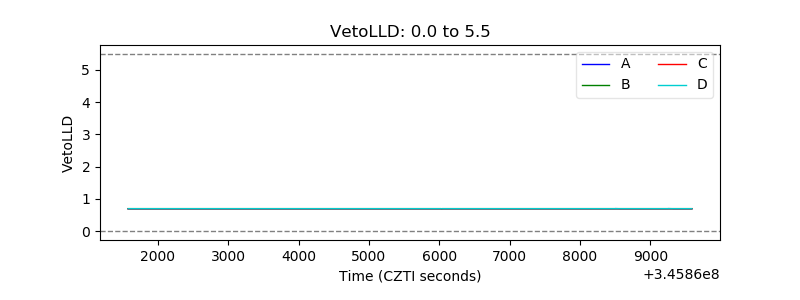 |
| Alpha Counter | 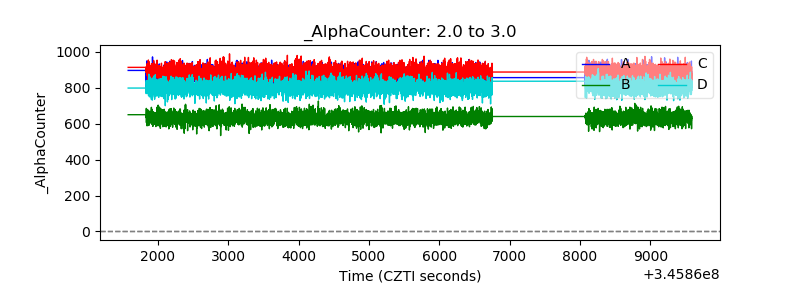 |
| _CPM_Rate | 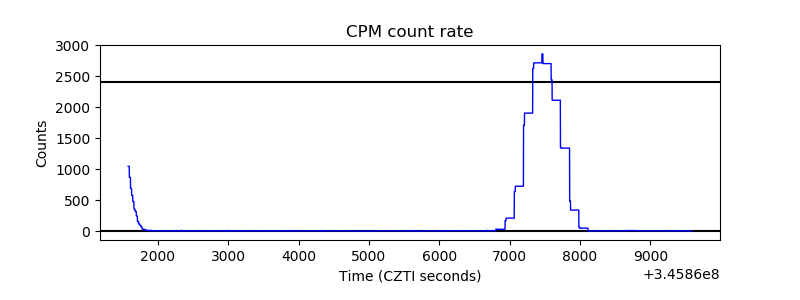 |
| CZT Counter | 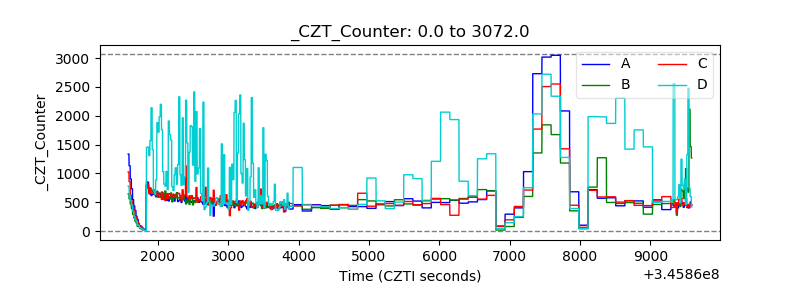 |
| +2.5 Volts monitor |  |
| +5 Volts monitor |  |
| _ROLL_ROT | 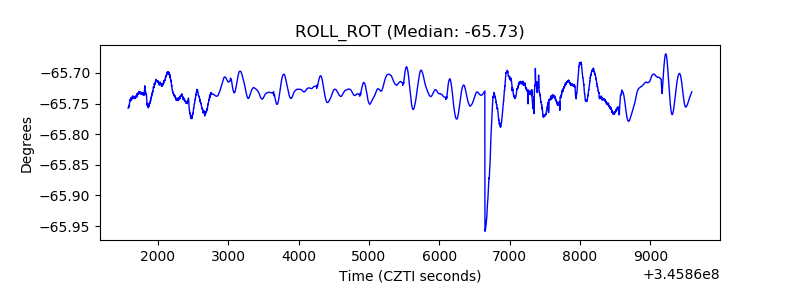 |
| _Roll_DEC |  |
| _Roll_RA | 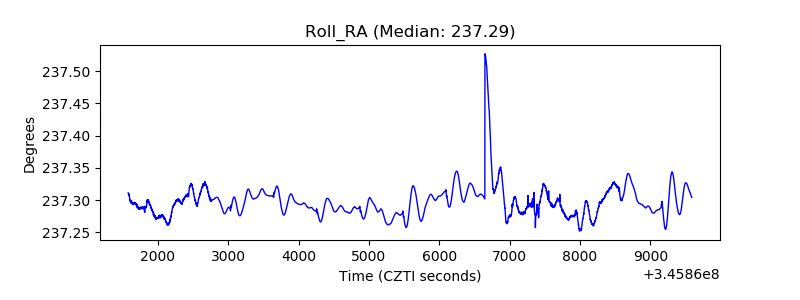 |
| Veto Counter | 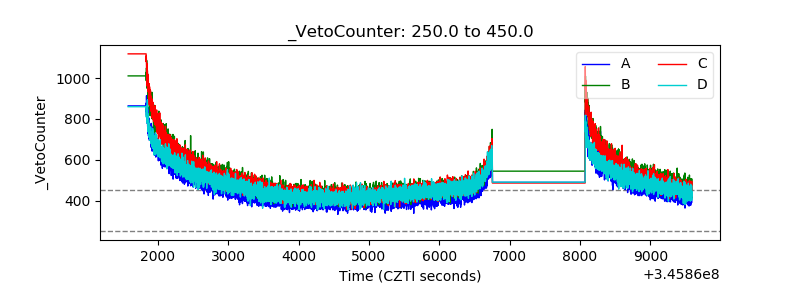 |